
Useful logs and how to check them
Log files make it possible to monitor app workflows to understand what exactly goes wrong in case of an issue. In the logs, you can look for exceptions, warnings, specific processes, and so on.
Access logs
To access logs, follow the steps below:
Log in to the Master server via SSH.
Go to the
logsdirectory:cd ${TOMCAT_HOME}/logs
Examples of ${TOMCAT\_HOME} are /opt/workfusion/workfusion (on-premise) or /opt/tomcat (cloud).
important
To access the directory, proper permissions are required—either a tomcat user or sudo.
The most essential logs include the following:
catalina.outrepresenting major Control Tower (CT) workflowsgc.logcontaining garbage collector (GC) datacontrol-tower.log.jsoncomprising info about API calls
View Control Tower logs
catalina.out
This is the main log file with all basic information and Control Tower (CT) workflows, except for Bot Configs.
Sample usage commands are as follows:
tail -f -n 100 catalina.outprints the last 100 lines ofcatalina.outand outputs appended data as the file grows.tail -n 500 catalina.out | grep -i exceptiontakes the last 500 lines from thecatalina.outlog and prints those with the exception mentions (case-insensitive).grep -i "Saving qualification" catalina.out| tail -1finds the last case-insensitive occurrence of a test.grep -i "\[WorkFusion_Worker-82\]" catalina.outfinds all info for a single thread, for example, worker.grep -i "2020-05-22 12:53:52 \[WorkFusion_Worker-82\] QualificationService \[DEBUG\]" -B 20 -A 30 catalina.outprints 20 lines before and 30 lines after a text match. Note that the "[" symbol is escaped.grep -i "org.postgresql.util.PSQLException" -C 50 catalina.outprints 50 lined before and after a text occurrence.
configuration.log
The log contains data regarding an application start and health-check API responses.
Error example in configuration.log:
2020-05-22 11:51:42 [localhost-startStop-1] WorkfusionHealthChecker [DEBUG] ===============  Health Check Result ================
2020-05-22 11:51:42 [localhost-startStop-1] WorkfusionHealthChecker [DEBUG] {
  "name": "Some name",
  "status": "ERROR",
  "errorCount": 1,
  "warningCount": 1,
  "errors": [],
  "warnings": [],
  "infos": [],
  "components": []
}
control-tower.log.json
The log contains logged API calls with bodies, headers, and so on.
taskRedistribution.log
The log displays information related to the distribution and redistribution of tasks.
performance-metrics.log
The log contains info about the time spent on method processing, for example, the HIT rendering time, HitApplicationService.processReviewableHIT.timer, and so on.
Metrics are gathered using the Coda Hale (Dropwizard) components and dropped to the performance-metrics.log file every minute.
| Metric | Description |
|---|---|
HtmlRenderServlet.doPost | Time in ms to render a Manual Task for a worker |
ReviewableHitProcessor.process | Time in ms to review a Manual Task with submitted answers |
RunStatsUpdateStripedRunnable.updateRunStats | Time in ms to update the Business Process (BP) step stats, such as completion progress, involved workers, and so on |
GetSandboxReviewableTasks/GetProductionReviewableTasks | Time in ms to check and retrieve Manual Tasks with submitted answers from a Crowd in a development or production environment |
AmazonClientAdapter.processCreateHITs | Time in ms to check whether manual step records require submission to a Crowd and schedule such tasks to the BP lifecycle executor (BPLE) |
AmazonClientAdapter.HitRedistributionSandbox/AmazonClientAdapter.HitRedistributionProd | Time in ms to redistribute tasks in multi-crowd setups |
AmazonClientAdapter.startStreamingEventProcessors | Time in ms to check whether manual step records require transition to subsequent steps and schedule such tasks to BPLE |
ProcessCompletedMachineRunService.processCompletedMachineRuns | Time in ms to check whether bot step records require transition to subsequent steps and schedule such tasks to BPLE |
BatchedCompositeStepTransitionService.performTransition | Time in ms for transiting a ready record from a step |
SnapshotBuilderImpl.generateSnapshot | Time in ms to generate a step snapshot |
TaskSubmissionListener.submitData | Time in ms to record a worker answer upon submission |
HitSortingService.processHitSorting | Time in ms for sorting manual records according to specified comparators |
AssignmentForHitProcessingService.processAssignment | Time in ms to convert a recorded worker answer to a Manual Task according to database (DB) table records |
WorkflowDesignerListService.createElementsTree | Time in ms to prepare draggable elements on the Workflow Designer page. |
Via the workfusion.properties configuration file, you can also enable logging of the following optional metrics:
- Set
striped.runnable.queue.wait.report=trueto add optional metrics in the QueueWait format for BPLE tasks. It measures the difference in ms between tasks being scheduled and the beginning of their execution. You should check it in case of a slow record transition in a BP. - Set
thread.allocated.bytes.report=trueto add optional metrics in the MemoryAllocation format for record transition and manual record review tasks. It measures the RAM in bytes allocated for task execution.
Use JVM logs
gc.log
The file contains garbage collector workflow logs. You can analyze the log using GC tools, for example, GCViewer or GCEasy.
Usage examples for GCViewer:
Check the Total heap and Used heap graphics. The used heap should be less than the total heap value. Also, enable the GC times Lines and Full GC line charts. If you see the situation when GC doesn't affect the used heap value (it doesn't get smaller), go to the thread dump and check what processes take a lot of memory.
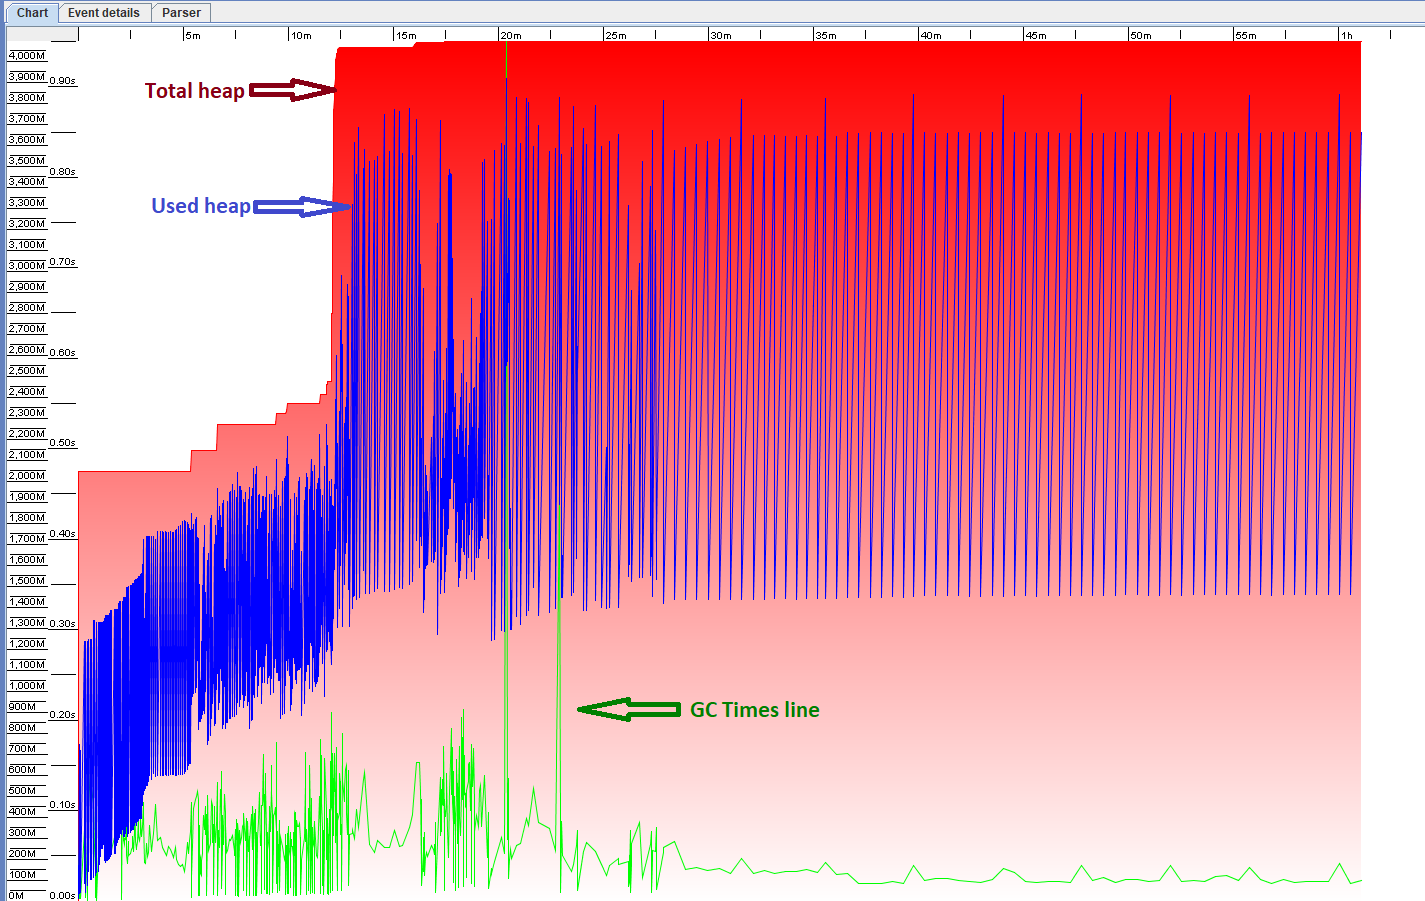
Check the accumulated pause time and divide the total server working time by it. If pauses take more than ~10% percent, check the memory allocation across processes in the thread dump.

Below is a sample analysis without graphic tools. Find the <tomcat>/logs/gc.log login.
[root@app1 ~]# tail -n 10 /opt/workfusion/workfusion/logs/gc.log
2020-05-17T02:36:12.911-0400: 209497.962: [GC pause (G1 Evacuation Pause) (young) 4091M->931M(4452M), 0.0861975 secs]
2020-05-17T02:51:44.700-0400: 210429.752: [GC pause (G1 Evacuation Pause) (young) 3969M->946M(4452M), 0.0877870 secs]
2020-05-17T03:07:09.552-0400: 211354.604: [GC pause (G1 Evacuation Pause) (young) 4081M->934M(4452M), 0.0804922 secs]
2020-05-17T03:22:21.867-0400: 212266.919: [GC pause (G1 Evacuation Pause) (young) 4096M->934M(4456M), 0.0851796 secs]
In the example above, pauses happen once in 15 mins and take 0.08 s. Thus, there are no issues with GC. The GC processing time below 5% of the total time is normal.
In the case of GC stop-the-world pauses, the application becomes unresponsive. Especially long pauses are caused by Full GC events, for example:
2020-05-16T10:57:57.929-0400: 16401.348: [Full GC (Last ditch collection) 7457M->1382M(20G), 7.0875990 secs]