
Issues related to application performance
The article contains instructions on addressing manual step issues caused by improper Control Tower (CT) or WorkSpace (WS) performance. Read respective sections below to verify the symptoms, identify the root cause, and find a solution.
Control Tower performance
Possible symptoms of CT performance issues are as follows:
Slow submission of hits from CT
Slow execution of CT jobs, such as streaming, renewable hit processing, hit sorting, and so on
To investigate, follow the steps below:
Check performance metrics
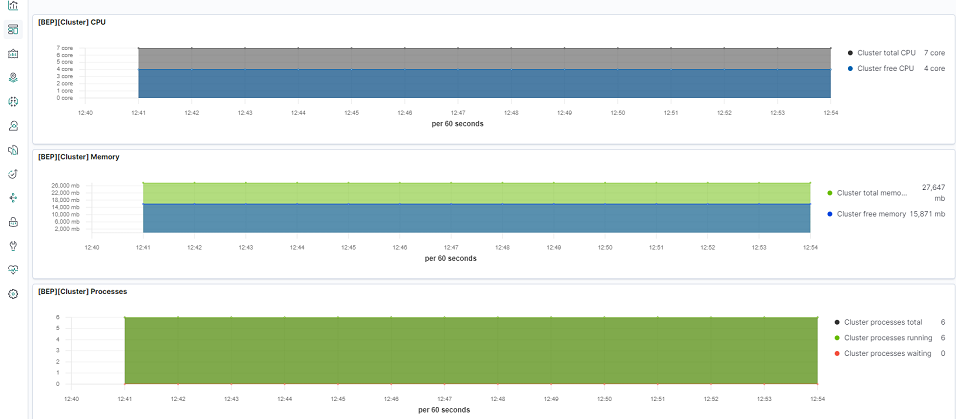
Check if the issue is reproduced at the time of the investigation. Go to Kibana and review the Cluster Utilization dashboard for any traces of the issue.
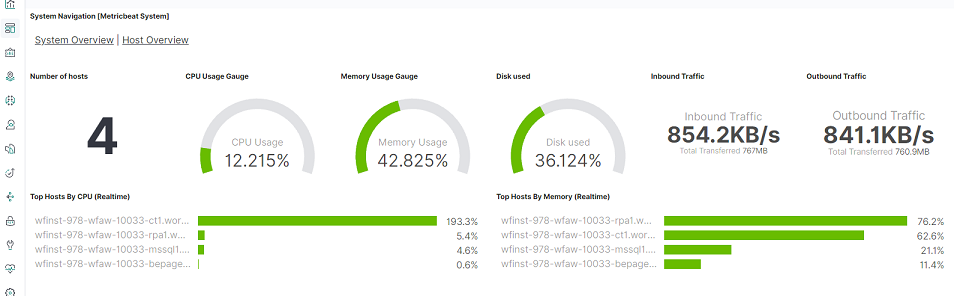
Go to the System Overview tab to examine the overall system performance host-by-host and identify which components have the heaviest workload.
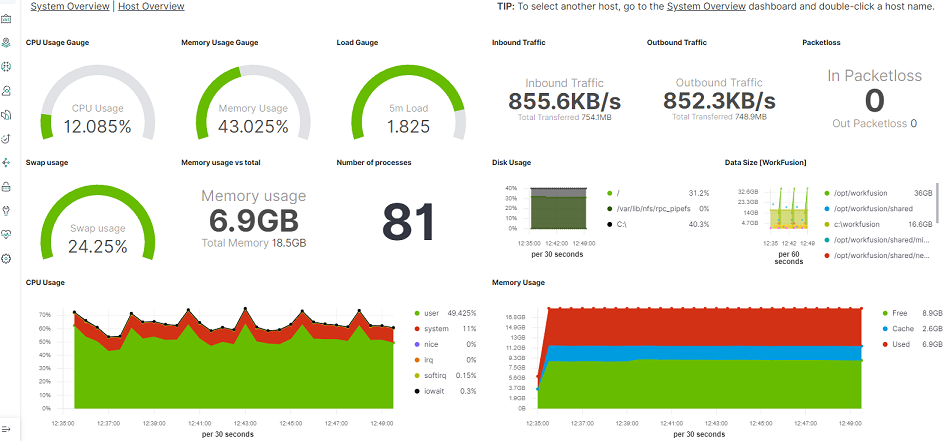
In Kibana, check the Host Overview dashboard to evaluate the CPU utilization, memory consumption, and network traffic intensity.
tip
You may also want to read Issues related to CT performance, but when you don't find answers, escalate the issue to the Support team.
Review logs
In Kibana, check the following logs for slow application performance:
- Performance metrics log for Control Tower
- Nginx log
- WorkSpace logs
- Control Tower logs
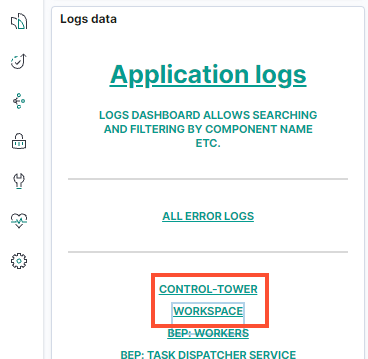
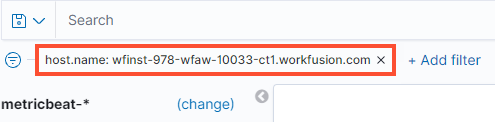
Use Discover, expand logs, and set filters to quickly find what you are looking for. Go to specific application logs, pick up the timeframe. If needed, set an additional filter for the host you want to analyze:
Then, carefully review the metricbeat and cluster.metrics logs:
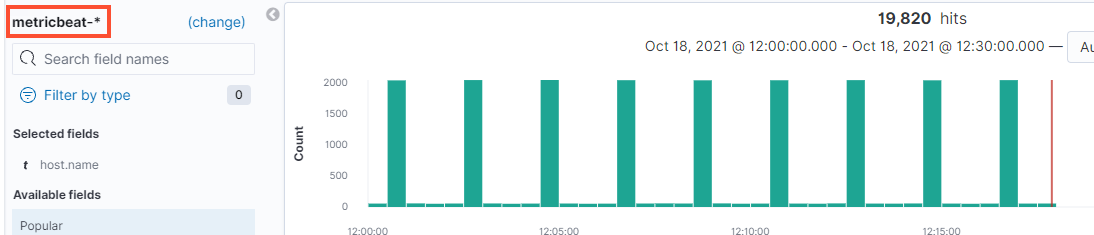
The logs can look similar to the example below and provide lots of useful information, such as:
Process description
Event time and duration
Involved resources and so on
@timestamp                          Oct 18, 2021 @ 12:29:34.453
@version                            1
_id                                 1X7zknwBhBHF1ndnEVZd
_index                              metricbeat-7.5.2-2021.10.18
_score                              -
_type                               _doc
agent.ephemeral_id                  af73ea40-425d-47de-9a60-2603d20a1e26
agent.hostname                      ip-10-100-1-84.ec2.internal
agent.id                            a5a03034-d0f3-41c4-9787-afcb7fa6ebae
agent.name                          wfinst-978-wfaw-10033-ct1.workfusion.com
agent.type                          metricbeat
agent.version                       7.5.2
ecs.version                         1.1.0
event.dataset                       system.process
event.duration                      146,215,593
event.module                        system
fields.ns                           int
host.name                           wfinst-978-wfaw-10033-ct1.workfusion.com
metricset.name                      process
metricset.period                    30000
process.args                        python, /opt/workfusion/tools/zookeeper/bin/zookeeper-backup.py, -c, /opt/workfusion/tools/zookeeper/conf/zookeeper-backup.ini, -a, daemon
process.executable                  /usr/bin/python2.7
process.name                        python
process.pgid                        3,839
process.pid                         4,358
process.ppid                        3,839
process.working_directory           /opt/workfusion/zookeeper/datalog/version-2
service.type                        system
system.process.cmdline  python      /opt/workfusion/tools/zookeeper/bin/zookeeper-backup.py -c /opt/workfusion/tools/zookeeper/conf/zookeeper-backup.ini -a daemon
system.process.cpu.start_time       Oct 18, 2021 @ 11:21:52.000
system.process.cpu.total.norm.pct   0.033
system.process.cpu.total.pct        0.261
system.process.cpu.total.value      425,560
system.process.fd.limit.hard        200,000
system.process.fd.limit.soft        200,000
system.process.fd.open              29
system.process.memory.rss.bytes     16,347,136
system.process.memory.rss.pct       0.001
system.process.memory.share         1,843,200
system.process.memory.size          461,180,928
system.process.state                running
tags                                beats_input_raw_event
user.name                           wfuser
WorkSpace performance
Possible symptoms of issues in WS performance include slow assignment acceptance and submission and task handling.
To investigate, check the localhost-access logs for WorkSpace. Determine whether there are delays in user actions on the WS side and compare them to Nginx logs.
To correlate the slowdowns with user activity, read incoming request logs and match incoming tasks with events and responses.
Example 1: a user logged in and was redirected to the dashboard controller.
127.0.0.1 - - [30/Jul/2021:11:56:49 +0000] "GET /workspace/login?ldapConfigured=false&samlEnabled=true HTTP/1.1" 200 4648
127.0.0.1 - - [30/Jul/2021:11:56:50 +0000] "POST /workspace/saml/SSO HTTP/1.1" 302 -
127.0.0.1 - - [30/Jul/2021:11:56:50 +0000] "GET /workspace/login?ldapConfigured=false&samlEnabled=true HTTP/1.1" 302 -
127.0.0.1 - - [30/Jul/2021:11:56:50 +0000] "GET /workspace/dashboard HTTP/1.1" 200 36605
Example 2: a user accesses a specific task and opens it with the auto-acceptance checkbox.
127.0.0.1 - - [30/Jul/2021:12:10:24 +0000] "GET /workspace/task/CVBQ9ZDF014RKBNXYP8511ADNCHIVKBBO?autoAccept=true&ldapConfigured=false&samlEnabled=true HTTP/1.1" 200 32775
127.0.0.1 - - [30/Jul/2021:12:10:24 +0000] "GET /workspace/categories HTTP/1.1" 200 25245
The task submission log looks like this:
127.0.0.1 - - [30/Jul/2021:12:10:24 +0000] "POST /workspace/submit HTTP/1.1" 200 100
From the second end, in Nginx logs, you can track when requests are sent to WorkSpace API, as well as delays, bad request statuses, security, or other issues.
tip
Align component timezones to have a good tracking position and absolute transparency in the environment. Check component configurations and make sure there is no endpoint cross-mapping, especially when working with multiple WS and CT instances.
Analyze output
After confirming any of the issues above, gather the following statistics and escalate them to the Support team:
Kibana dashboard diagram for incoming or processed tasks over the incident time interval
Kibana System overview dashboard over the incident time interval
Error message traces from Kibana
Control Tower and WorkSpace uptime
If you fail to confirm the issues, continue the investigation.
View also: