
Monitoring overview
The monitoring solution consists of the following components:
- Kibana with system performance dashboards
- Elasticsearch for storing metrics data
- Logstash for aggregation and forwarding metrics data
Open monitoring dashboards
To browse monitoring dashboards on Kibana UI:
Go to Kibana, for example, at https://app_hostname/kibana/.
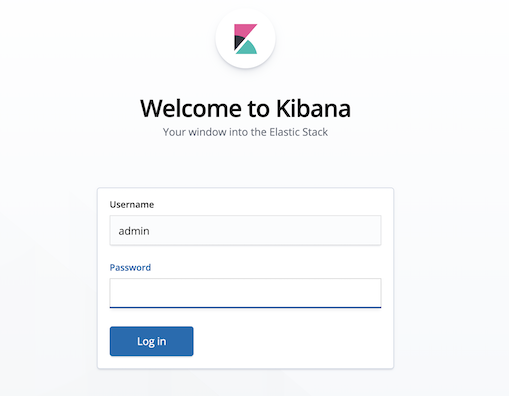
Log in to Kibana by using the predefined user admin, and the password, specified in config.yml during installation.

On the main menu, click Dashboard to open the list of preconfigured dashboards.
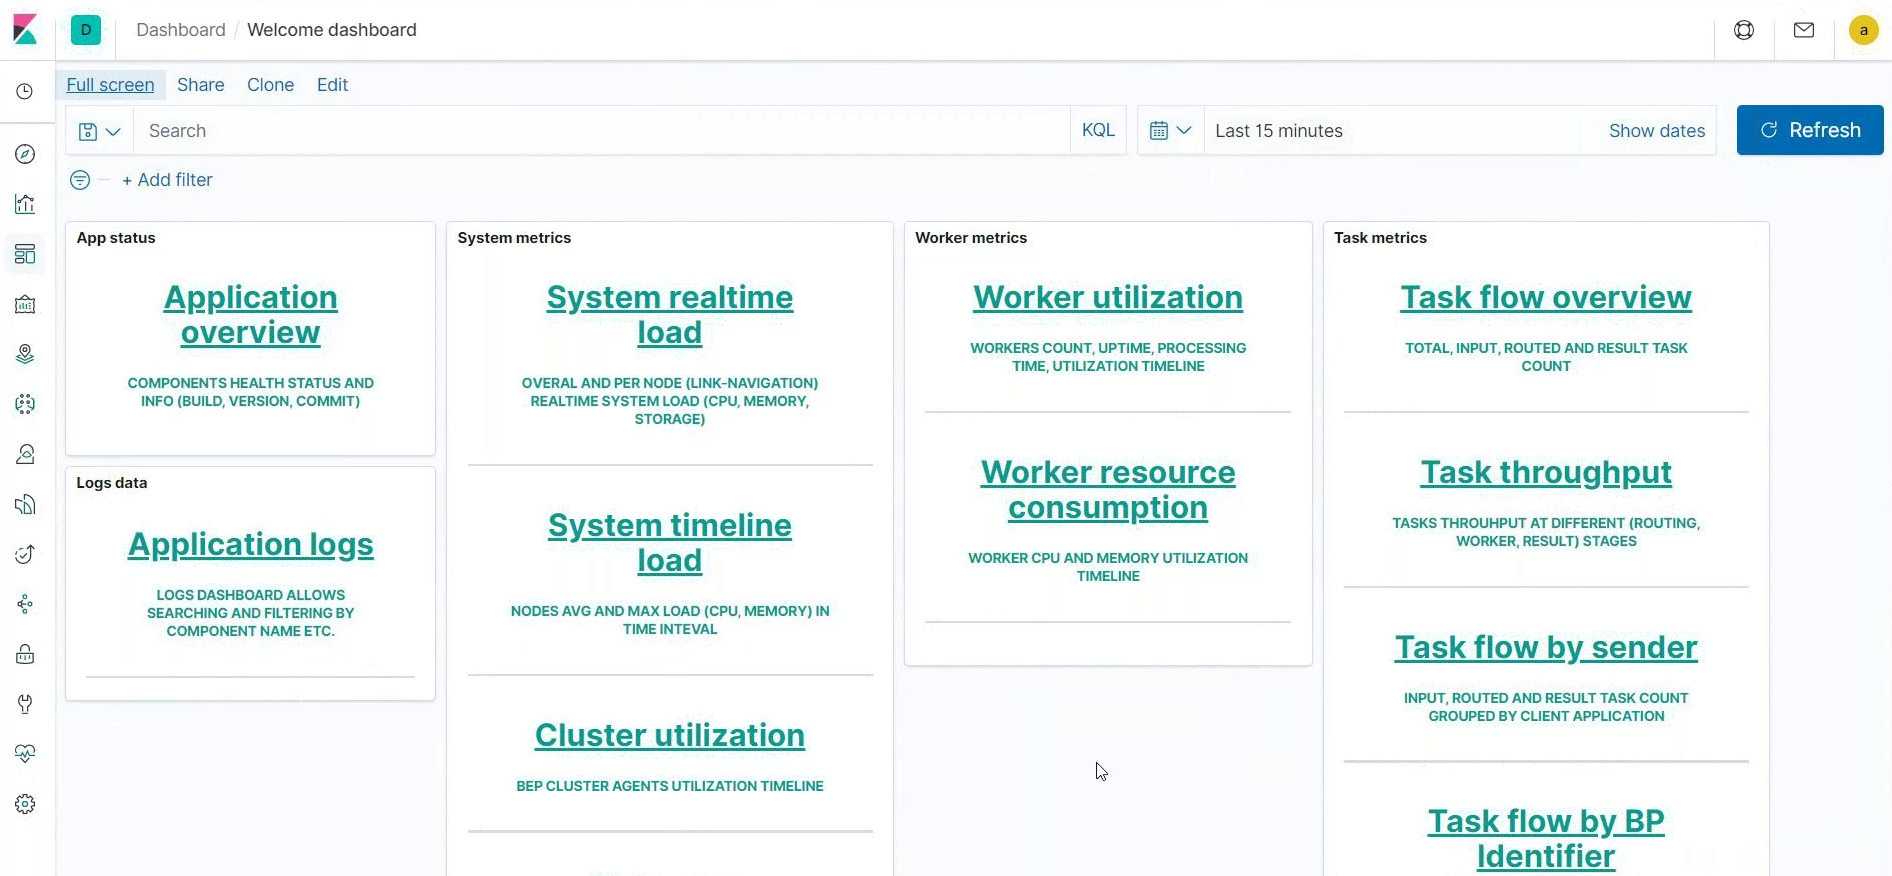
Browse dashboards
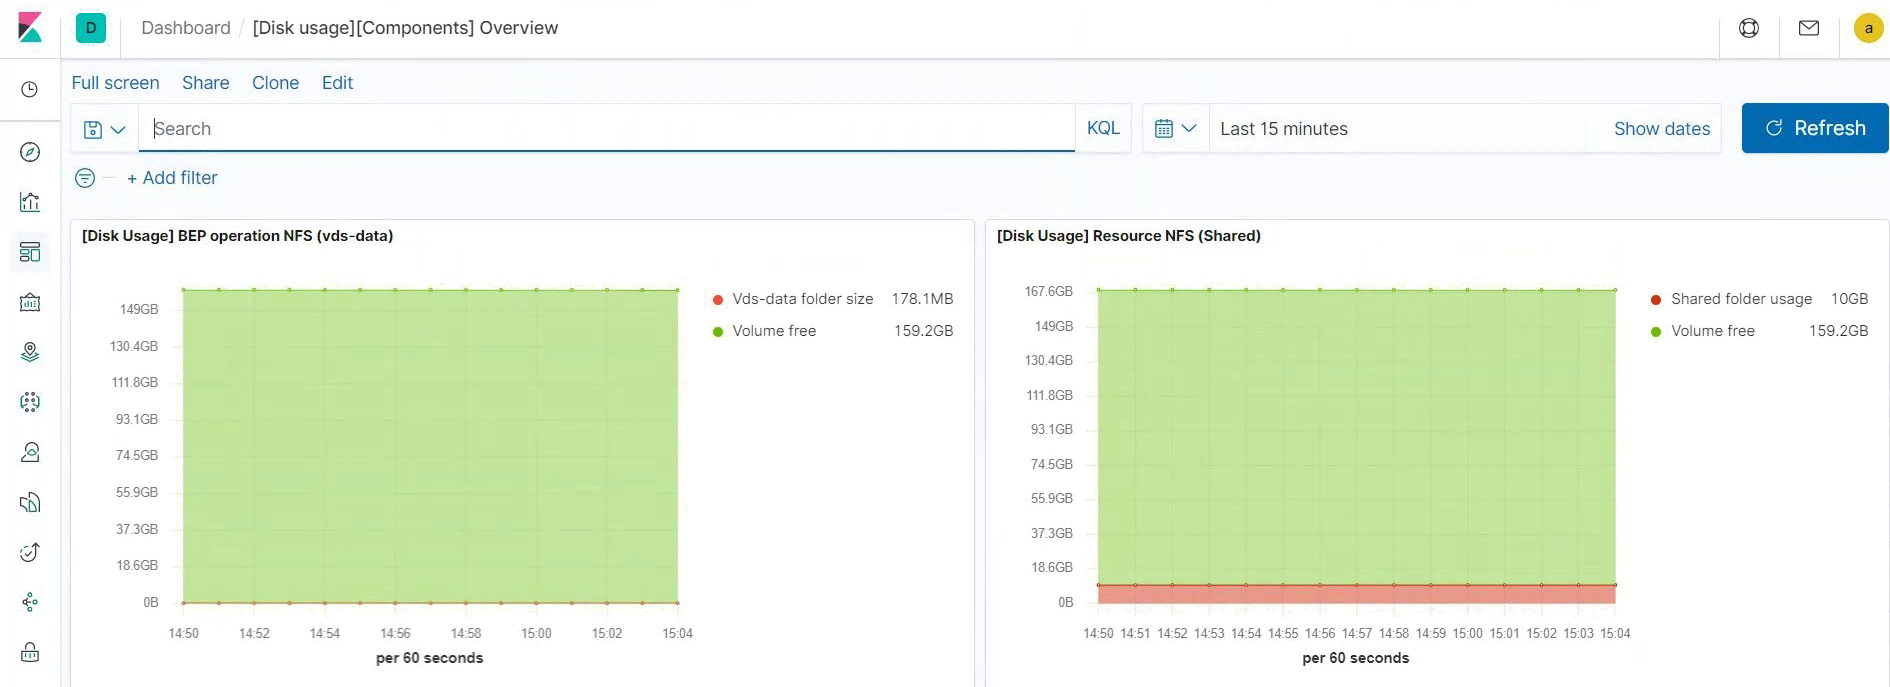
Disk usage
This dashboard contains metrics on disk usage, including available space on shared volumes, for example, on Processing (vds-data) and Resource disks.
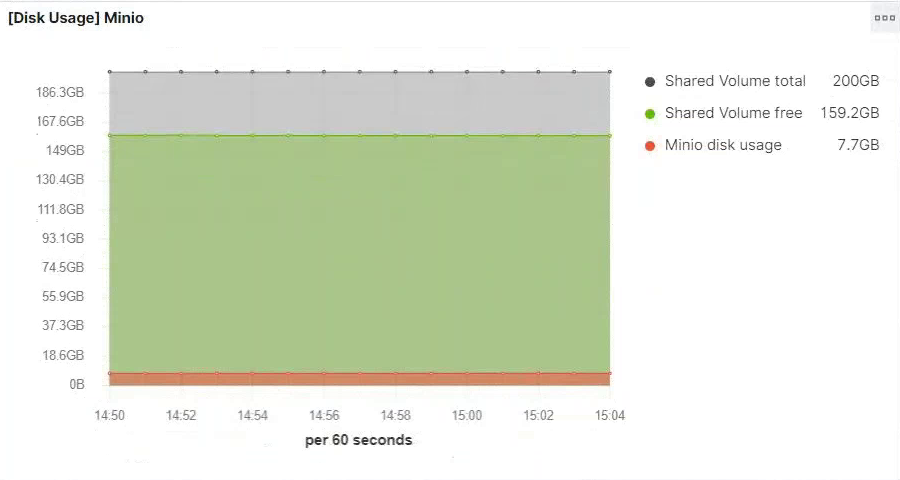
You can see disk usage details for each component, such as minio, nexus, and others. The visualization displays the total, available, and used amount of space.
Environment status
This Dashboard displays services' status of Intelligent Automation Cloud environment:
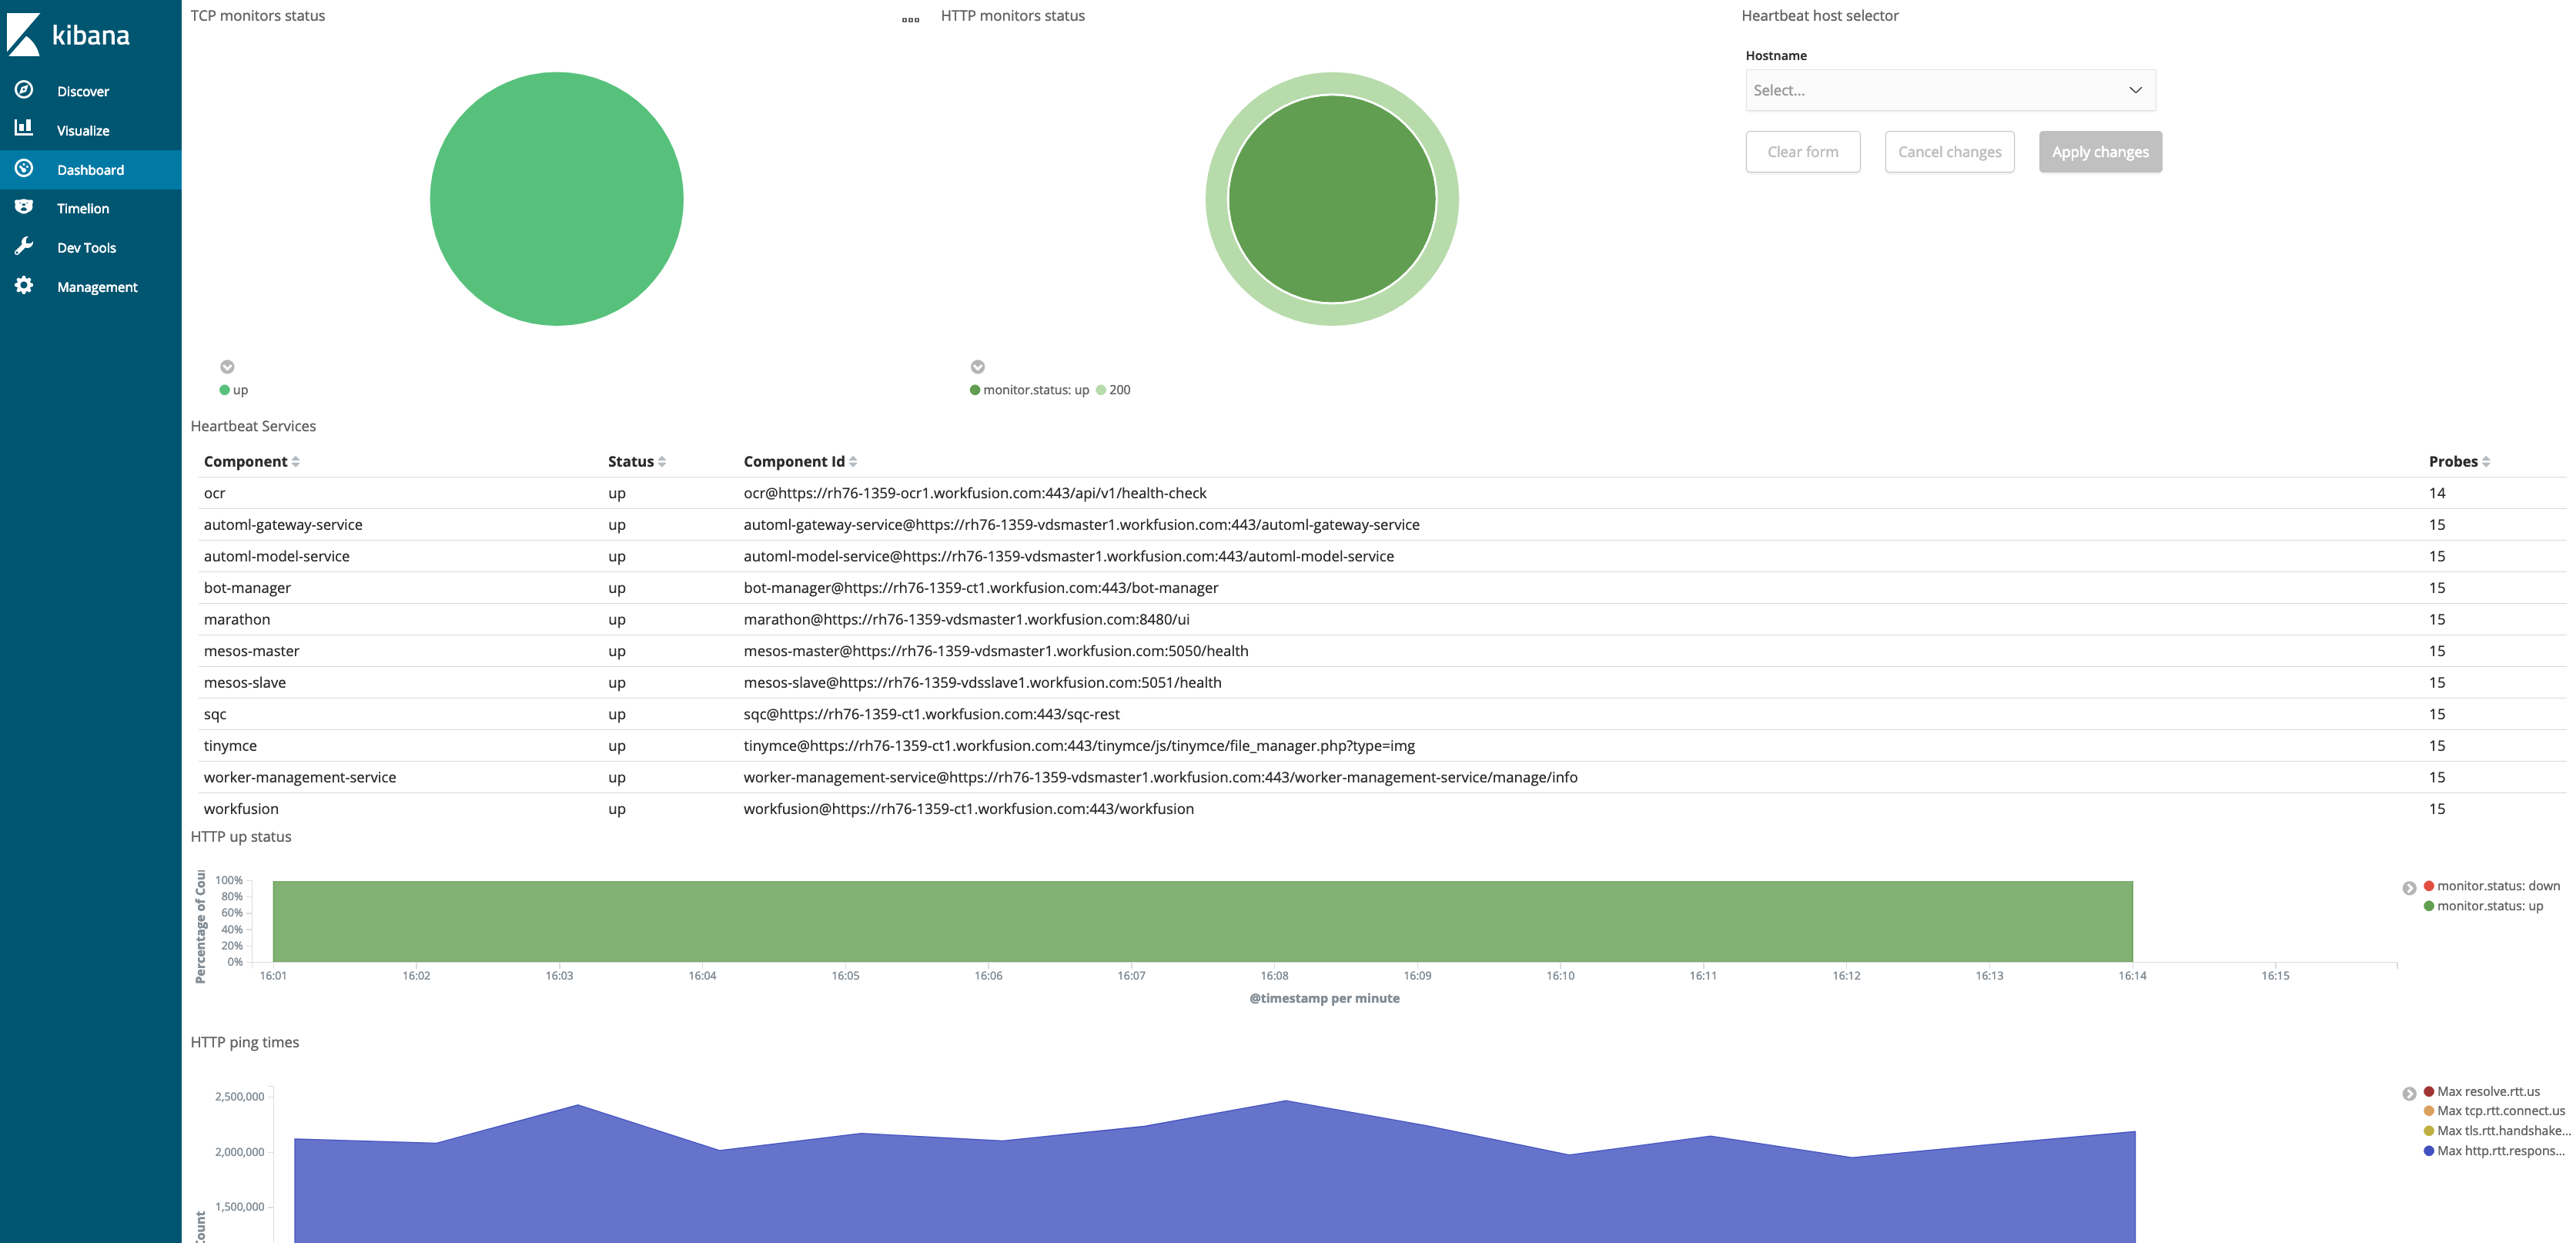
The TCP monitors status, and HTTP monitors status diagrams display the overall status:
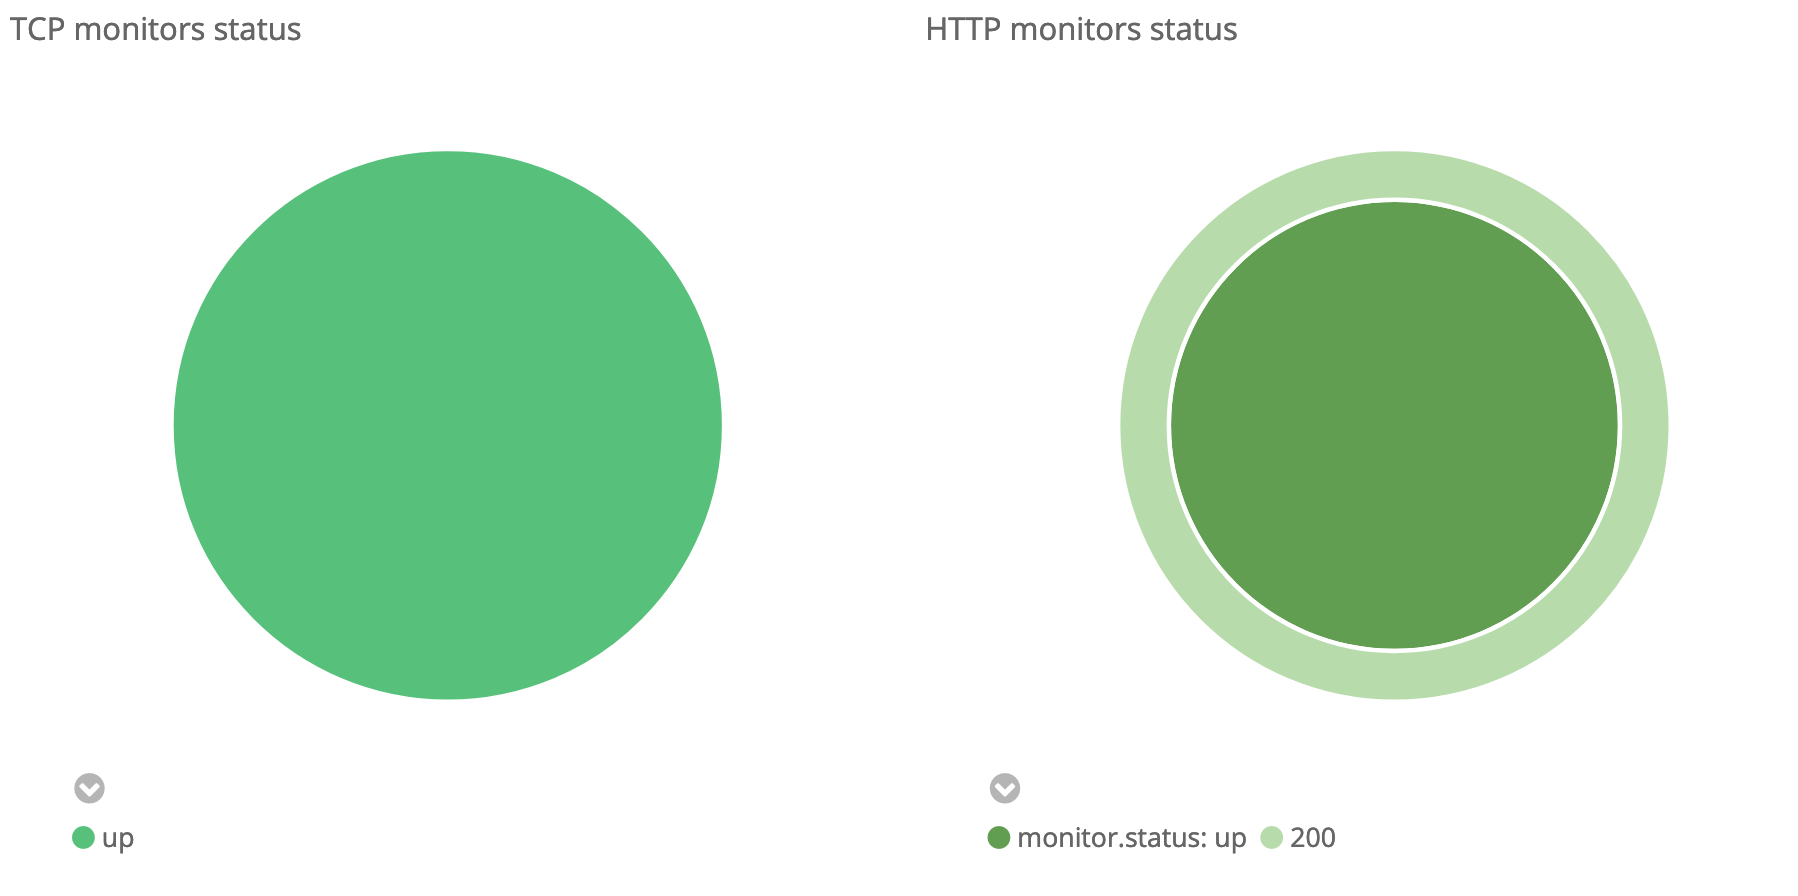
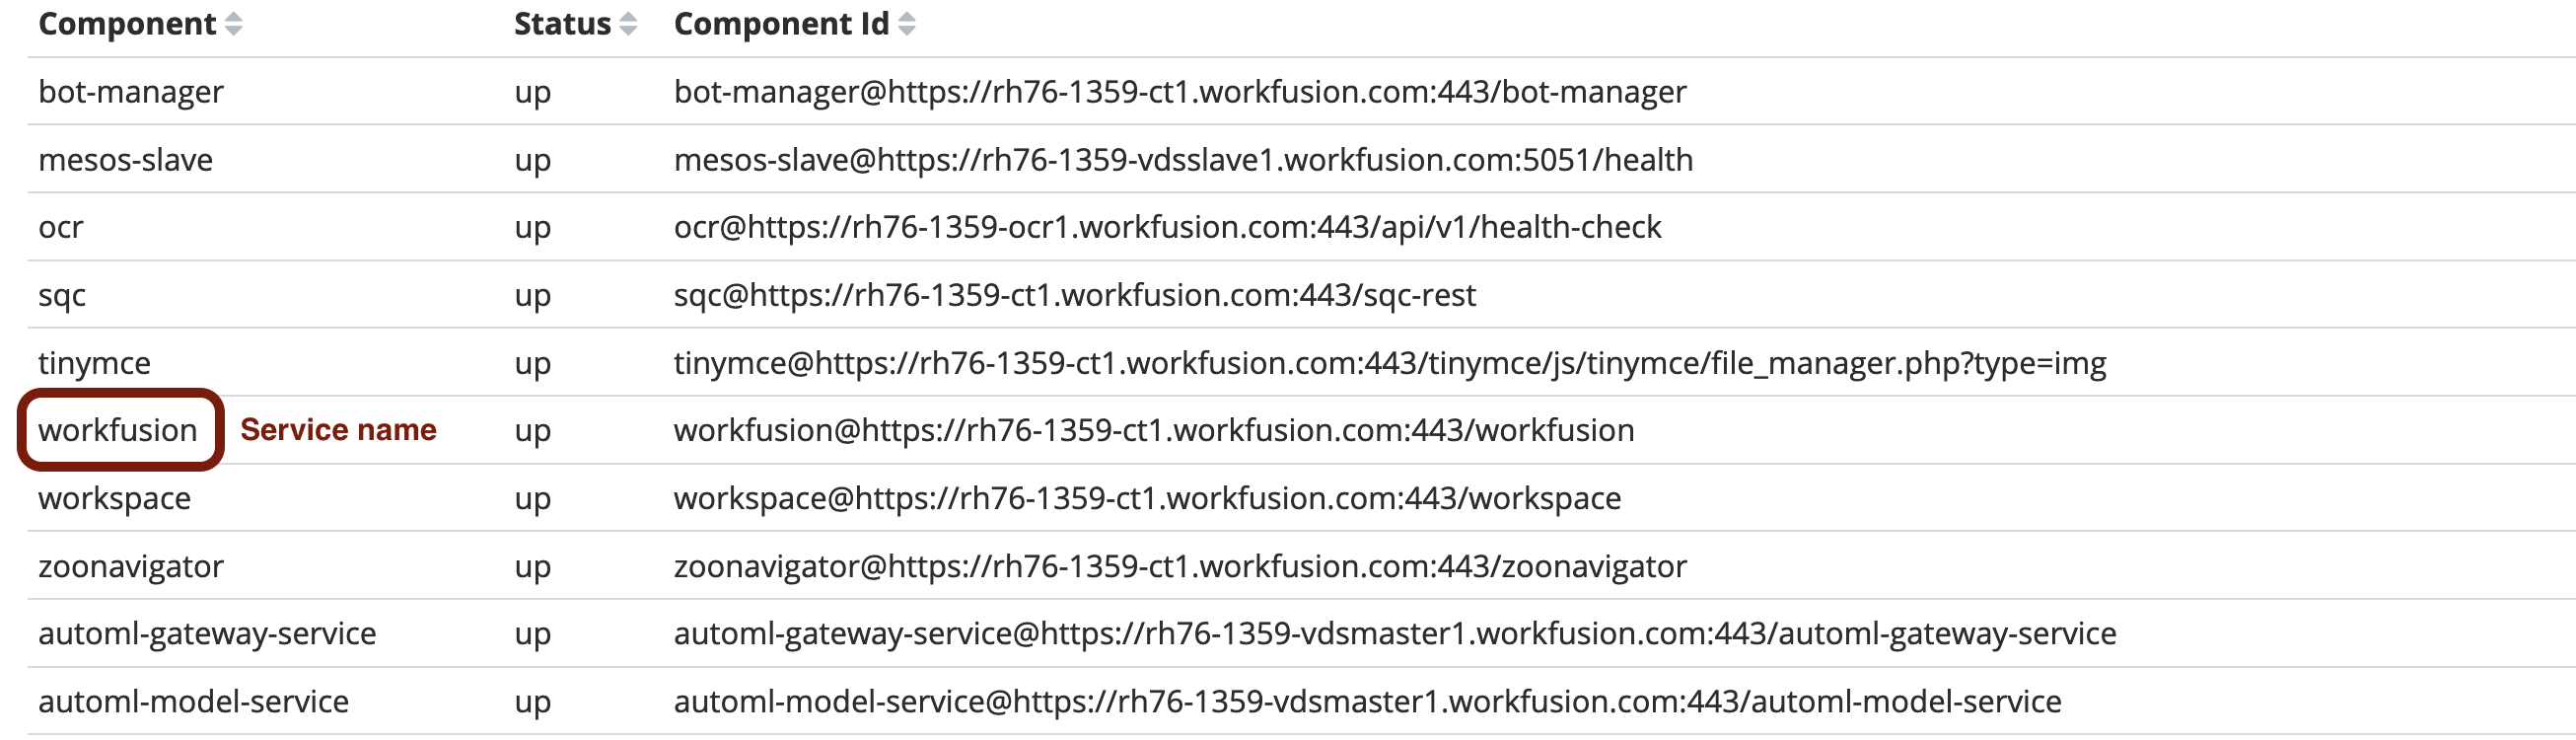
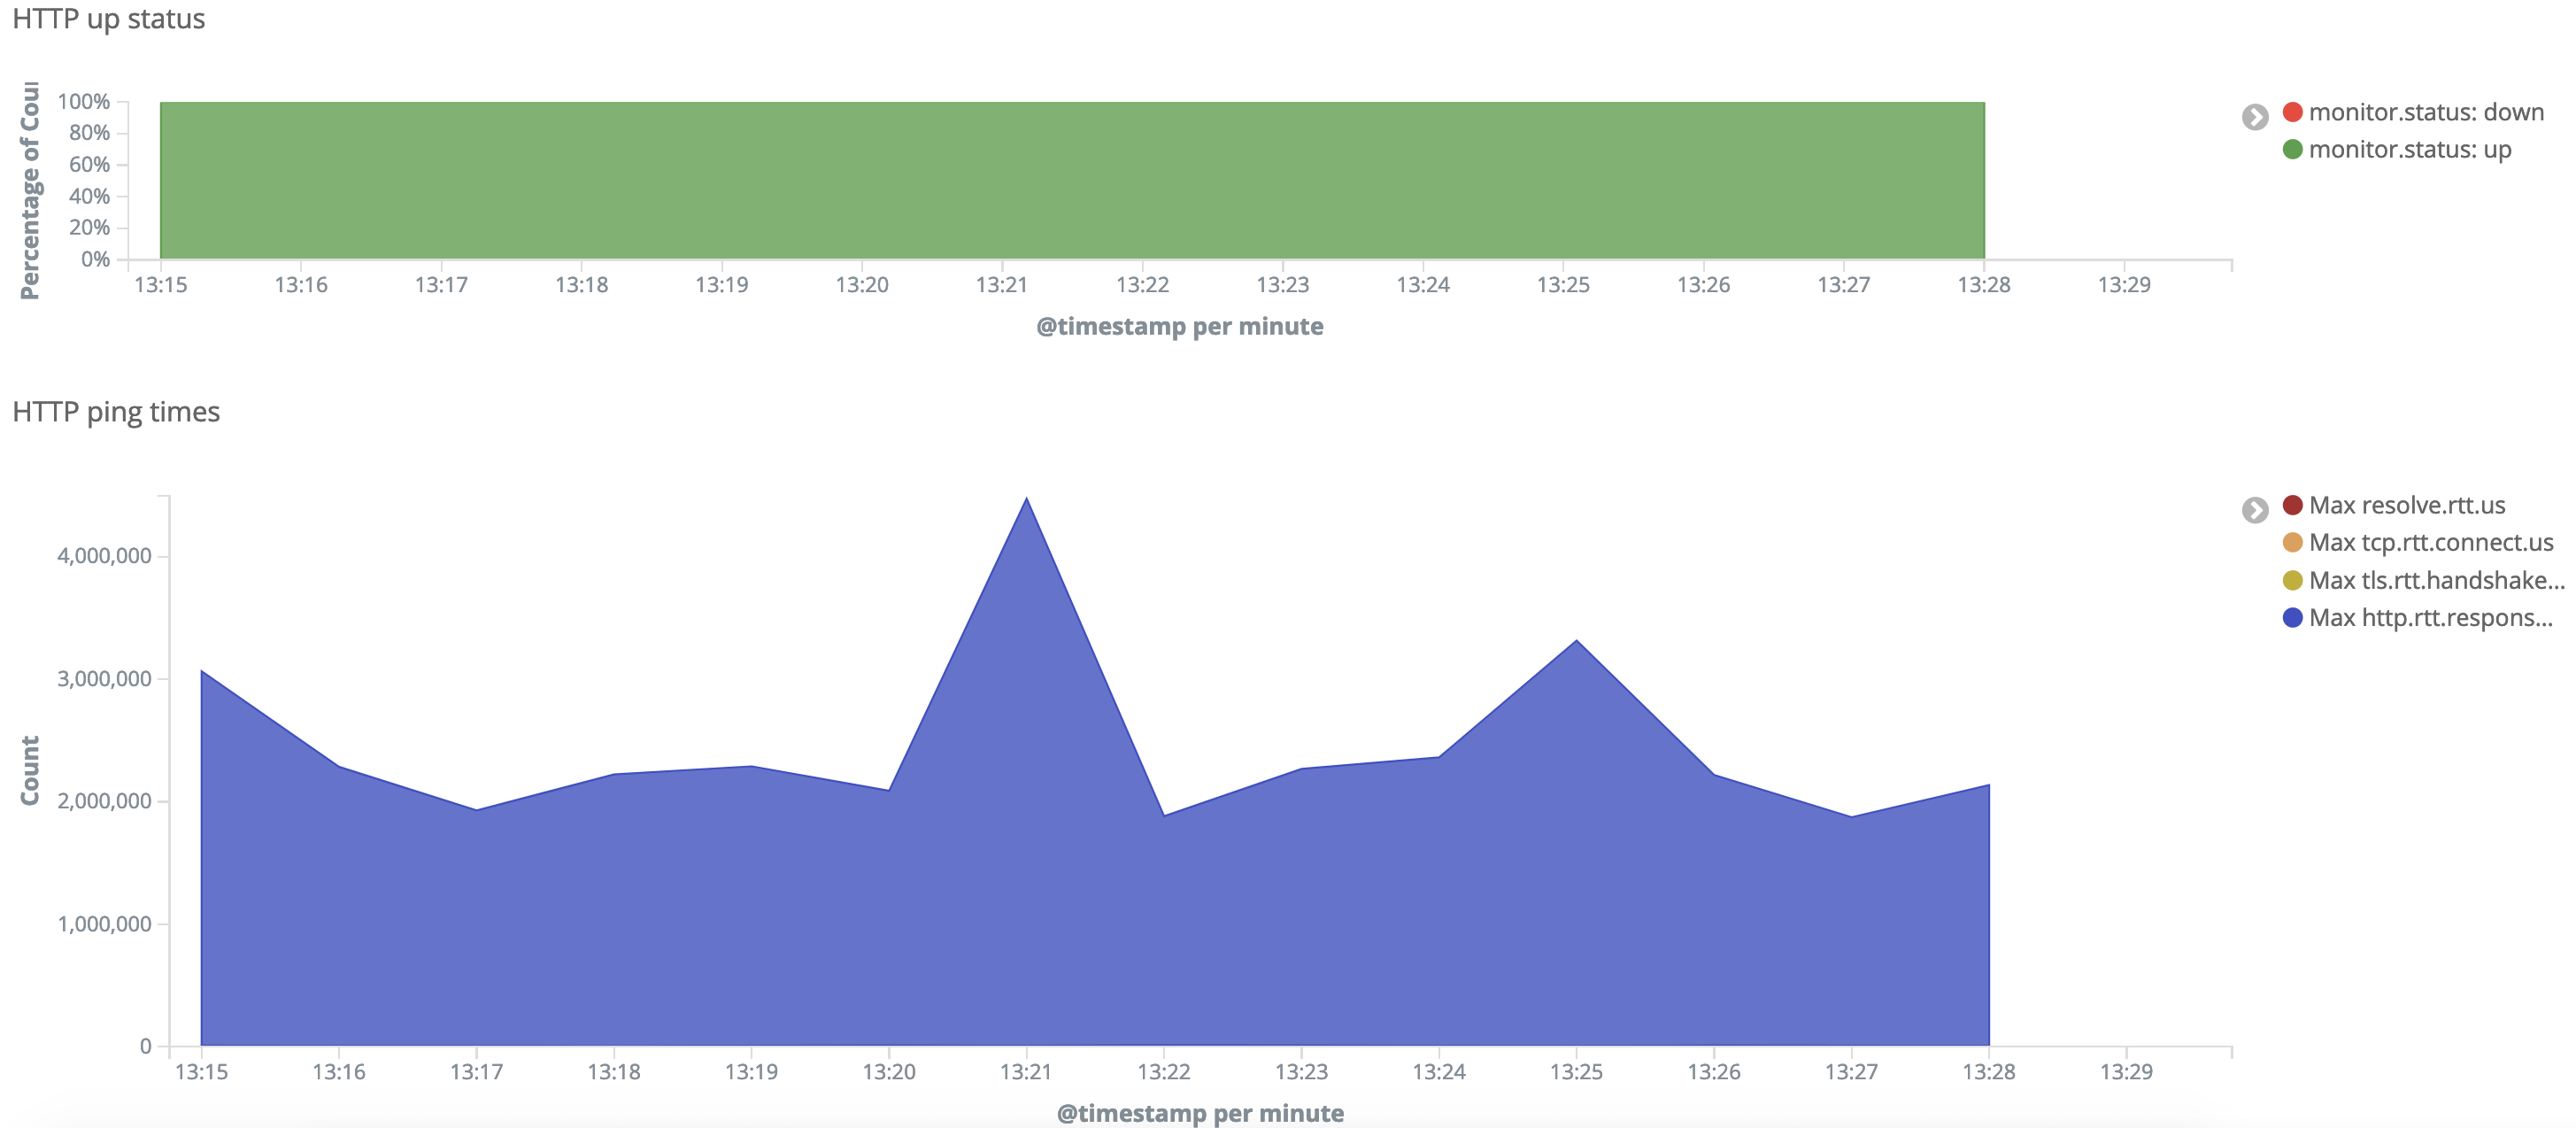
See diagrams Heartbeat Services, HTTP up status, and HTTP ping times for detailed information:
Healthcheck
This compound dashboard provides information on the status of components and components' versions.

The dashboard also includes information on the status of the OCR component, warnings about expiring licenses, and the number of licenses used to process pages.

Host overview
This dashboard contains detailed time-series information of the host:
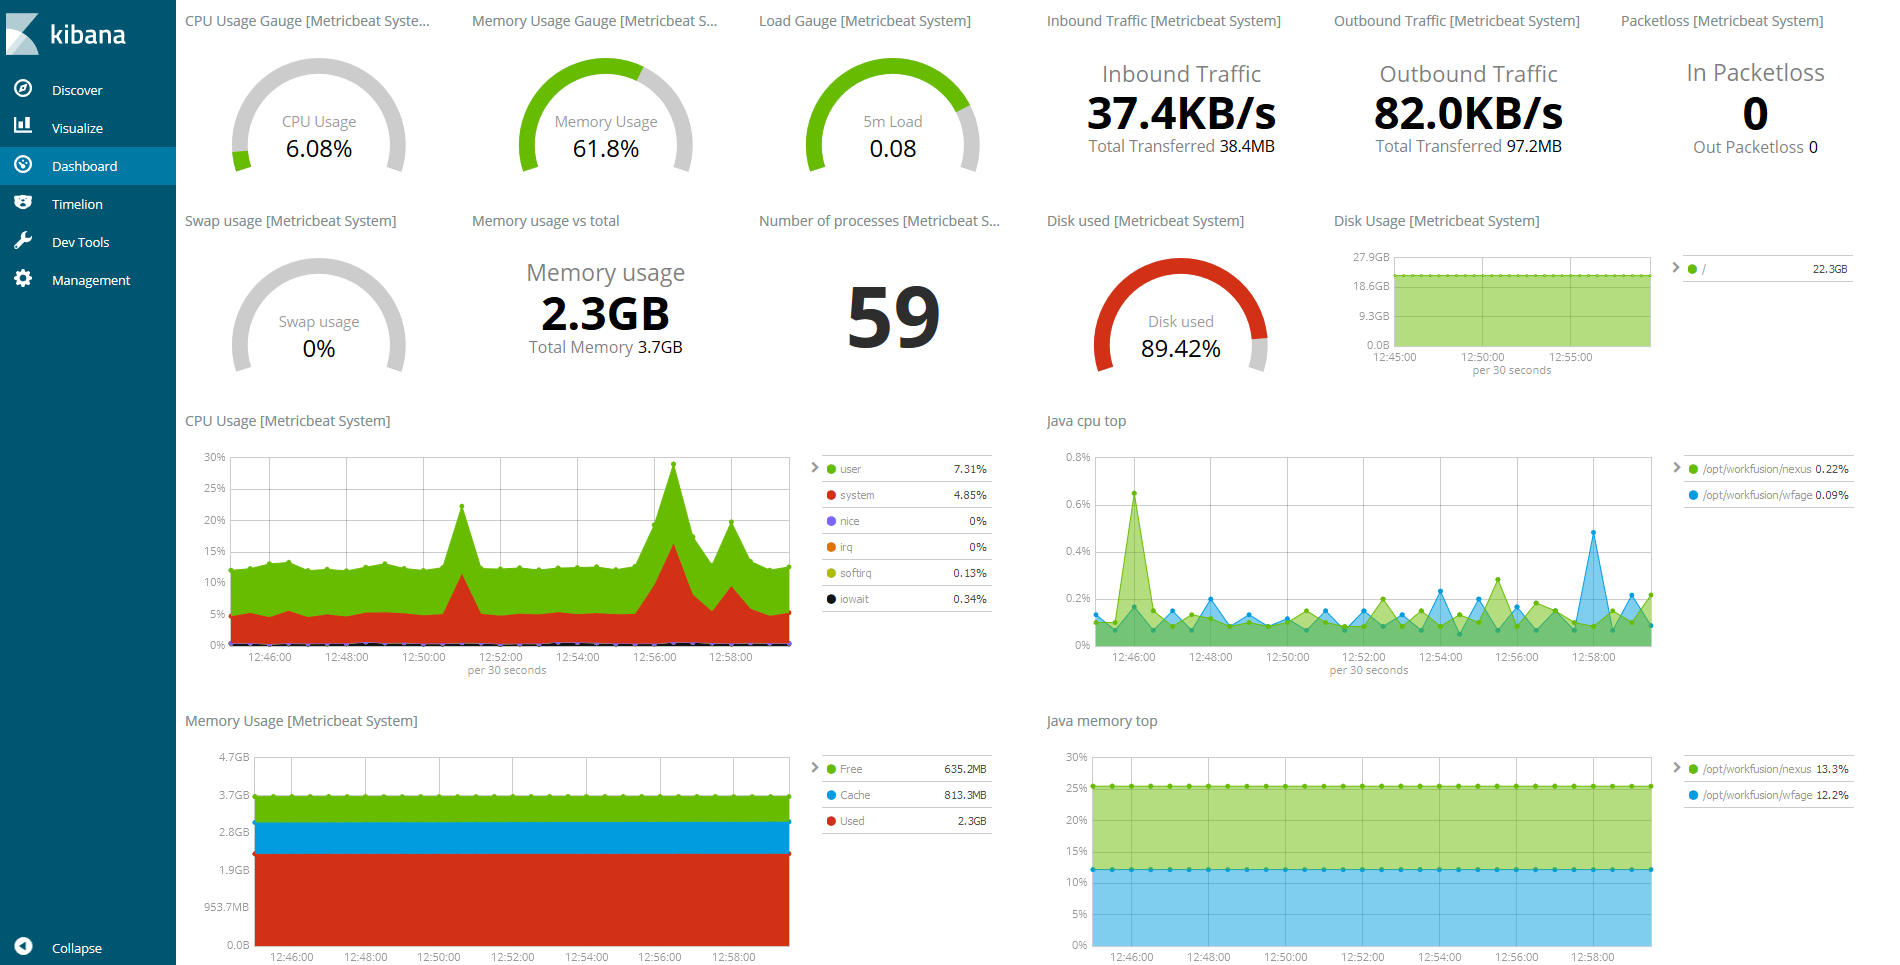
System overview
This dashboard contains a summary of all configured hosts:
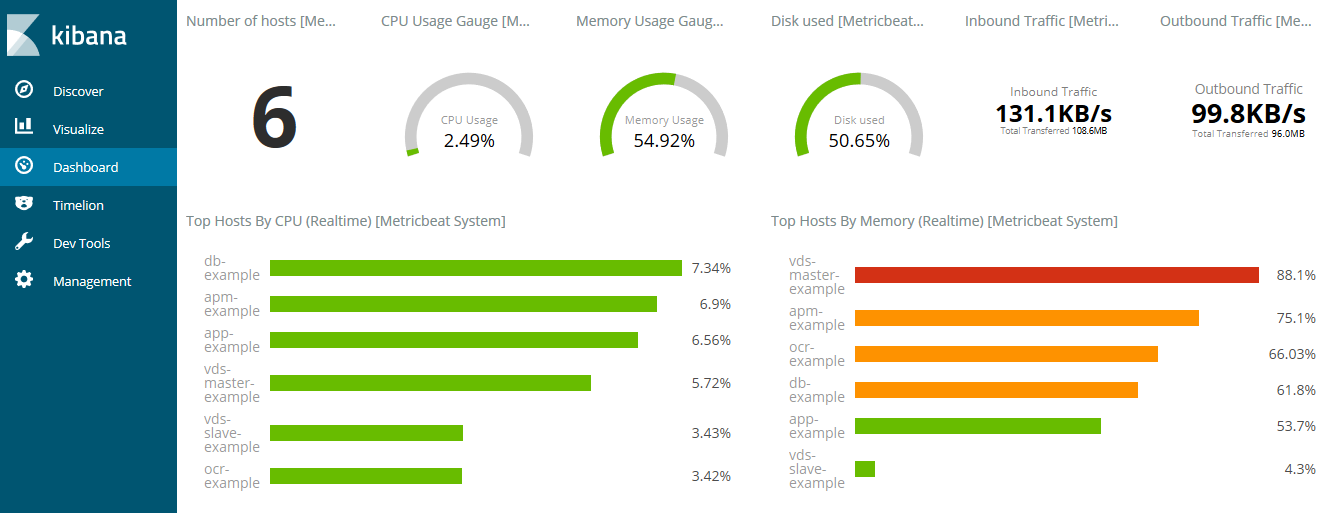
Click a host to open page Host overview dashboard with detailed information on the respective instance.
Create custom dashboards, visualizations, and alerts
If you need to create customized dashboards, visualizations, or alerts based on default ones, do not edit existing objects directly. Instead, make a copy of an existing object and customize it. Otherwise, you may lose all your changes in case of the product upgrade.
Manually generate and download reports
You can manually generate and download PDF, PNG, and CSV files of dashboards, visualizations, Canvas workpads, and saved searches. For that:
Open a dashboard, visualization, Canvas workpad, or saved search.
On the Kibana toolbar, click Share, then select one of the following options: PDF Reports: generates a PDF file of the dashboard, visualization, or Canvas workpad. PNG Reports: generates a PNG file of the dashboard or visualization. CSV Reports: generates a CSV report of the saved search.
Generate the report. When the report completes, a notification appears.
Click Download report.
warning
In some cases you may see a similar error:

To fix it, ensure that the following packages are installed:
- ipa-gothic-fonts
- xorg-x11-fonts-100dpi
- xorg-x11-fonts-75dpi
- xorg-x11-utils
- xorg-x11-fonts-cyrillic
- xorg-x11-fonts-Type1
- xorg-x11-fonts-misc
- fontconfig
- freetype
Change monitored directories
Logs can be of several logging level: INFO > WARNING > DEBUG. Most services emit logs of the INFO type to save space and increase the performance of the ELK stack. Increasing the logging level may consume too much RAM and affect the final cost of the system. Thus we don't recommend tracking additional directories or increase the current logging level of services.
ELK monitors log files of processes in the /logs directories, specific for each service. To edit or add a new directory, change the Ansible roles. If such a need arises, create a Service Desk ticket for changing the directories list.