
Enable RPA unit monitoring in ELK
Problem
By default, ELK (Elasticsearch, Logstash, Kibana) has no checks for the RPA units. The statistics are available only in Bot Manager.
Solution
To add Heartbeat metrics for the RPA units manually, follow the steps below:
Download Heartbeat from the ELK website based on the OS type (x32, x64) and unpack it on the RPA server to
RPA_DIR.Copy
$RPA_DIR\metricbeat\sslto theheartbeatfolder.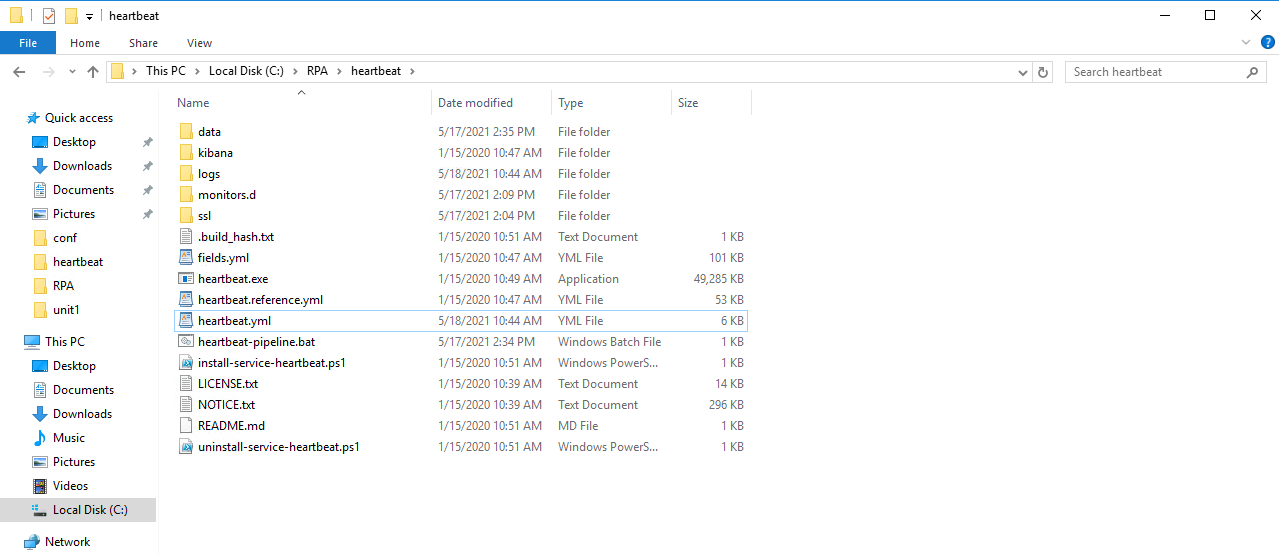
Replace
$RPA_DIR\heartbeat\heartbeat.ymlwithheartbeat.yml. To download the file, click the link.Open ta Bot Agent config file according to the used RPA topology:
- RDP-in-RDP:
$RPA_DIR\bot-agent\conf\bot-agent-master.yml - VDI:
$RPA_DIR\bot-agent\conf\bot-agent-nordp.yml
In the file, add the Heartbeat description to the following lines:
In
Components:- id: rpa.heartbeat name: "Heartbeat processes" group: rpa.server alerts: [ rpa.heartbeat ] # no need in alert definition, just register component with fake alert idIn
Alerts:- id: rpa.heartbeat triggers: - { metric: rpa.heartbeat.status, neq: 0, message: "Heartbeat process check command failed" }In
Processes:- id: rpa.heartbeat expression: "cmd /c start /wait heartbeat-pipeline.bat ${environment.agent.hostname} ${logstash.heartbeat-endpoints}" directory: "../heartbeat" tag: "heartbeat"In
Checks:- id: rpa.heartbeat description: "Find heartbeat process" type: command expression: cmd /c "tasklist | findstr heartbeat" evaluate: - { id: command.exit }
- RDP-in-RDP:
On the RPA server, create
$RPA_DIR/heartbeat/heartbeat-pipeline.batfile with the following content:@echo OFF FOR /f "tokens=1,2 delims= " %%a IN ("%*") DO ( SET HOSTS=%%b ) IF DEFINED PROGRAMFILES(X86) (GOTO 64BIT) ELSE (GOTO 32BIT) :64BIT @echo ON heartbeat.exe -c "heartbeat.yml" -E "name=%1" -E "output.logstash.hosts=[%HOSTS%]" GOTO END :32BIT @echo ON heartbeat.exe -c "heartbeat.yml" -E "name=%1" -E "output.logstash.hosts=[%HOSTS%]" GOTO END :ENDCreate the
$RPA_DIR\heartbeat\monitors.d\unit1.ymlfile for the first RPA Unit.Specify the host and
nameas the actual RPA server's hostname and set the port for URLs toworker_portfromRPA_DIR\bot-agent\conf\units\unit1.yml:- type: http urls: - "http://localhost:15201/health" schedule: '@every 60s' timeout: 30s name: 'rpa_server_hostname.unit1' check.request: method: GET headers: 'User-Agent': 'Mozilla' Host: rpa_server_hostname check.response: status: 200 fields: service_group_name: rpaCreate proper
unitNUMBER.ymlfiles for all units.For the VDI configuration, use
RPA_DIR\bot-agent\conf\units\unit_nordp.ymlto acquire theworker_portvalue.On the APP server, in ZooKeeper, add the
logstash.heartbeat-endpointsparameter:INSTALL_DIR/zookeeper/bin/zkCli.sh create /config/bot-agent/logstash.heartbeat-endpoints APP_DNS_NAME:4571For the HA installation, run the command on the INT server. In
logstash.heartbeat-endpointsparameter, add a comma-separated list of all INT servers in double-quotes.INSTALL_DIR/zookeeper/bin/zkCli.sh create /config/bot-agent/logstash.heartbeat-endpoints "INT1_DNS_NAME:4571","INT2_DNS_NAME:4571","INT3_DNS_NAME:4571"Stop and start the WFSvc service (note that you will be logged off) or restart the RPA server to restart Bot Agent services.
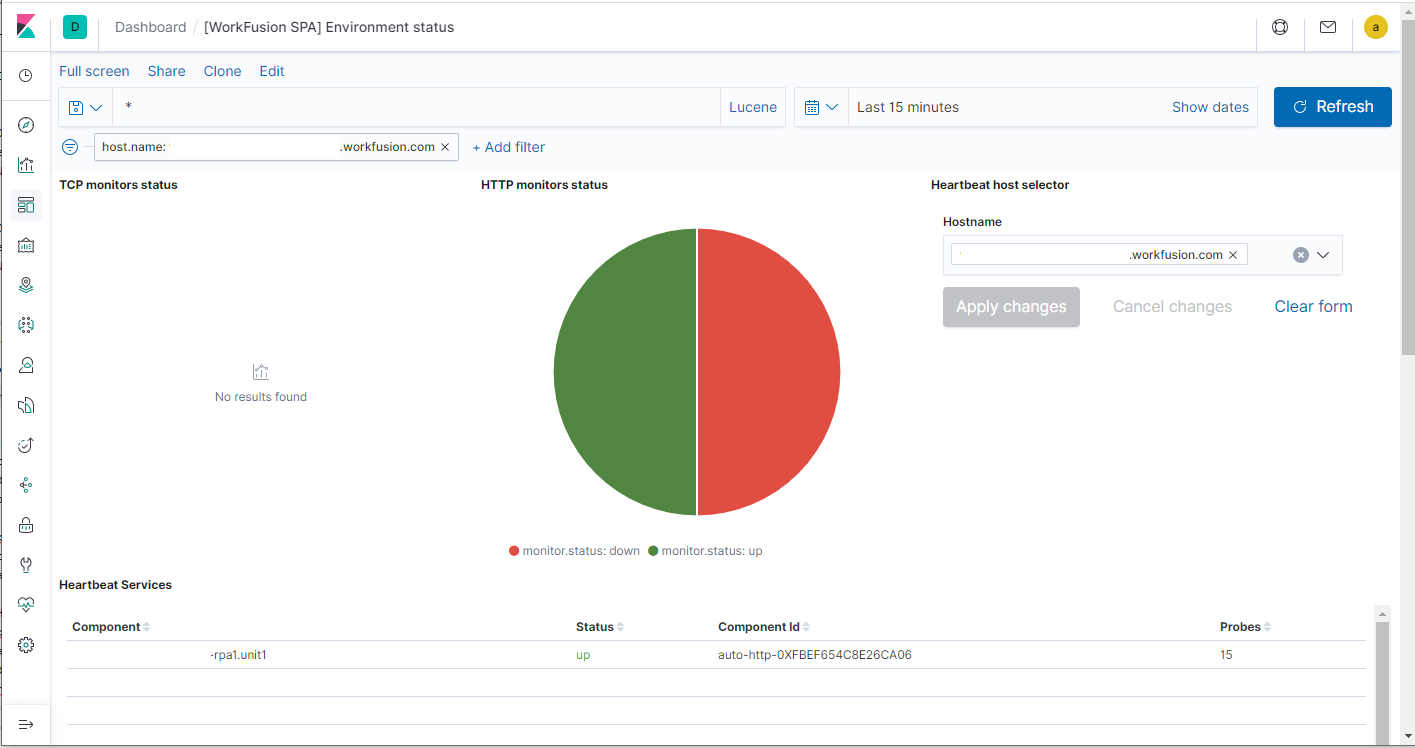
After the restart, the Heartbeat monitoring status is available in Kibana:
Optionally, to set up the email notification, use the example
rpa_watcher.json:See example
{
"trigger": {
    "schedule": {
    "interval": "5m"
    }
},
"input": {
    "search": {
    "request": {
        "search_type": "query_then_fetch",
        "indices": [
        "heartbeat*"
        ],
        "rest_total_hits_as_int": true,
        "body": {
        "size": 25,
        "_source": {
            "includes": [
            "@timestamp",
            "monitor.name",
            "monitor.status",
            "agent.name"
            ]
        },
        "query": {
            "bool": {
            "filter": [
                {
                "range": {
                    "@timestamp": {
                    "gte": "now-1m"
                    }
                }
                },
                {
                "terms": {
                    "monitor.name": [
                    "rpa_server_hostname.unit1",
                    "rpa_server_hostname.unit2",
                    "rpa_server_hostname.unit3",
                    "rpa_server_hostname.unit4",
                    "rpa_server_hostname.unit5"
                    ]
                }
                },
                {
                "term": {
                    "monitor.status": "down"
                }
                }
            ]
            }
        }
        }
    }
    }
},
"condition": {
    "compare": {
    "ctx.payload.hits.total": {
        "gte": 1
    }
    }
},
"actions": {
    "email_action": {
    "throttle_period_in_millis": 900000,
    "email": {
        "profile": "standard",
        "priority": "high",
        "to": [
        "example@workfusion.com"
        ],
        "subject": "Health check error for [{{#ctx.payload.hits.hits}}{{_source.agent.name}} {{/ctx.payload.hits.hits}}]",
        "body": {
        "text": "Some services have been reported down times. \n \n DETAILS: \n {{#ctx.payload.hits.hits}} {{_source.monitor.name}} on host '{{_source.agent.name}}' at '{{_source.@timestamp}}' is down. \n {{/ctx.payload.hits.hits}}"
        }
    }
    }
}
}