
AutoML
See the core of the WorkFusion SPA AutoML models performing, check the rate of the manual work reduction and how people executed the work, find failed documents during AutoML processing. See the production AutoML forecast, analyze the statistics of AutoML Fields processing.
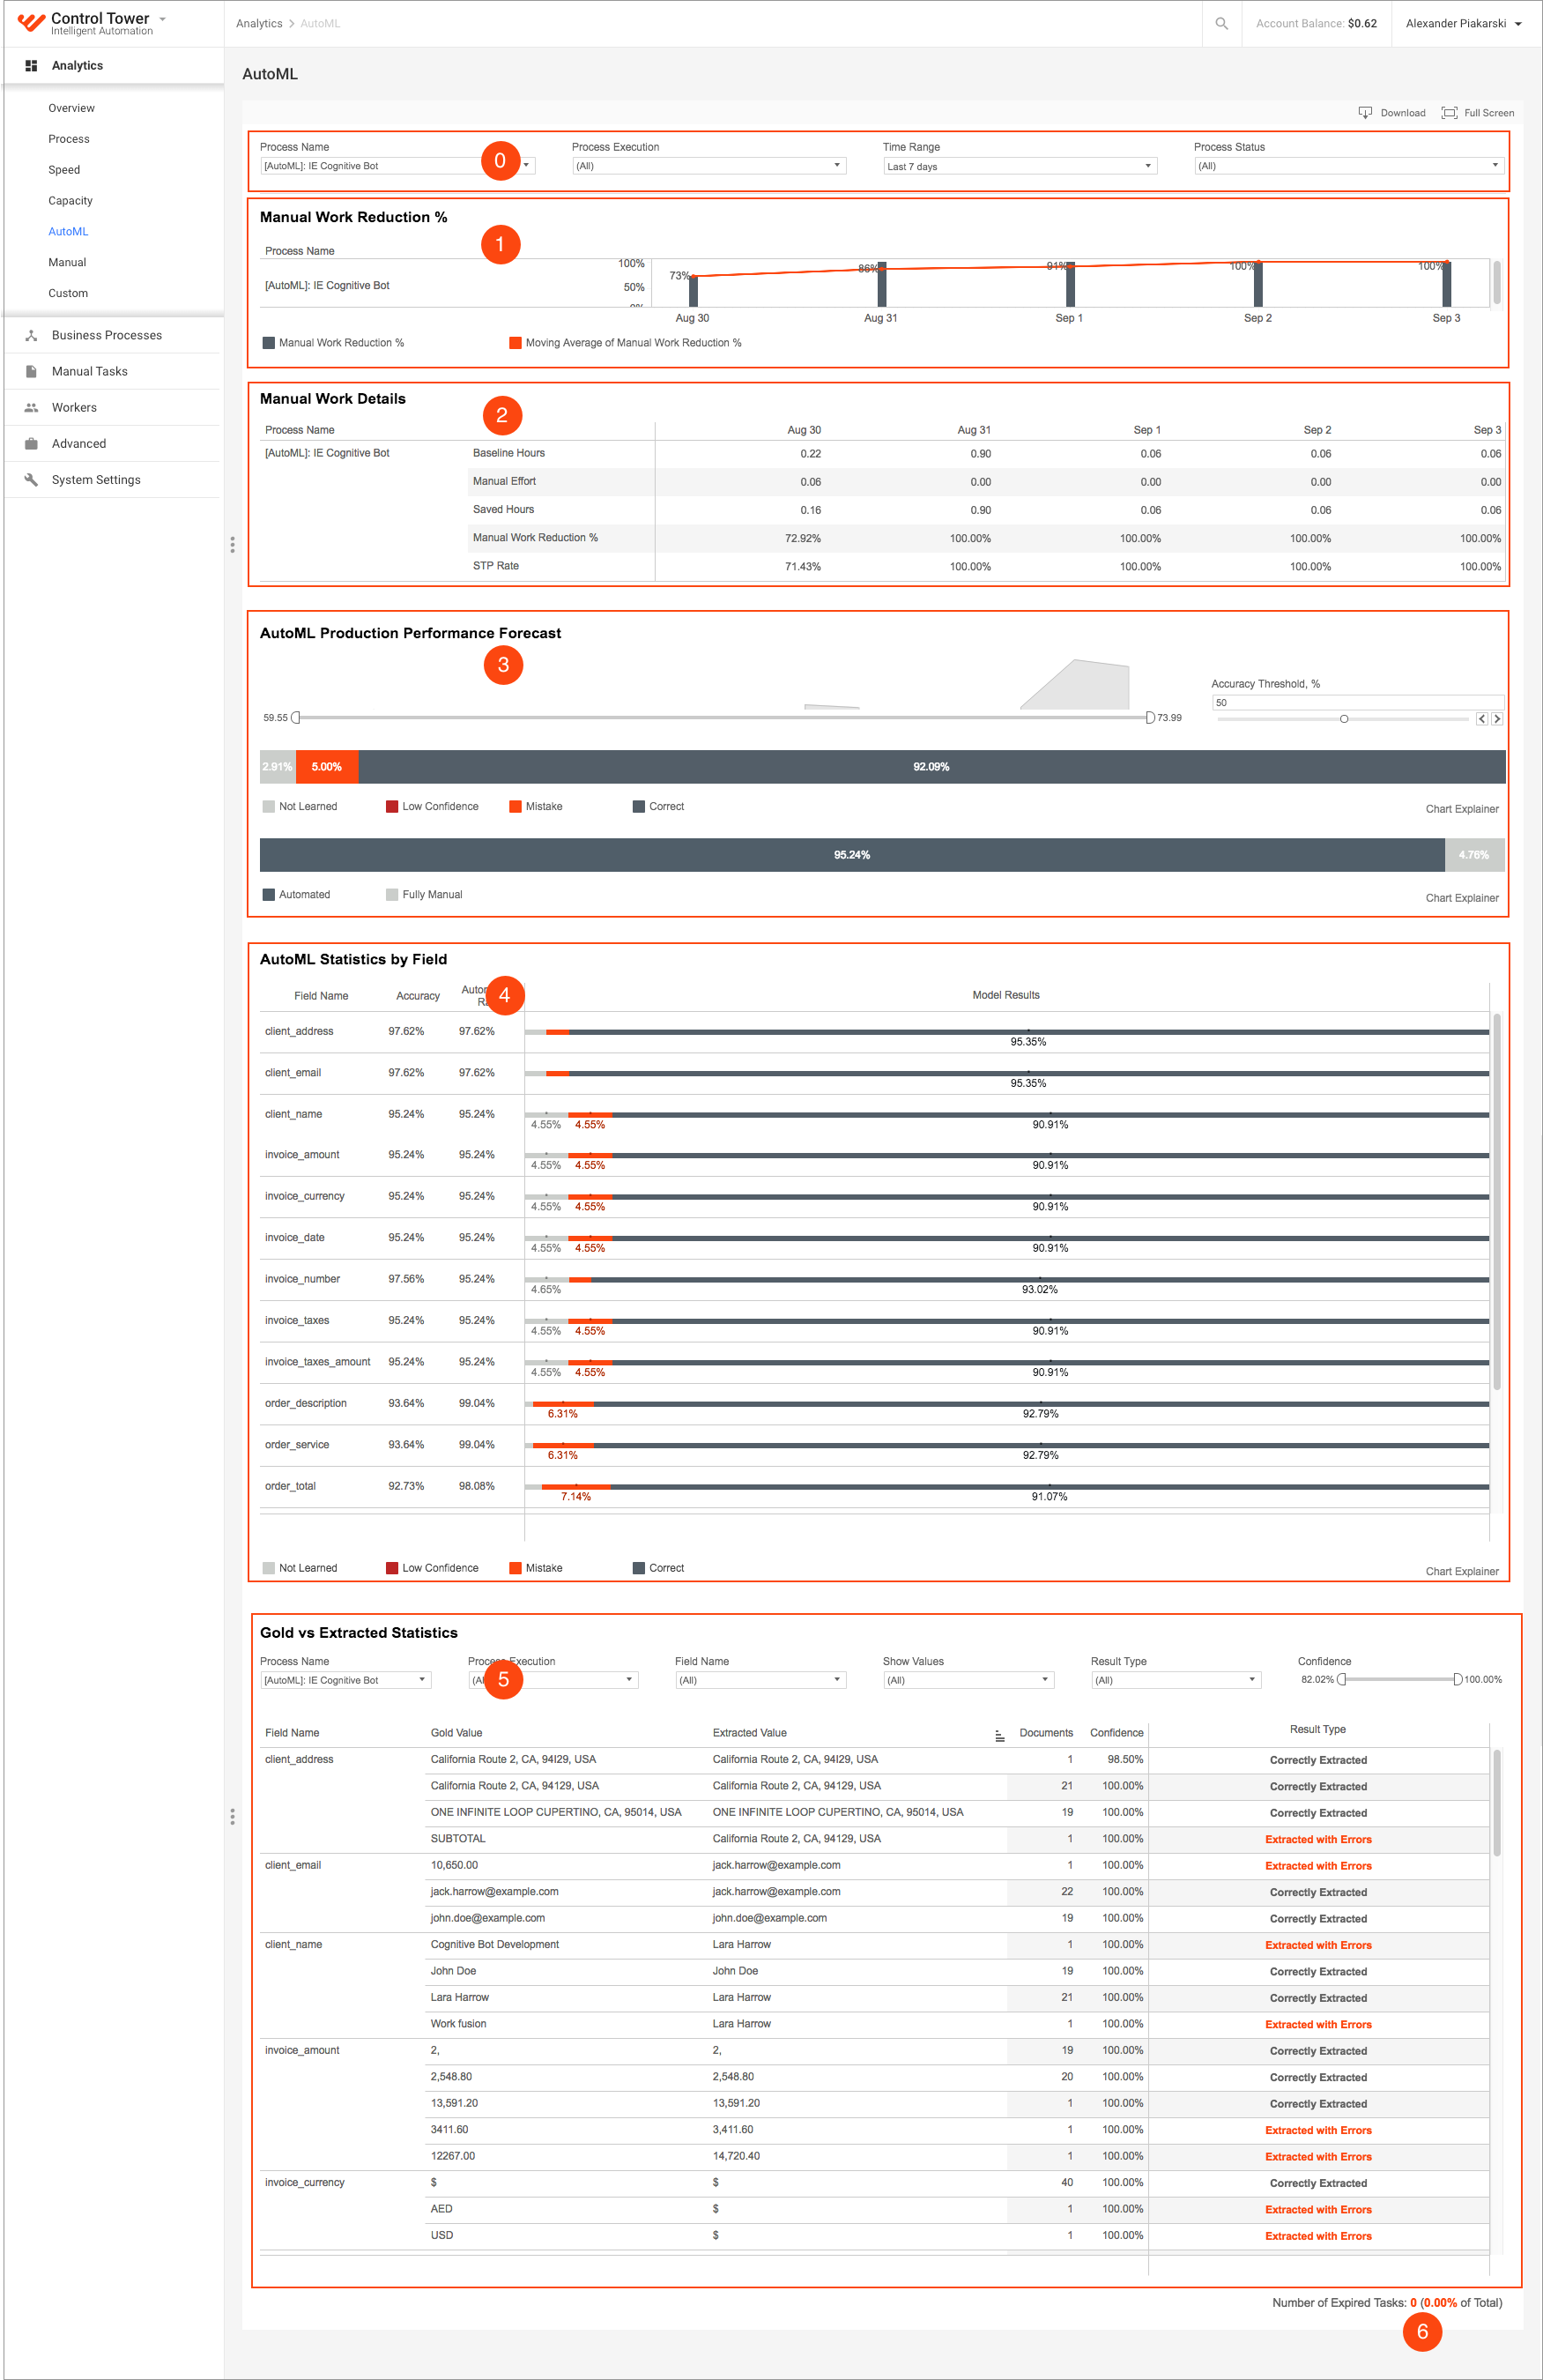
1 - Manual Work Reduction %
2 - Manual Work Details
3 - AutoML Production Performance Forecast
4 - AutoML Statistics by Field
5 - Gold vs Extracted Statistics
6 - Expired Tasks
A tooltip is displayed on mouse hover over an element (point or bar). It contains additional information about a specific element.
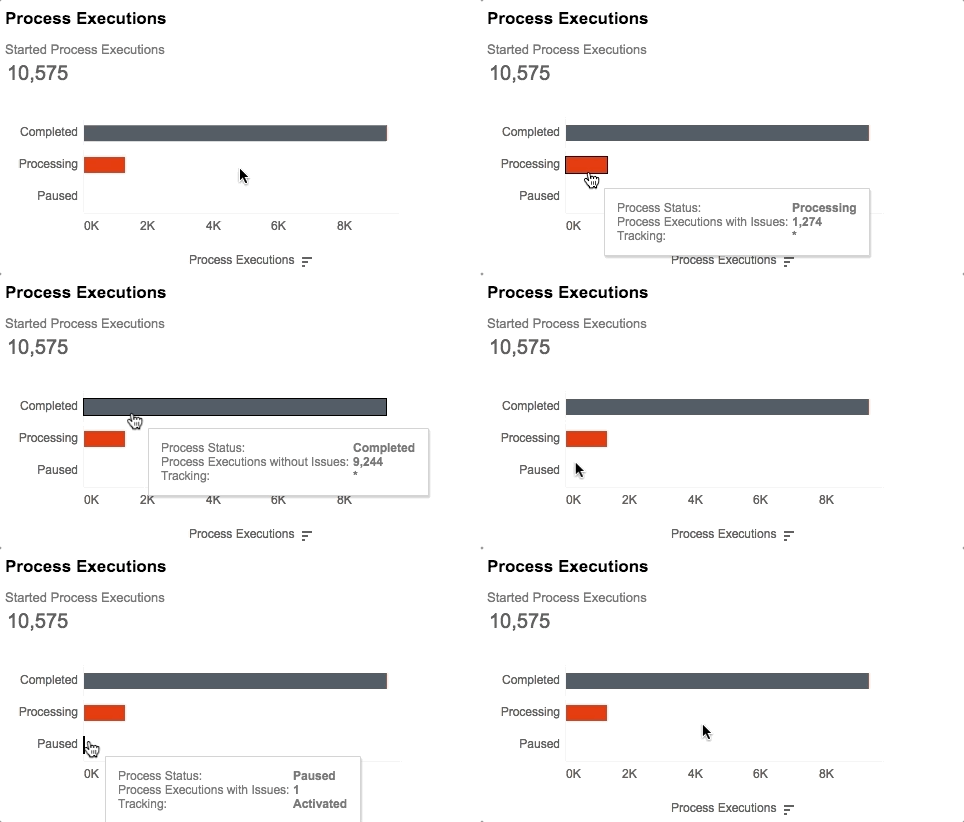
Field Tracking in tooltip - means Transaction Tracking. There are three values:
- Activated: For all Process executions transaction on this day transaction tracking is enabled. Transactions count by documents.
- Not Activated: Transaction tracking NOT enabled for all process executions on this day. Transactions count by input records automatically.
- *: Multiple values. Only in some process executions transaction tracking is enabled.
In the others fields, also If there is more than one possible value, it returns the (*) in tooltip (e.g. SLA values).
Filters
Select the data that will be displayed on the dashboard. Users can interact with filters the following way:
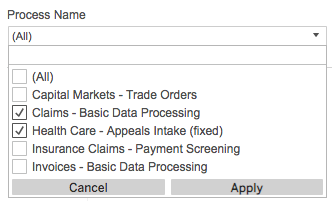
Make a different selection in the checkboxes.
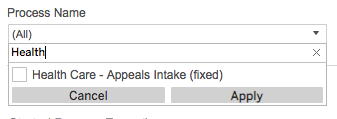
Uncheck the All checkbox and start typing, for example, a process name:
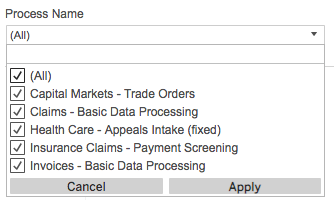
Process name
Filter values by name of process. Default value: check all processes.
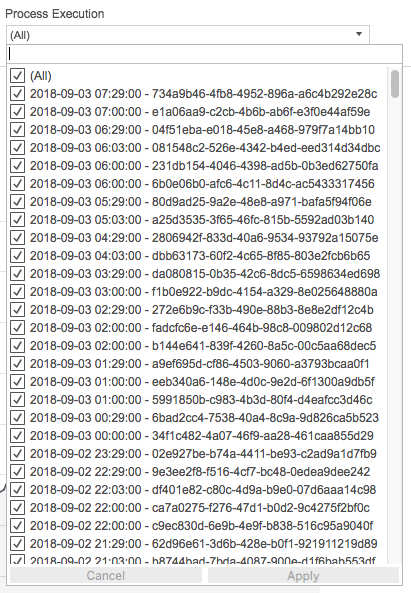
Process execution
Allows to choose specific process execution. The row in a filter is combined by two values:
- Process Execution Start Date.
- UUID of Process Execution.
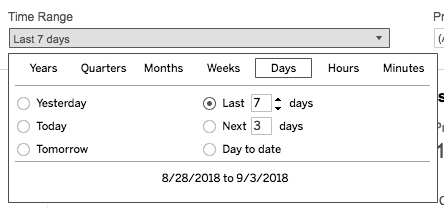
Time range
Users can filter time range (Process Execution Start Date). Default value: 7 last days. Dashboards have data for last 30 days.
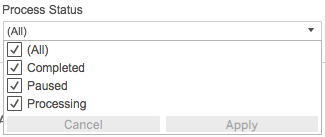
Process Status
There are three types of process status:
- Completed
- Processing
- Paused
Manual Work Reduction %

Visualizes absolute and average values of reduced manual work (Automation Rate) over process on a daily basis.
- X-axis: Date (Process Execution Start Date)
- Y-axis: Manual work reduction (%)
- Tooltip:
- Date: Process Execution Start Date
- Process Name.
- Absolute manual work reduction value (%)
- Average manual work reduction value (%)
Manual work details

Table shows detailed information for each process on a daily basis. It has five metrics:
- Baseline Hours: total expected time to perform a task as if all fields were extracted manually.
- Manual Effort (hours): real spent time to perform a task: how long did it take to extract fields, which a model didn't extract, manually.
- Saved Hours.
- Manual Work Reduction %.
- STP Rate (%): rate of Documents processed by Bots.
Tooltip has the following information:
- Date: Process Execution Start Date
- Process Name
- Value for specific metric in line
AutoML production performance forecast
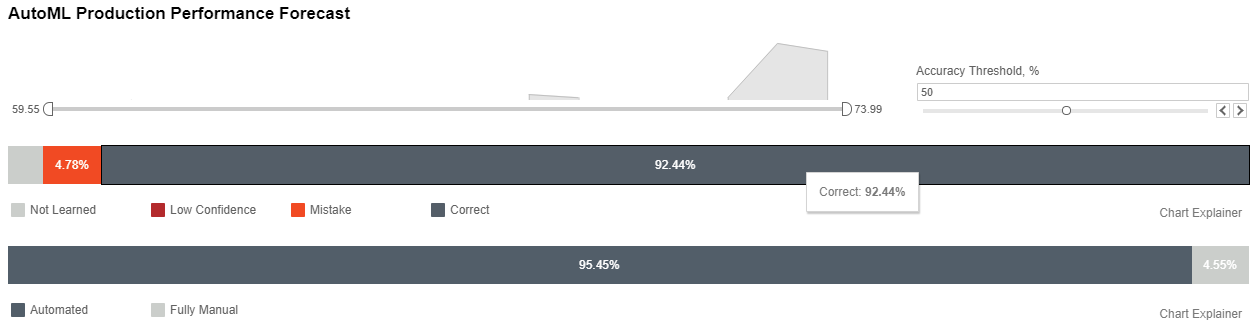
The information about model performance and quality results.
Chart consists of two main areas:
- Quality description metrics
- Overall Automation Rate
Quality description metrics could be filtered using Score filter and the Accuracy Threshold parameter.
Show how AutoML Production Performance Forecast works:
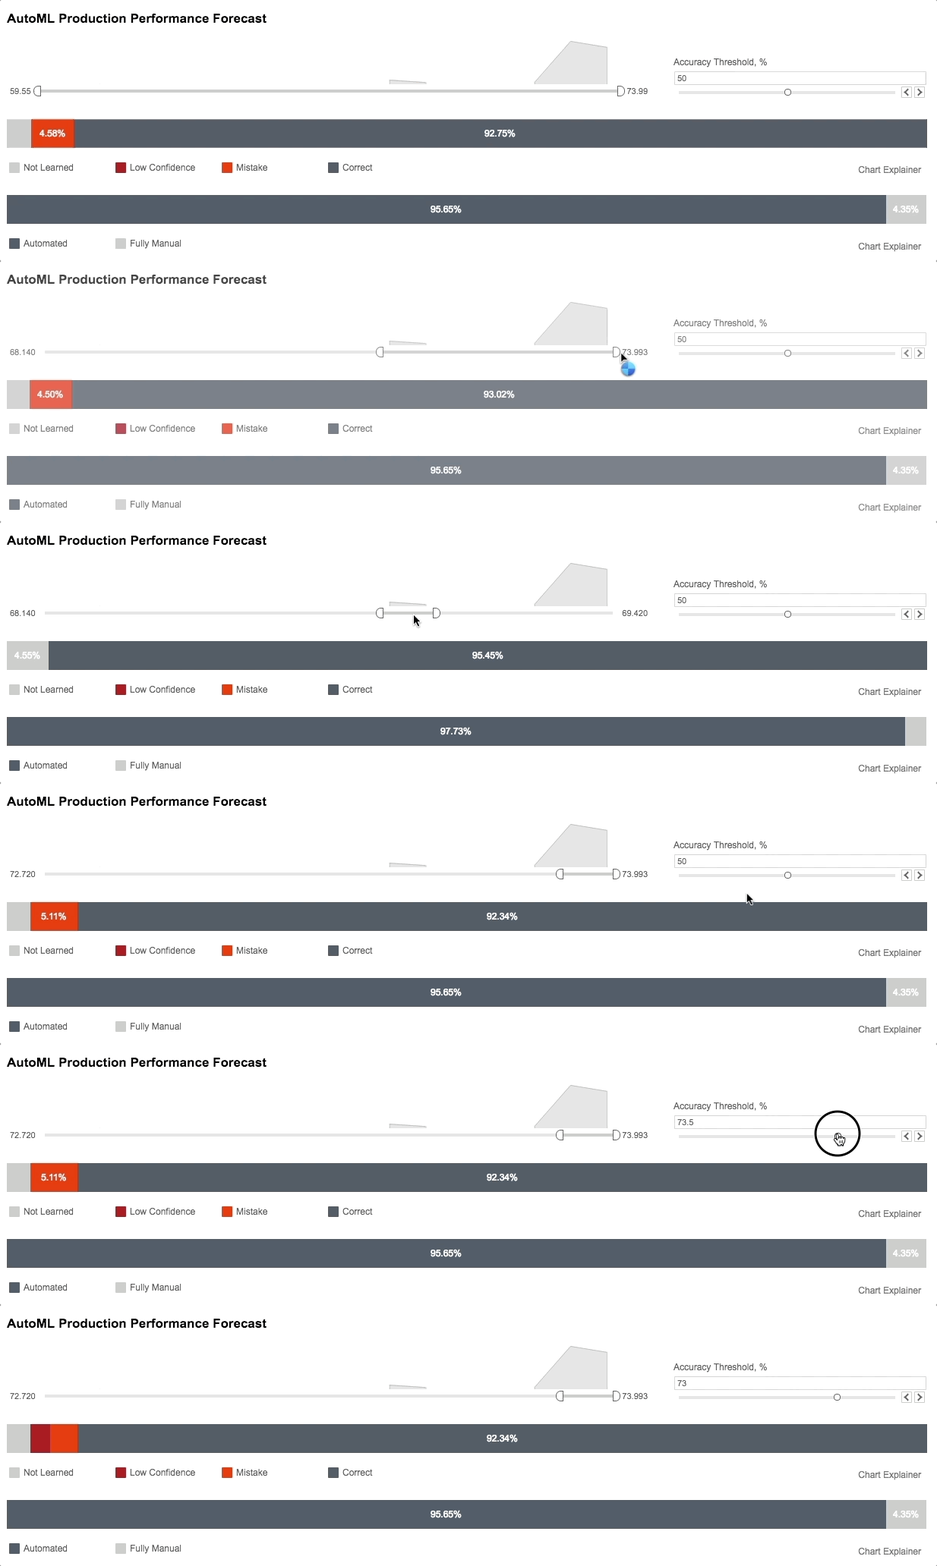
The area above Score filter shows number of fields extracted with corresponding score.
The quality description metrics are as follows:
- Not Learned is a ratio of fields that should be extracted but were not extracted by model.
- Low Confidence is a ratio of fields that should not be extracted but were or weren't extracted with model score lower than selected Accuracy Threshold.
- Mistake is a ratio of fields that should not be extracted but were or weren't extracted with model score equal or greater than selected Accuracy Threshold.
- Correct is a ratio of correctly extracted fields.
Automation Rate chart has two metrics:
- Automated is a ratio of documents that were successfully processed by model or with some human assist.
- Fully Manual is a ratio of documents that were processed by human.
Tooltips has information for a specific metric.
Chart Explainer has metrics description.
AutoML statistics by field
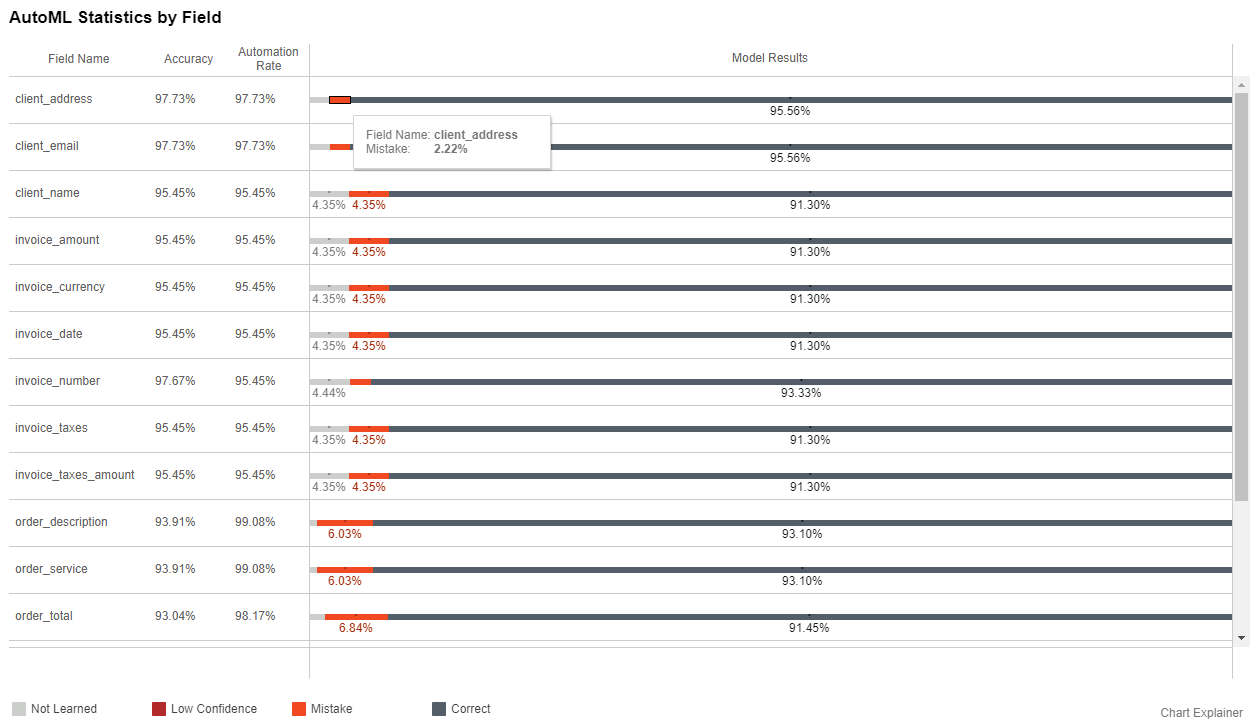
The chart shows model quality results per each field over all documents.
Model metrics are:
- Accuracy is a ratio of correctly extracted fields to the number of extracted fields (Precision), how accurately the model extracts values.
- Automation Rate is a ratio of correctly extracted fields to the total number of fields (Recall), the percent of existing values that can be extracted by the model.
- Not Learned is a ratio of fields that should be extracted but were not extracted by model.
- Low Confidence is a ratio of fields that should not be extracted but were or weren't extracted with model score lower than selected Accuracy Threshold.
- Mistake is a ratio of fields that should not be extracted but were or weren't extracted with model score equal or greater than selected Accuracy Threshold.
- Correct is a ratio of correctly extracted fields.
Tooltips has the following information:
- Field Name
- Value for specific metric
Chart Explainer has metrics description.
Gold vs Extracted Statistics
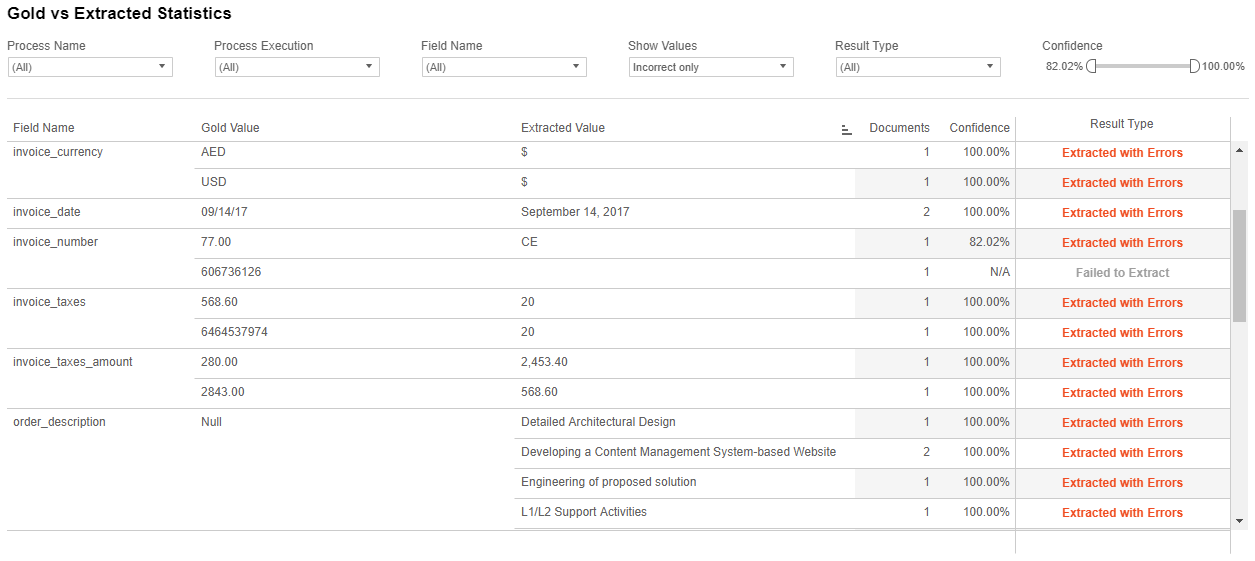
The table shows detailed extraction/classification information per field and has additional filter panel.
The chart has specific filters:
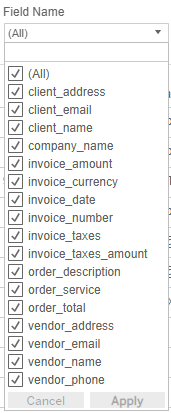
Field name has a list of all fields tagged in documents. Default value: all fields checked.
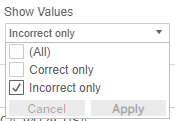
Show Values filter table values by two types: correct and incorrect, depending on model results.
Result Type is a division of model results. Default value: all types checked.
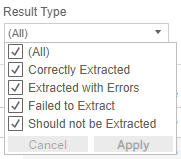
- Correctly Extracted: the value should be extracted and was extracted correctly.
- Extracted with Errors: the value should not be extracted, but was extracted or should be extracted, but was extracted with errors.
- Failed to Extract: the value should be extracted, but was not extracted by the model.
- Should not be Extracted: the value should not be extracted and was not extracted.
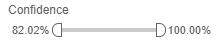
Confidence: the margin describes how confident the model is in classifying the object as belonging to this class.
The table contains detailed information about field extraction or classification:
- Field Name
- Gold Value
- Extracted Value
- Documents: number of documents where a pair of Gold or Extracted values occurs
- Confidence
- Result Type
Expired tasks

Displays number of expired tasks and percent from total number of tasks.
Expired Tasks are not included in charts calculations above.