Reporting API
Reporting API enables the following:
- Building custom dashboards
- Using a BI tool against the data warehouse provided by WorkFusion
- Integrating data seamlessly into your data warehouse from WorkFusion's one
The following schema represents all data available for analysis via Reporting API. These include the operational metrics of Control Tower, Workspace, AutoML, RPA, Bot Execution, and Infrastructure. You can leverage the automation metrics without any additional calculation efforts.
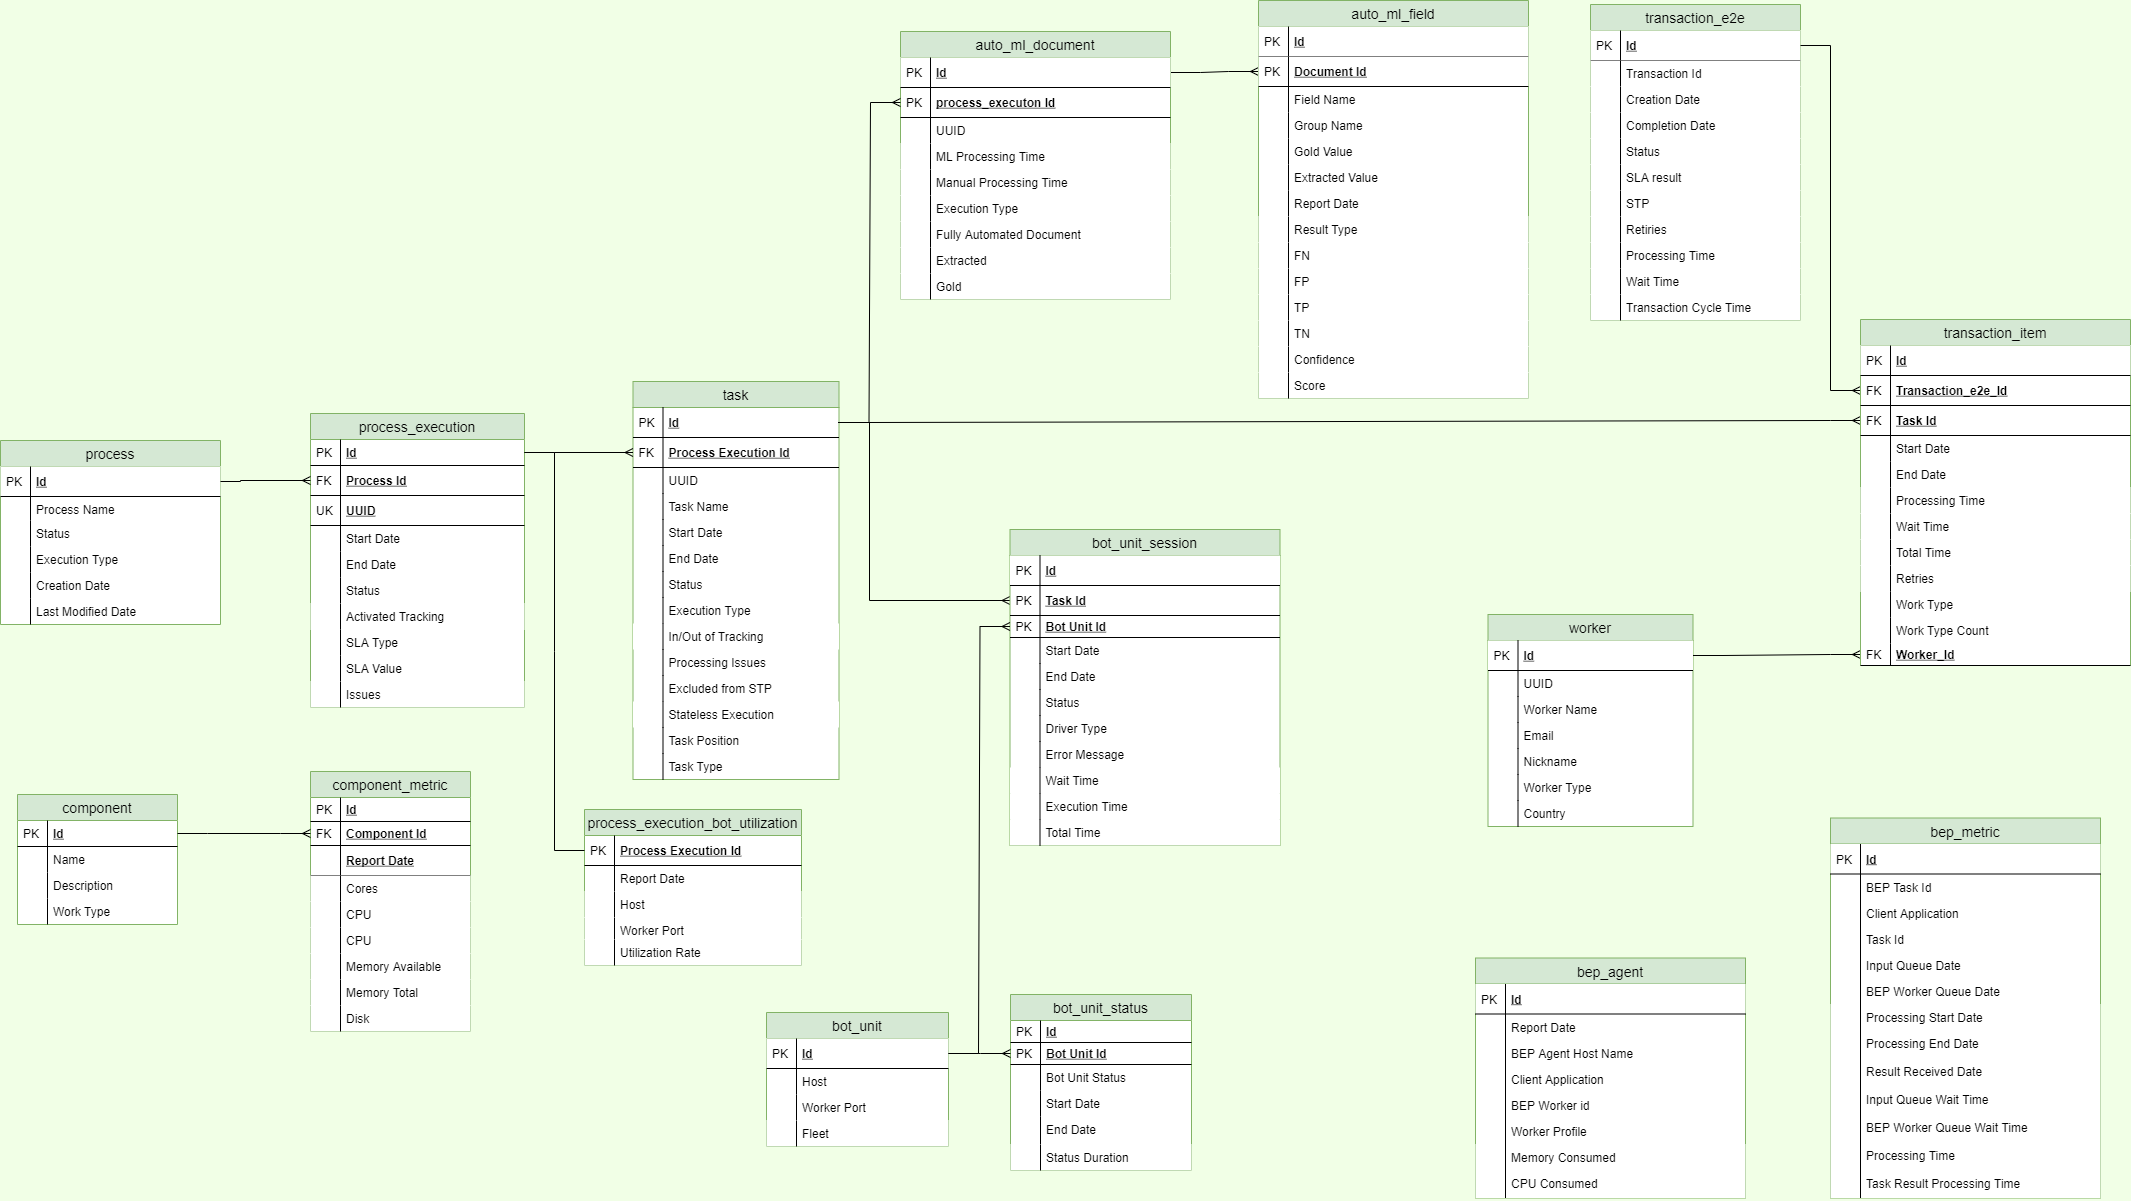
For a comprehensive overview of the WorkFusion Analytics capabilities, we recommend taking the Analytics for Business Users in Automation Academy.
Connect to Reporting API
To start using Reporting API, connect it to WorkFusion Analytics Desktop. Mind the following prerequisites:
- The connection to Analytics Desktop requires a license. For details, refer to the Analytics | Licensing topic.
- The connection employs the Microsoft SQL Server database. The default port is
1433. If you use a non-default one, specify it in the following format:<server name>,<port number>. - Default database name:
workfusion. - Default schema name:
dm. - Default username for SQL credentials:
rapi.
To connect Reporting API to Analytics Desktop, follow the instructions below:
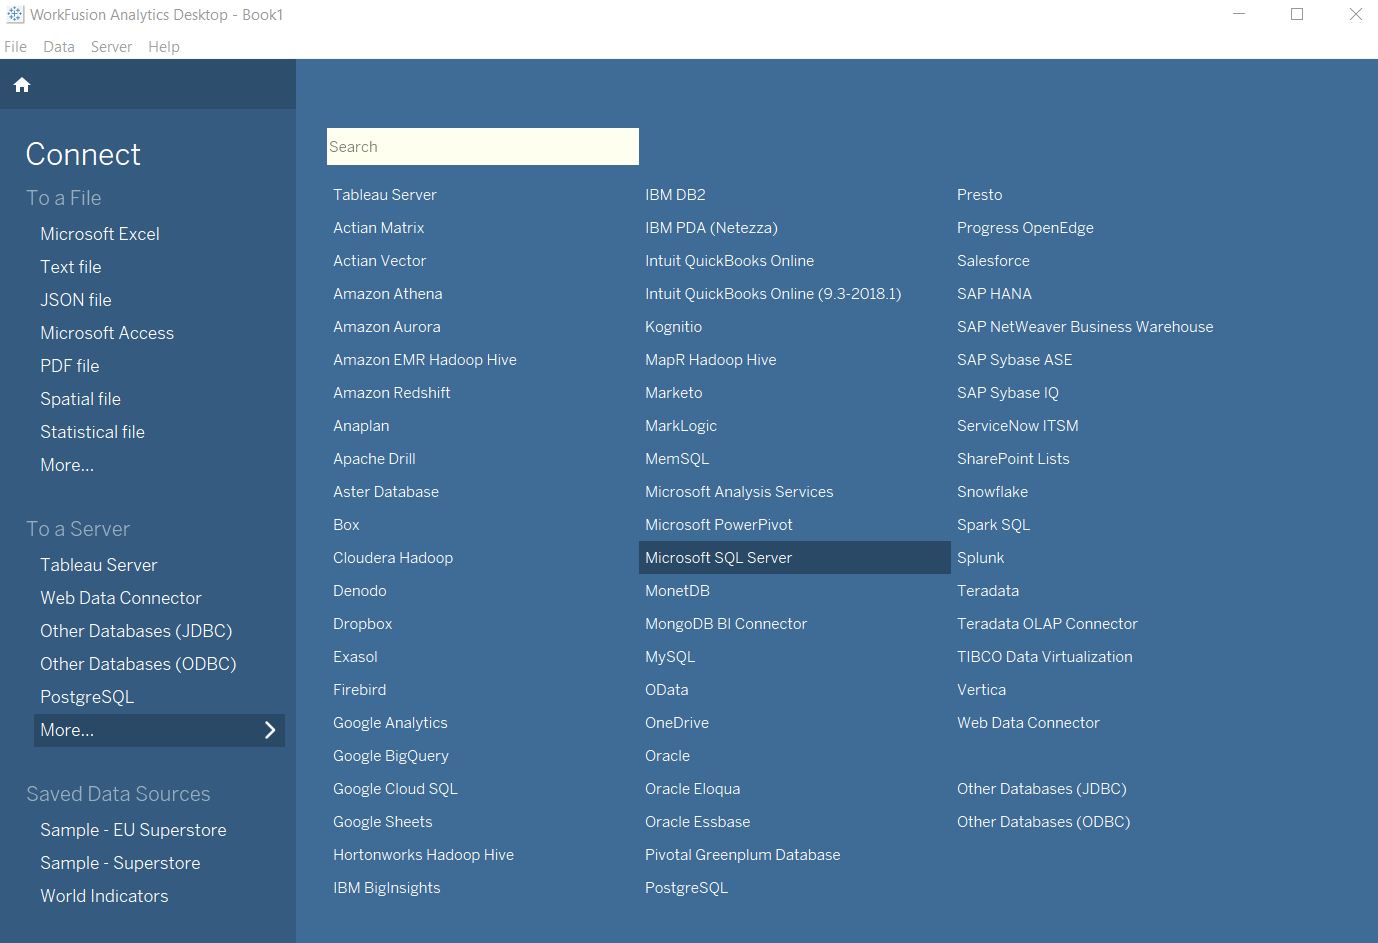
Start WorkFusion Analytics Desktop. In the Connect section, click More..., and select Microsoft SQL Server.
In the Server field, specify the Analytics server you want to connect to.
In the Database field, enter the default database name.
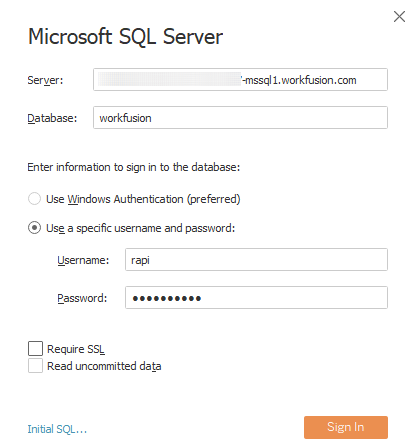
Enter your Username and Password. Select Require SSL if needed.
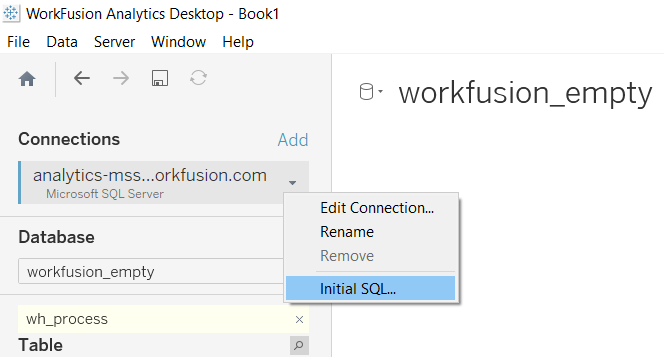
(Optional) Select Initial SQL to specify an SQL command to run at the beginning of every connection. For example, this can be a command to refresh an extract upon opening a workbook, sign in to WorkFusion Analytics Server, or publish to WorkFusion Analytics Server.
Click Sign In.
Select dataset
After signing in, you are on the Data Source page. Perform the following steps:
Select one or more Tables to match the goals of your analysis, relying on the Reporting API reference. Use the search box to browse for specific names, if needed.
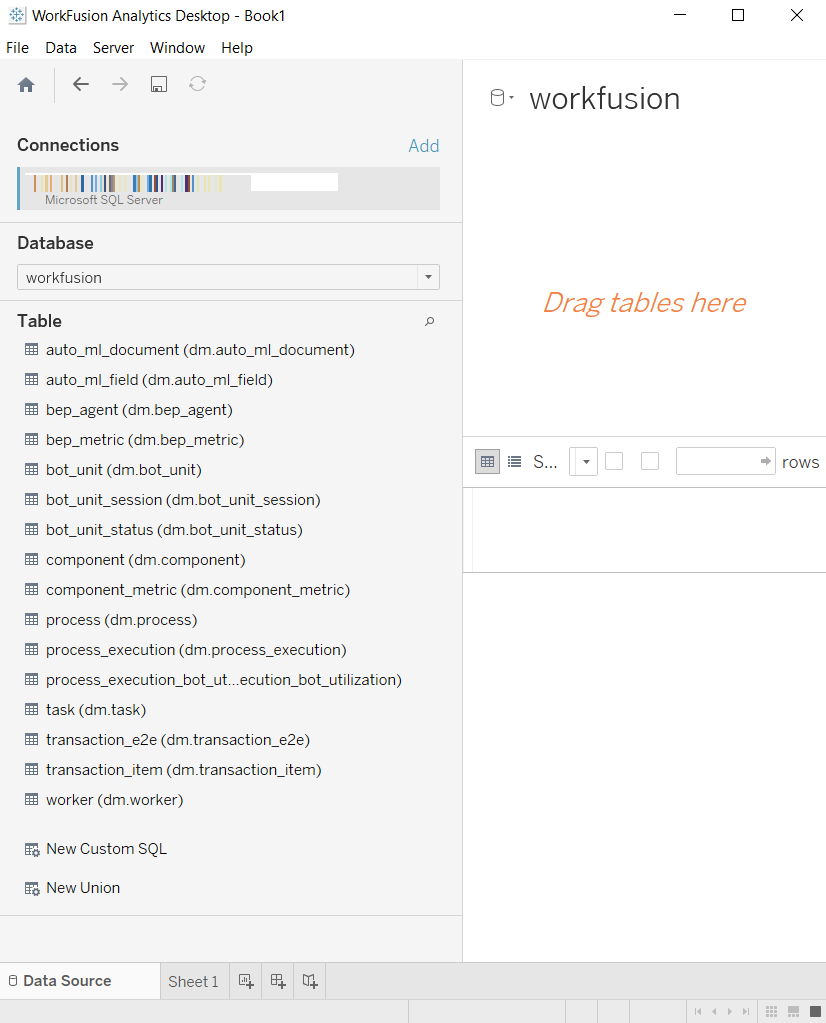
Drag the selected Table to the canvas on the right.
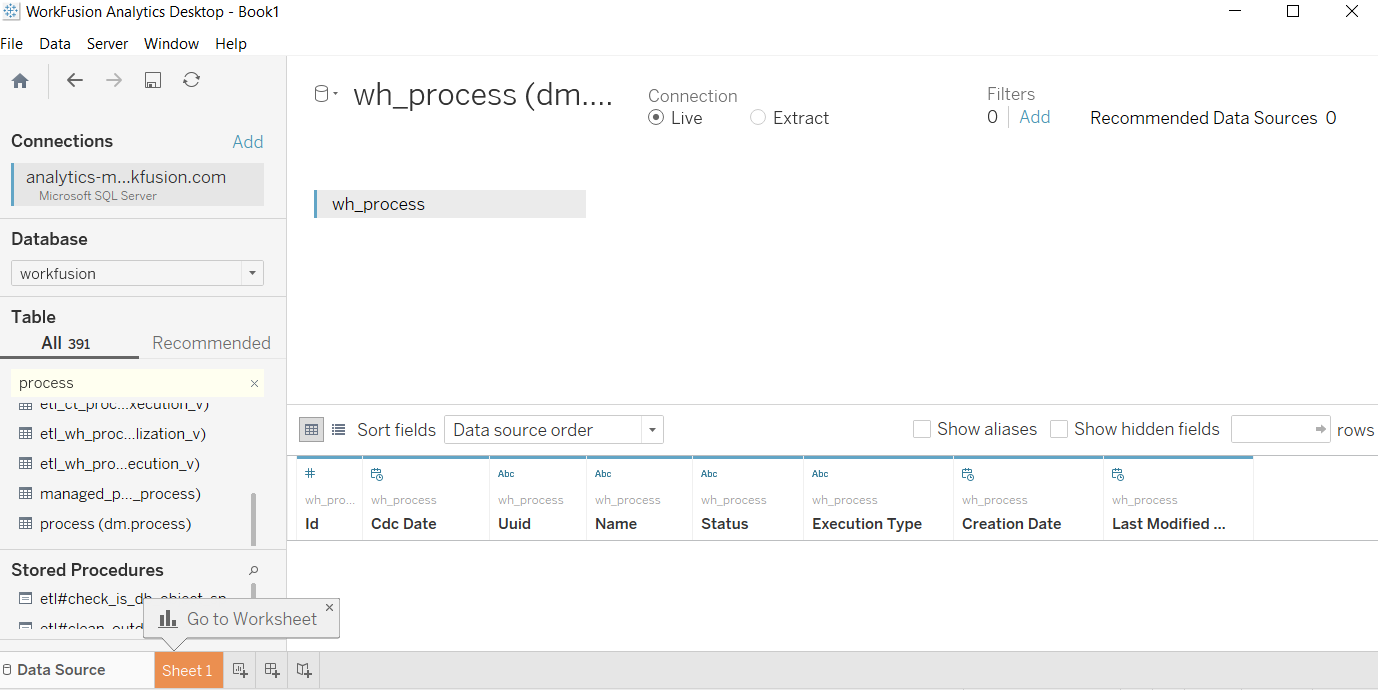
Alternatively, set up custom SQL queries. For details, refer to the Tableau official documentation.
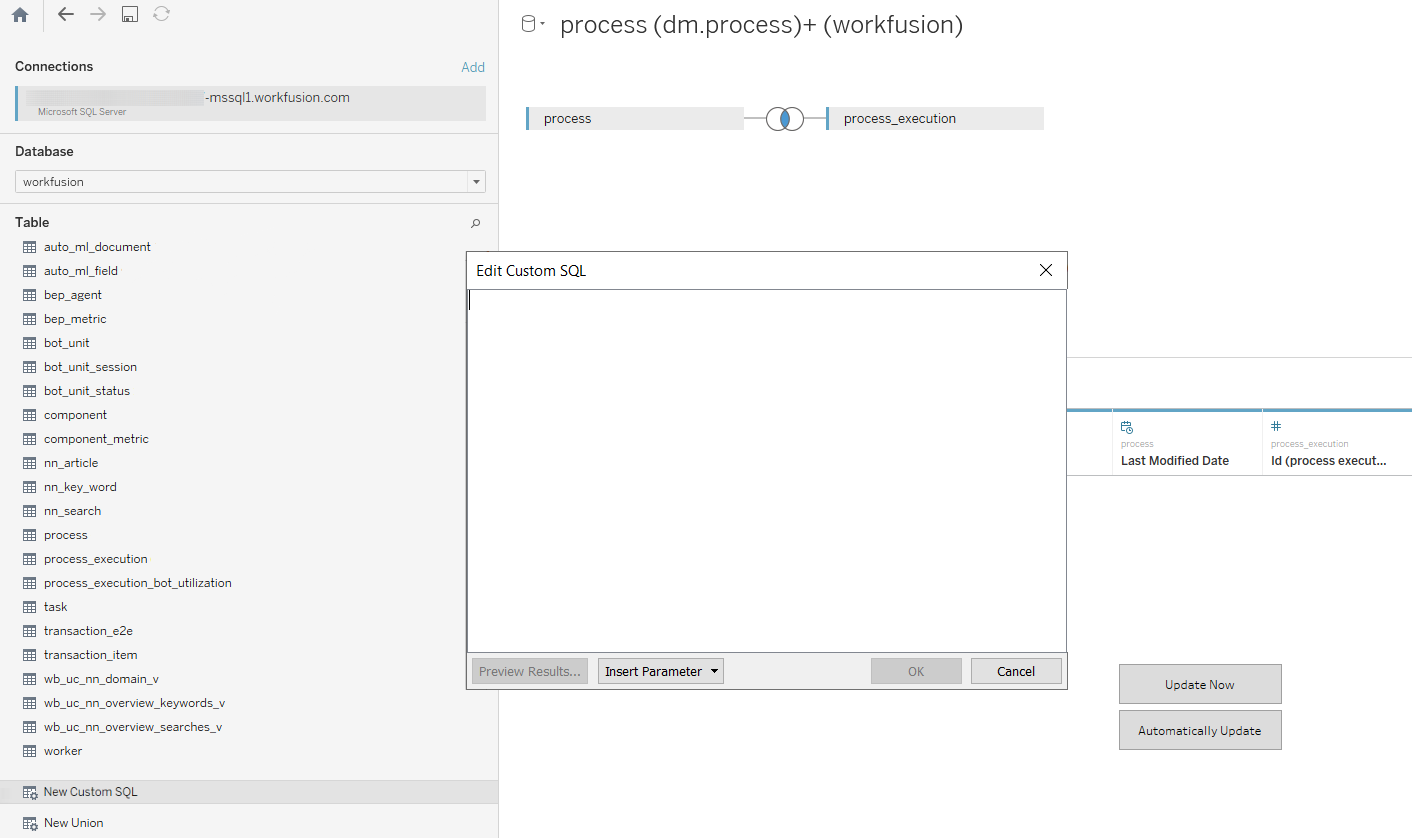
Click the Sheet tab to proceed with building a report.
On the Data Source page, you can also accomplish the following:
Change or add an initial SQL.
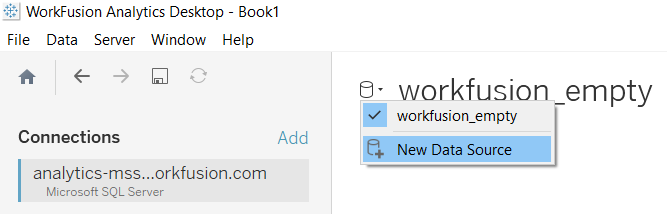
Connect an additional Data Source.
Explore Reporting API reference
- AutoML
- Bot Execution Platform
- RPA
- Infrastructure
- Control Tower
- Manual
| Table | Order | Field | Description | Value |
|---|---|---|---|---|
| auto_ml_document | 1 | Id | Primary key for the table. | Auto-generated integer number |
| auto_ml_document | 2 | Process Execution Id | Foreign key to the process execution table. | |
| auto_ml_document | 3 | Execution type | Shows the document processing details:
| |
| auto_ml_document | 4 | Is Automated | Shows whether it was only model that extracted all fields in the document. | 0=no, 1=yes |
| auto_ml_document | 5 | Gold | Contains the number of fields to be extracted—FP and TN summed up. | Integer |
| auto_ml_document | 6 | Extracted | Contains the number of extracted fields—TP and FP summed up. | Integer |
| auto_ml_document | 7 | ML Processing Time | Shows the processing time of the <bold>automation-extract</bold> plugin (post to the ML service + ML extract and so on). <bold>Note</bold>: the <bold>automation-extract</bold> plugin is deprecated. | Milliseconds |
| auto_ml_document | 8 | Manual processing time | Shows the time to process the document manually. | Milliseconds |
| auto_ml_field | 1 | Id | Primary key for the table. | Auto-generated integer number |
| auto_ml_field | 2 | Document Id | Foreign key to the document table. | |
| auto_ml_field | 3 | Group Name | Contains several fields—the equivalent of group answers. | Can be null. |
| auto_ml_field | 4 | Name | Field name—an element in the document to be processed by the AutoML model. | |
| auto_ml_field | 5 | Gold Value | Contains the correct field value provided in advance or during AutoQC. | Can be null. |
| auto_ml_field | 6 | Extracted Value | Means the correct value for the field. | Can be null. |
| auto_ml_field | 7 | TP | True Positive (correct). The model should have extracted the value and has done so. | 0 or 1 |
| auto_ml_field | 8 | TN | True Negative (correct). The model should have not extracted the value and has done so. | 0 or 1 |
| auto_ml_field | 9 | FP | False Positive (mistake). No value is supposed to be extracted, but the model has extracted something. | 0 or 1 |
| auto_ml_field | 10 | FN | False Negative (mistake). The model should have extracted the value but has not done so. | 0 or 1 |
| auto_ml_field | 11 | Confidence | A dependent variable representing the estimated accuracy for the given threshold returned by the model. | 0 or 1 |
| auto_ml_field | 12 | Score | Normalized score, meaning an independent variable returned by the model. The variable represents the threshold model confidence score for a given field rounded to the nth decimal point. | 0 or 1 |
| auto_ml_field | 13 | Result type | Stores the field extraction result calculated based on the following conditions:
|
|
| auto_ml_field | 14 | Report Date | The field is populated when the record containing the data for AutoML processing goes through the Analytics process step. Format: YYYY/mm/dd hh:mm:ss. | |
| auto_ml_field | 2 | Process Id | Foreign key to the process table. | |
| process_execution_ml | 2 | Baseline hours | Shows the total expected time to complete a task as if all fields were extracted manually. | Hours |
| process_execution_ml | 3 | Saved hours | Shows the difference between the expected time and actual manual effort. | Hours |
| process_execution_ml | 4 | Manual effort | Shows the actual time spent on completing a task: how long it took to manually extract those fields that the model failed to extract. | Hours |
| process_execution_ml | 5 | Manual work reduction | Shows how much time AutoML models save relative to the expected task completion time. | From 0 to 100% |
| process_execution_ml | 6 | STP Rate | Shows the rate of documents processed by bots only. | From 0 to 100% |
| process_execution_ml | Process execution Id | Foreign key to the process_execution table. |
| Table | Order | Field | Description | Value |
|---|---|---|---|---|
| bep_agent | 1 | Id | Primary key for the table. | Auto-generated integer number |
| bep_agent | 2 | Client Appid | This field specifies the client application using the BEP Worker in the format: <Control Tower host>, AutoML model service. | |
| bep_agent | 3 | Agent host name | IP address of an Agent. | |
| bep_agent | 4 | Worker Id | BEP worker ID. | Text |
| bep_agent | 5 | Worker profile | Control Tower, AutoML execution, AutoML training | |
| bep_agent | 6 | CPU consumed | Each BEP Worker reserves CPU for execution. | |
| bep_agent | 7 | Memory consumed | Each BEP Worker reserves Memory for execution. | Bytes |
| bep_agent | 8 | Report date | The field is populated automatically every minute to store the latest value for the BEP Worker metrics. Format: YYYY/mm/dd hh:mm:ss. | |
| bep_metric | 1 | Id | Auto-generated integer number | |
| bep_metric | 2 | BEP task Id | Primary key for the table. | Auto-generated integer number. Can be null if a BEP task comes from AutoML. |
| bep_metric | 3 | Task Id | Foreign key to the task table. | |
| bep_metric | 4 | Client application | Control Tower, AutoML | |
| bep_metric | 5 | Input queue date | Timestamp when the task message got into RabbitMQ. | |
| bep_metric | 6 | Worker queue date | Timestamp when the task message was moved from RabbitMQ to the Worker queue. | |
| bep_metric | 7 | Worker processing start date | Timestamp when the Worker started processing the task message. It is the same moment when the task message leaves the Worker queue. | |
| bep_metric | 8 | Worker processing end date | Timestamp when the Worker completed processing the task message. It is the same moment when the task message gets into the result queue. | |
| bep_metric | 9 | Result received date | Timestamp when the client application processed the task message result. | |
| bep_metric | 10 | Input queue wait time msec | Time spent in RabbitMQ. | |
| bep_metric | 11 | Worker queue wait time msec | Time spent in the Worker queue. | |
| bep_metric | 12 | Worker processing time msec | Time the Worker spent on processing the task message. |
| Table | Order | Field | Description | Value |
|---|---|---|---|---|
| bot_unit | 1 | Id | Primary key for the table. | Auto-generated integer number |
| bot_unit | 2 | Bot Relay Port | RPA Bot Relays orchestrate work. Bot Relay names are in the following format: <RPA Instance name>:<Port name>. | |
| bot_unit | 3 | Bot port | RPA bot port. | |
| bot_unit | 4 | Bot Agent port | RPA Bot Agent port. | |
| bot_unit | 6 | Host | RPA bot relay hostname. | |
| bot_unit | 7 | Fleet | A group of bot relays. Required for proper Bot Task distribution. | |
| bot_unit | 5 | Worker port | RPA Worker port | |
| bot_unit_session | 1 | Id | Primary key for the table. | Auto-generated integer number |
| bot_unit_session | 2 | Task Id | Foreign key for the task table. | |
| bot_unit_session | 3 | Bot unit Id | Foreign key for the bot unit table. | |
| bot_unit_session | 4 | Start date | The field is populated when making the first step in a process run by a user or a schedule. Format: YYYY/mm/dd hh:mm:ss. | |
| bot_unit_session | 5 | End date | The field is populated when the process is successfully completed or stopped. The null value is valid in case a process is still in progress or paused. Format: YYYY/mm/dd hh:mm:ss. | |
| bot_unit_session | 6 | Status | Shows if a process is available for running or deleted. | Active, deleted |
| bot_unit_session | 7 | Driver type | Shows the driver in use, such as Chrome, Firefox, desktop, universal, and so on. | |
| bot_unit_session | 8 | Error message | Explains why the session failed. Otherwise, it is null. | |
| bot_unit_session | 9 | Wait time msec | Shows how long a session waits to be processed by a bot. | ms |
| bot_unit_session | 10 | Processing time msec | Shows how long it takes for a bot to process a session. | ms |
| bot_unit_session | 11 | Total time msec | Calculated as the sum of the processing and wait times. | ms |
| bot_unit_status | 1 | Id | Primary key for the table. | Auto-generated integer number |
| bot_unit_status | 2 | Bot unit Id | Foreign key to the Bot Unit table. | |
| bot_unit_status | 3 | Bot unit status | The field is populated when the bot status changes. | Active, idle, unavailable |
| bot_unit_status | 4 | Date from | The field is populated when the bot status changes. Format: YYYY/mm/dd hh:mm:ss. | |
| bot_unit_status | 5 | Date to | The field is populated when the bot status changes. Format: YYYY/mm/dd hh:mm:ss. | |
| bot_unit_status | 6 | Status duration | The field is calculated based on the status start and end dates. | Seconds |
| process_execution_bot_utilization | 1 | Process execution Id | Foreign key to the process_execution table. | |
| process_execution_bot_utilization | 2 | Report date | The field is populated automatically on an hourly basis. Format: YYYY/mm/dd hh:mm:ss. | |
| process_execution_bot_utilization | 3 | Utilization rate | Shows the percentage of the bot active time relative to the available bot time. Bot availability is calculated on the 24/7 basis. | From 0 to 100% |
| process_execution_bot_utilization | 4 | Active time | Shows the period when bots have active sessions for a given process execution. | Seconds |
| process_execution_bot_utilization | 5 | Bot relay port | RPA Bot Relays orchestrate work. Bot Relay names have the following format: <RPA Instance name>:<Port name>. |
| Table | Order | Field | Description | Value |
|---|---|---|---|---|
| Component | 1 | Id | Primary key for the table. | Auto-generated integer number |
| Component | 2 | Name | IA Cloud component names. | OCR, Master, Agent, Bot Relay |
| Component | 3 | Work type | Defines what type of work a component supports. The Control Tower work type includes all machine tasks that are not related to RPA or OCR. | RPA, OCR, Control Tower, BEP |
| Component | 4 | Description | Additional information about a component. For example, the Application Server is Control Tower for App. | |
| component_metric | 1 | Id | Primary key for the table. | Auto-generated integer number |
| component_metric | 2 | Component Id | Foreign key to the component table. | |
| component_metric | 3 | Host | Component hostname | |
| component_metric | 4 | CPU | Shows the processor load across all cores at a given moment (every minute). The value is the percentage indicating whether any changes are required in the system to avoid capacity deficiency. | From 0 to 100% |
| component_metric | 5 | Cores | Shows the number of cores for IA Cloud components. | |
| component_metric | 6 | Disk | Percentage of time the disk is processing read or write requests at a given moment (every minute). | |
| component_metric | 7 | Memory available | Memory available at a given moment (every minute). | GB |
| component_metric | 8 | Memory total | Total memory available at a given moment (every minute). | GB |
| component_metric | 9 | Report date | The field is populated automatically every minute to save the latest value for the component metrics. Format: YYYY/mm/dd hh:mm:ss. |
| Table | Order | Field | Description | Value |
|---|---|---|---|---|
| process | 1 | Id | Primary key for the table. | Auto-generated integer number |
| process | 2 | Name | Process name, also known as a Business Process name. Defines the flow of Manual and Bot Tasks. | |
| process | 3 | Status | Shows if the process is available for running or deleted. | Active, deleted |
| process | 4 | Execution type | Shows if the process is a combination of tasks or just a single task from a process. | Single, composite |
| process | 5 | Creation date | Shows when the process was created. Format: YYYY/mm/dd hh:mm:ss. | |
| process | 6 | Last modified date | Shows when the process was modified. Updated every time after clicking the Save button. Format: YYYY/mm/dd hh:mm:ss. | |
| process_execution | 1 | Id | Primary key for the table. | Auto-generated integer number |
| process_execution | 2 | Process Id | Foreign key to the process table. | |
| process_execution | 3 | UUID | Universal unique ID for the process execution in the following format: https://<Control Tower instance name>/workfusion/secure/business-process/edit/<UUID>. Helps to find a given process execution from the Control Tower user interface. | |
| process_execution | 4 | Start date | The field is populated when the first step is started in a process run by a user or a schedule. Format: YYYY/mm/dd hh:mm:ss. | |
| process_execution | 5 | End Date | The field is populated when the process was successfully completed or stopped. The null value is valid in case the process is still in progress or paused. Format: YYYY/mm/dd hh:mm:ss. | |
| process_execution | 6 | Status | The field is updated as the process execution status changes. Deleted process executions are not stored in the table. For all statuses, except for completed, the corresponding process execution end date is null. | Completed, paused, processing |
| process_execution | 7 | Tracking activated | Shows that transactions are tracked, which helps to identify business entities at a certain step in a Business Process. | Activated, Not activated |
| process_execution | 8 | SLA Type | Type of the Service Level Agreement (SLA) applied at the process execution level. | Time, volume |
| process_execution | 9 | SLA value | Defines the SLA value. | Seconds or the number of transactions |
| process_execution | 10 | Issues | Shows if the process execution has issues, which means the maximal number of retries is exceeded at least for one record and the record failed. | With issues, without issues |
| task | 1 | Id | Primary key for the table. | Auto-generated integer number |
| task | 2 | Name | Task name, a step in a process. | |
| task | 3 | UUID | Universal unique ID for the task execution in the following format: https://<Control Tower instance name>/workfusion/secure/business-process/edit/<UUID>?subTaskUuid=<taskUUID>. Helps to find a given task execution from the Contol Tower UI. | |
| task | 4 | Process execution Id | Foreign key to the process_execution table. | |
| task | 5 | Task position | Shows the task position in a process. | Integer |
| task | 6 | Task type | Shows if the task is in a process or out of it. For instance, it can be a single Manual Task. | Single task, task in process |
| task | 7 | Start date | The field is populated when at least one record reaches the task in a process. Format: YYYY/mm/dd hh:mm:ss. | |
| task | 8 | End date | The field is populated when the task was successfully completed or the process was stopped. The null value is valid in case the task is still in progress or paused. Format: YYYY/mm/dd hh:mm:ss. | |
| task | 9 | Status | The field is updated as the task status changes. Deleted and draft tasks are not stored in this table. For all statuses, except for completed, the task end date is null. | Completed, bot processing, paused, processing |
| task | 10 | In/out of tracking | Shows if the task is subject to transaction tracking. | In tracking, out of tracking |
| task | 11 | Excluded from STP | Shows if it is required to exclude the task from STP calculations. Typically, used for mandatory Manual Tasks. | 0=no, 1=yes |
| Task | 12 | Execution type | Shows the task type. | Bot, Manual |
| task | 13 | Stateless execution | Shows if stateless execution is enabled. In this case, no operational data for the task is stored in the database. Data is stored only for the first marked task and for the Final Result. | 0=no, 1=yes. |
| Task | 14 | Has processing issues | Shows if the task execution has issues, meaning the maximal number of retries is exceeded for at least one record and the record failed. | 0=no, 1=yes |
| task | UUID | Process execution UUID | ||
| transaction_e2e | 1 | Id | Primary key for the table. | Auto-generated integer number |
| transaction_e2e | 4 | Creation date | The field is populated in two cases: 1) when transaction tracking is enabled, the field shows when the tracking started; 2) when transaction tracking is disabled, the field shows when the transaction defined as the input file record reaches the first task. Format: YYYY/mm/dd hh:mm:ss. | |
| transaction_e2e | 5 | Completion date | The field is populated when the transaction was successfully completed or the process was stopped. The null value is valid in case the transaction is still in progress. Format: YYYY/mm/dd hh:mm:ss. | |
| transaction_e2e | 6 | Status | The field is calculated based on the start and end dates. When the end date is null, the status is defined as processing. | Completed or processing |
| transaction_e2e | 7 | SLA result | Shows if the transaction is within SLA or violates it. | Within SLA, SLA violation |
| transaction_e2e | 8 | STP | Shows if the transaction goes straight through the process without manual handling. | 0=no, 1=yes |
| transaction_e2e | 9 | Retries | Shows the number of plugin attempts to process the transaction. | Integer |
| transaction_e2e | 10 | Processing time | Shows the transaction processing time in the course of the process execution end to end. | Seconds |
| transaction_e2e | 11 | Wait time | Shows the transaction overhead time in the course of the process execution end to end. | Seconds |
| transaction_e2e | 12 | Transaction cycle time | Shows the end-to-end processing time—the sum of the processing and wait times. | Seconds |
| transaction_e2e | 13 | Activated tracking | Shows that transactions are tracked, which helps identify business entities at a specific Business Process step. | Activated, Not activated |
| transaction_item | 1 | Id | Primary key for the table. | Auto-generated integer number |
| transaction_item | 2 | Transaction E2E Id | Foreign key to the transaction table. | |
| transaction_item | 3 | Task Id | Foreign key to the task table. | |
| transaction_item | 4 | Creation date | The field is populated when the transaction item is created in the process. Format: YYYY/mm/dd hh:mm:ss. | |
| transaction_item | 5 | Start date | The field is populated when the transaction item reaches the next task in the process. Format: YYYY/mm/dd hh:mm:ss. | |
| transaction_item | 6 | End date | The field is populated when the transaction item was successfully completed, or the process was stopped. The null value is valid in case the processing of the transaction item is still in progress. Format: YYYY/mm/dd hh:mm:ss. | |
| transaction_item | 7 | Completion date | The field is populated when the transaction processing result is received. Format: YYYY/mm/dd hh:mm:ss. | |
| transaction_item | 8 | Wait time | Shows how long the transaction item waits to be processed. | Seconds |
| transaction_item | 9 | Processing time | Shows how long it takes to process the transaction item. | Seconds |
| transaction_item | 10 | Total time | Calculated as the sum of the processing and wait times. | Seconds |
| transaction_item | 11 | Work type | Defines the work type applied to the transaction item. The Tower work type includes all machine tasks that are not related to RPA, OCR (if the OCR plugin is used), or AutoML. | AutoML, RPA, OCR (if the OCR plugin is used), Manual, Tower |
| transaction_item | 12 | Work type count | The field shows how many work types were used for processing the transaction. | |
| transaction_item | 13 | Worker Id | Foreign key to the worker table. Populated in case the transaction item is processed manually. Otherwise, the value is null. | |
| transaction_item | 14 | Retries | Shows the number of the plugin attempts to process the transaction item. | Integer |
| Table | Order | Field | Description | Value |
|---|---|---|---|---|
| Worker | 1 | Id | Primary key for the table. | Auto-generated integer number |
| Worker | 2 | UUID | Universal unique worker ID, also known as the native ID. | |
| worker | 3 | Name | First and last names of the worker. | |
| Worker | 4 | Type | Shows the worker type. | Bot, Manual |
| worker | 5 | Nickname | Nickname, used instead of the worker name when it is not specified. | |
| Worker | 6 | Contains the worker's email. | Can be null. | |
| Worker | 7 | Country | Contains the name of the worker's native country. | Can be null. |
Build report
To generate a report based on the selected dataset, drag-and-drop rows, columns, and values on the pivot table. Select the most appropriate visualization.
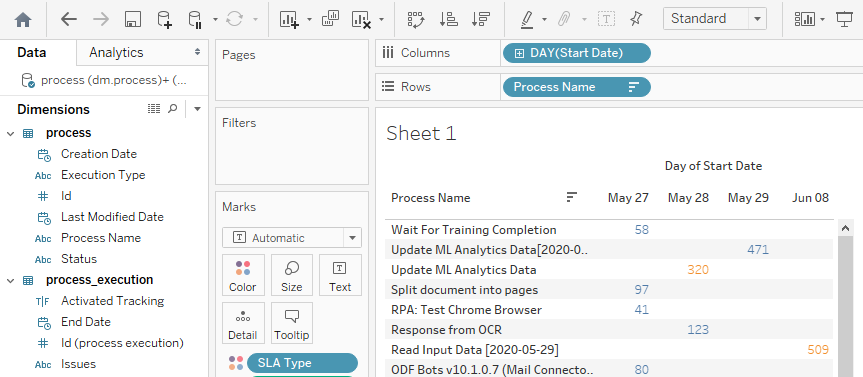
For detailed instructions on building reports, refer to the Tableau video tutorials (compatible with 10.x IA Cloud versions).
Publish report
For instructions on publishing the resulting report to the Analytics Server, refer to the Deploy custom dashboards guide.
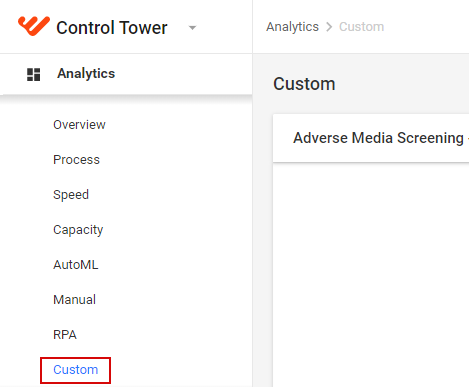
To check the publishing results, go to Control Tower. On the CT main menu, select Analytics > Custom and make sure the built reports are available there.
::: tip see demo For an example, refer to the Deploy custom dashboards guide. :::