
Overview
The Overview dashboard is the starting point for the analytics across your automation journey. It provides a complete picture of how Business Processes run within Intelligent Automation Cloud Enterprise and allows for drilling down from a high-level view to the execution details of a particular process.
The Overview dashboard aggregates the following data:
- Business Process transaction volumes
- Service Level Agreement (SLA) violation volumes
- SLA violation percentages
The dashboard uses these data to provide the following performance and throughput metrics:
- Transaction volumes:
- Created transactions
- Completed transactions
- Transactions in processing
- Speed:
- Processing time
- Wait time
- Total time
- SLA
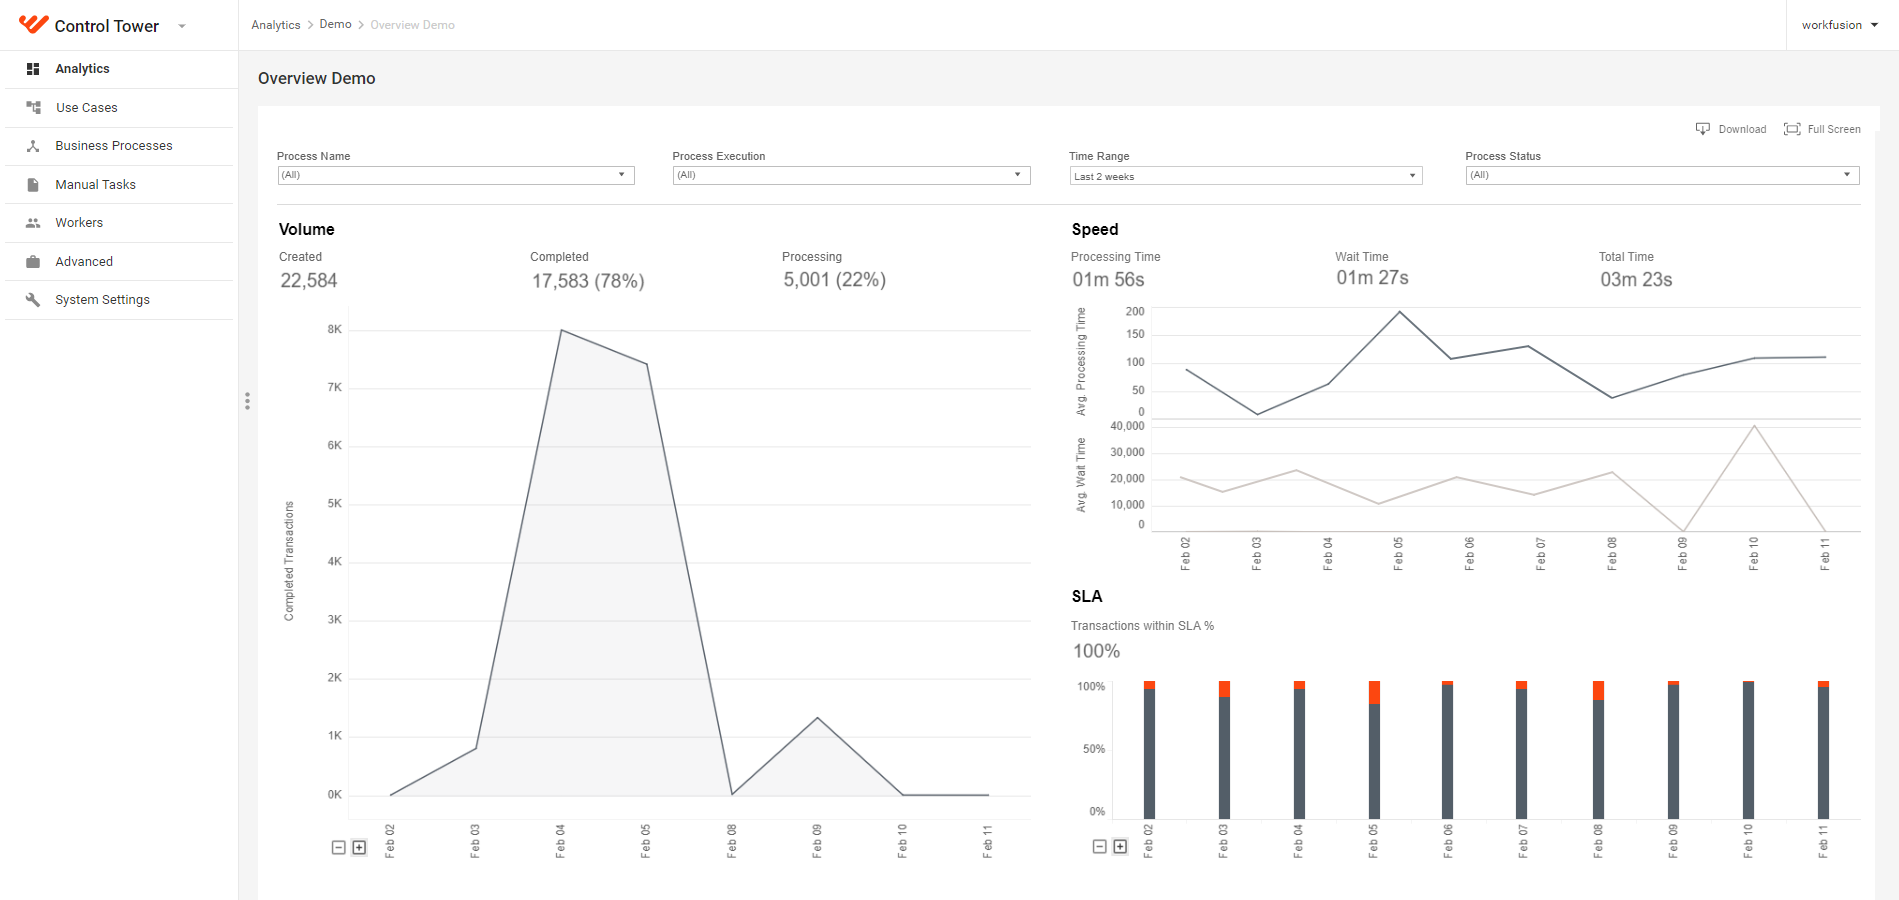
The plus (+) and minus (-) buttons are the standard Tableau feature for changing the aggregation level for an individual chart. Clicking the minus button aggregates to a less granular period, whereas clicking the plus one—to more granular.
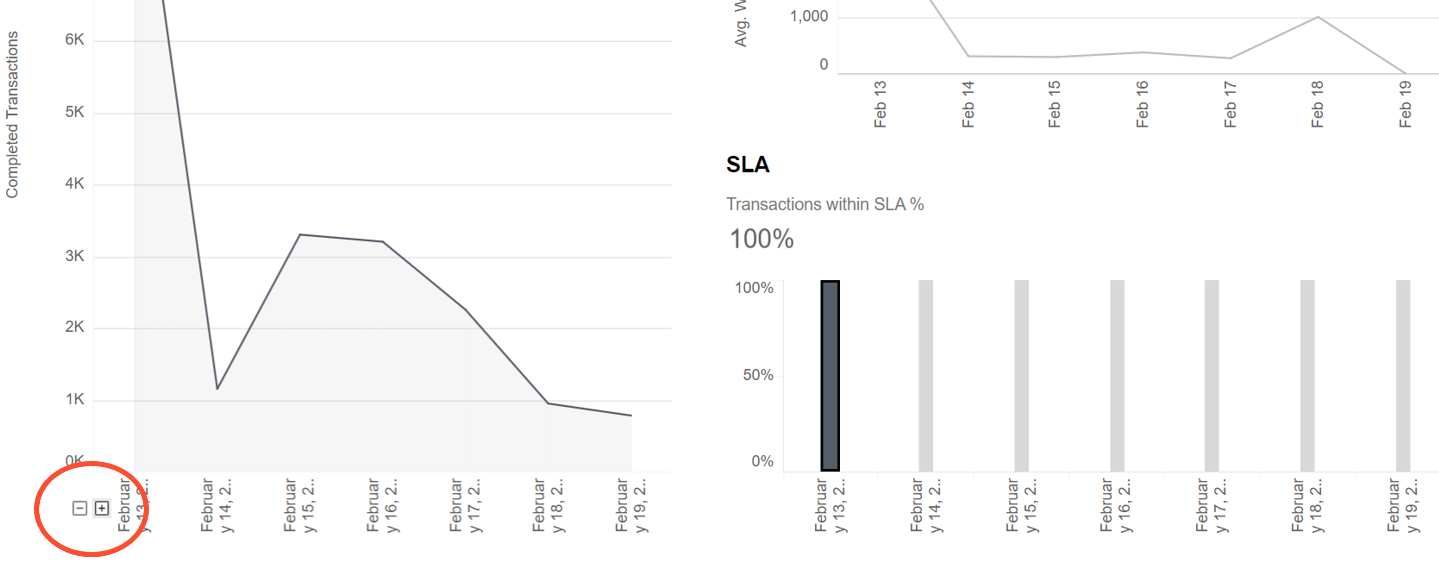
Available aggregation levels are as follows:
- Day
- Week
- Month
- Quarter
- Year
Volume
The Volume chart tracks the number of completed transactions for the day when particular process executions are started.
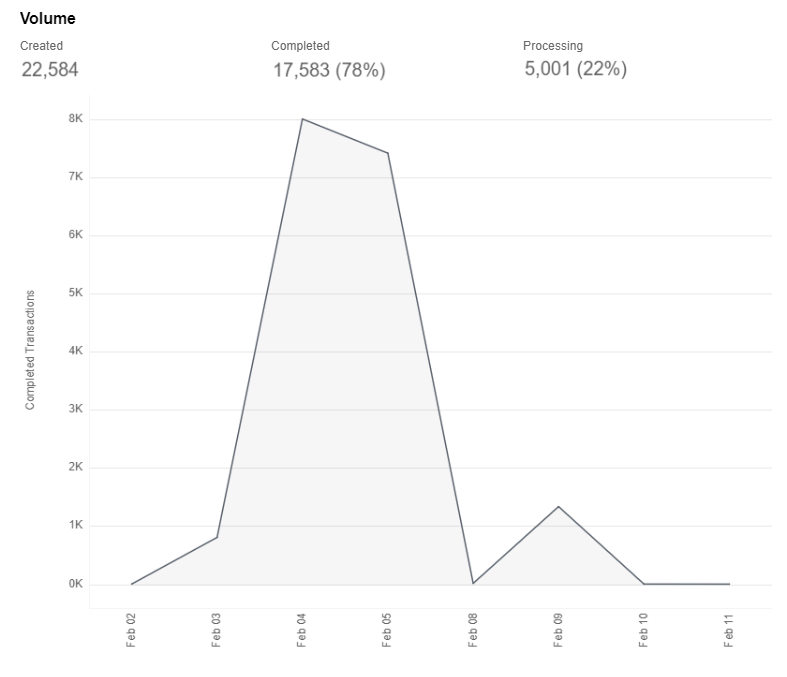
Volume metrics are as follows:
- Created transactions
- Completed transactions and their percentage of total created transactions
- Processing transactions and their percentage of total created transactions
When you set the Process Status filter to display only Completed processes in the Process chart, you can still see the chart demonstrating certain volume Processing, as shown in the figure below.
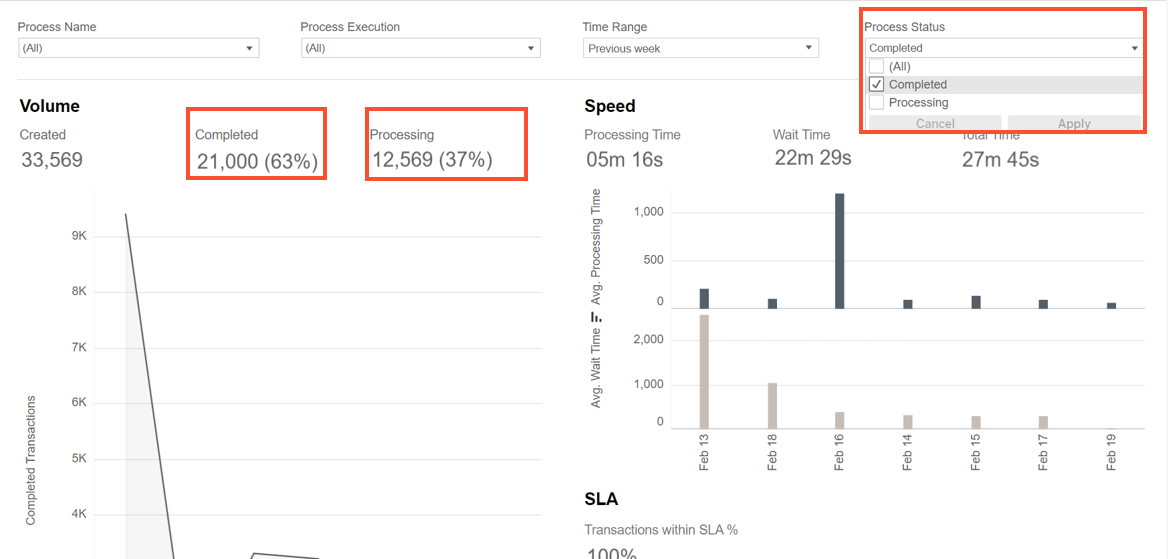
This happens because, on the Filters pane, you select the Process status—the execution status of a Business Process (BP). The Processing metric is based on the Transaction status—the status of transactions processed by the BP. Compare the two executions below:

If you stop a process execution that is in progress, you get the following result for the remaining process steps:
- Process status: Completed.
- Transaction status: Processing, meaning that there are transactions that are not completed.
With the above in mind, the Volume chart metrics have the following meanings:
- Created: transactions that were input.
- Completed: transactions processed end-to-end
- Processing: transactions that were input but are not finished.
Tooltip
The volume tooltip contains the following data:
- Process Execution Start Date
- Number of completed transactions started on the selected day
- Transaction tracking, with the both following options indicating the tracking status for the process executions started on the selected day:
- Activated: tracking enabled
- Not Activated: tracking disabled
Speed
The Speed chart provides data on the average Wait Time and Processing Time per transaction completed daily.
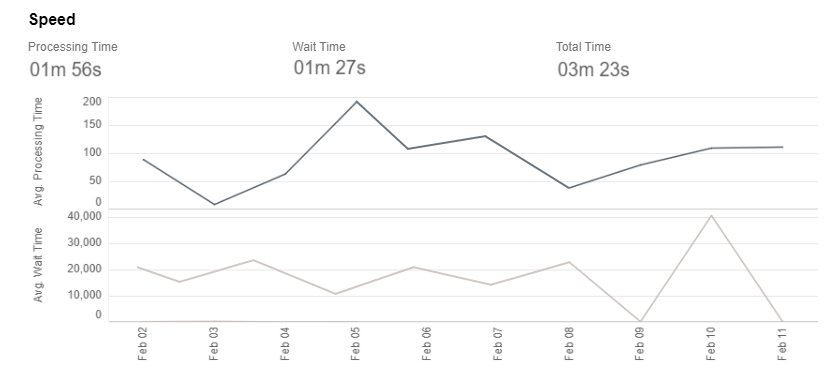
Speed metrics are as follows:
- Processing Time: the average time per completed transaction.
- Wait Time: the average time spent in queues per completed transaction.
- Total Time: the average end-to-end time per completed transaction, including Processing Time and Wait Time.
Investigate into Wait Time
The Wait Time shows the difference between the creation time of a transaction and the time when the transaction was picked up for processing. The value can be high when the transaction is created in WorkSpace and nobody takes it for processing or when RPA or OCR queues contain a lot of transactions and the transaction should wait because there are no available resources. The Wait Time depends on the implementation of the Bot step as well.
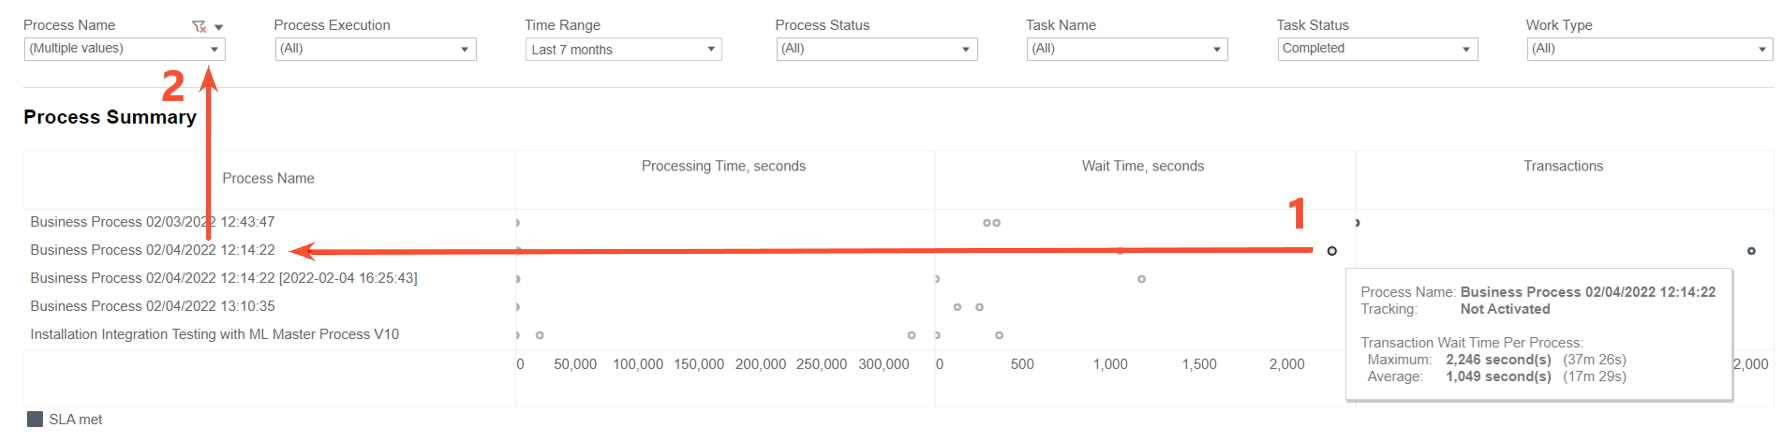
To find out which processes contribute to the high Wait Time, follow the instructions below:
- Go to the Speed dashboard. In the Process Summary chart, find the data points with maximum Wait Time.
- In the Process name filter, select the corresponding process.
- Scroll down to the Task chart to find out which step has the longest Wait Time.
Options to reduce the Wait Time depend on the implementation of your Business Process and the step with a bottleneck. For troubleshooting tips with real-life examples, refer to Process. Manage throughput and bottlenecks.
Also, depending on the step with a bottleneck, the following articles can be helpful:
Tooltip
The speed tooltip contains the following details:
- Process Execution Start Date
- Average Processing Time
- Average Wait Time
SLA
Service Level Agreement (SLA) defines whether the transaction processing meets business expectations. SLA can be set only if transaction tracking is enabled. For details, refer to Track transactions.
The SLA chart shows the percentage of transactions within SLA relative to the total of transactions completed daily.
note
If SLA is not set for a process execution, all associated transactions are considered to be within SLA by default.
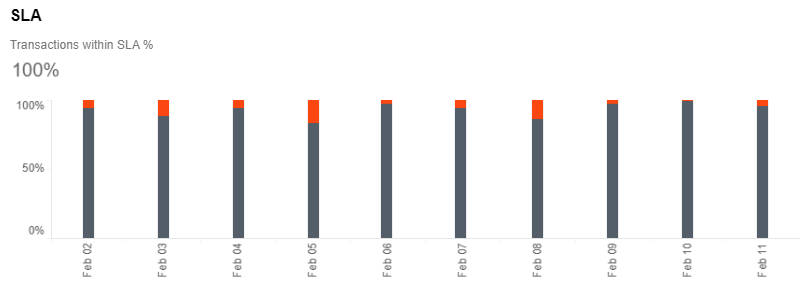
Transactions within SLA are highlighted in grey, whereas SLA violations—in red.
Tooltip
The SLA tooltip contains the following details:
- Process Execution Start Date.
- Percentage of transactions within SLA or percentage of SLA violations, depending on the bar area you hold the pointer over.