
Technology. Analyze ML model statistics
In this section, you will learn about the machine learning model principles and how to analyze business process executions with WorkFusion Analytics. Analytics charts will help you identify gaps in productivity and understand possible bottlenecks.
Understand Machine Learning basics
WorkFusion recognizes two main types of use cases where AutoML can be effectively applied:
- Classification
- Information Extraction
In this chapter, we will get acquainted with the basic metrics of Classification and Information Extraction models, and try to understand how to identify the issue and what could be the cause of the bottleneck.
Classification
The Classification use case is applied when it is necessary to define the class for the item (document). By class, we usually mean different document types. For example, invoices, purchase orders, and claims are processed in one workflow, and each document type is handled differently. That means we need to classify these documents before applying automation.
Information Extraction
The Information Extraction (IE) use case is applied when data defined by business logic is extracted from documents and processed according to business rules. In terms of Information Extraction, each use case data point is referred to as a "field." For example, invoice number, supplier name, the number of products, and total amount have to be extracted from all invoices.
Model metrics
Accuracy is the most intuitive performance measure, and it is a ratio of correctly predicted observation to the total observations. Accuracy = total number of correctly classified or extracted objects, divided by all values classified or extracted by the machine.
Automation Rate reflects how many correct results the machine found from ALL the correct results. Automation Rate = correctly classified or extracted objects divided by all the objects of this type existing in the data set (confirmed by SMEs).
Rework reflects the amount of effort required from a person to correct machine errors. Rework = values that were classified or extracted incorrectly, divided by all the correct values that are present in the data set (confirmed by SMEs).
Automation Efficiency indicates the total amount of work that was automated by the machine and is calculated as the amount of useful work done by the machine. Automation Efficiency = Automation Rate – Rework.
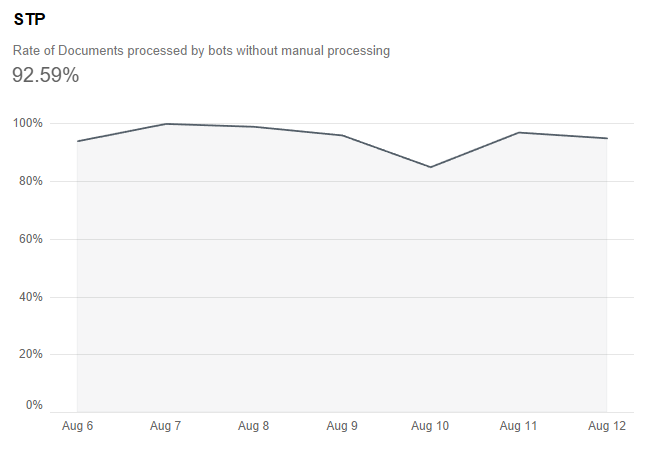
STP (Straight-through Processing) is the rate of documents processed entirely by bots without manual effort. STP Rate = documents processed fully bot-assisted, divided by documents overall.
Find bottlenecks
As an operations manager, you can analyze the following behavior:
- The amount of time that users spend on tasks has increased without significant changes in the document volume or process changes.
- Users noticed that in a manual task, several fields are almost always not filled / incorrectly tagged, and they need to be manually processed.
- Users noticed that the number of tasks for manual processing has increased.
- You want to find opportunities to increase the percentage of automation.
To understand the cause of the problem, we have the AutoML dashboard to help you understand whether this is a model issue or not.
Potential deviations that the user may have noticed while viewing the dashboard include:
STP rate goes down
This chart provides data on the Straight-through Processing: the rate of documents processed entirely by bots without manual effort.
On the chart, you can see that on August 10, the STP rate fell for some reason.
A high percentage of "Fully Manual" or "Bot Assisted" work
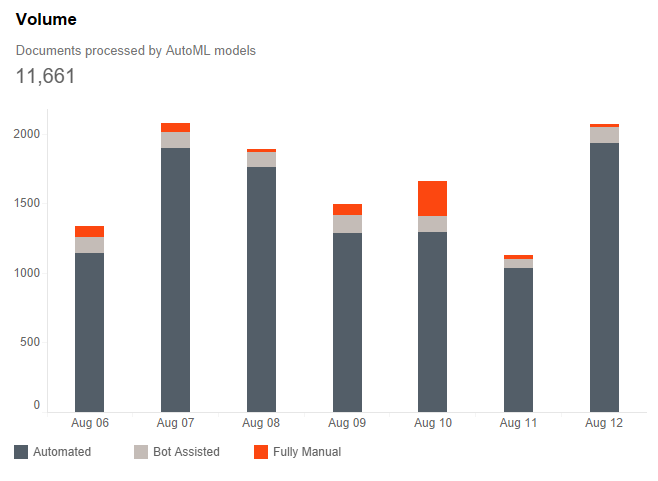
The Volume chart shows how many documents were processed daily.
The execution type splits the processed volume:
- Automated: a model fully processed a document
- Bot-assisted: a model extracted fields partially
- Fully Manual: a document was handled manually without a model
In the Volume chart, we see that the volume of documents on average has not changed on August 10, but the number of documents that have been processed fully manually has increased.
Manual Effort goes up
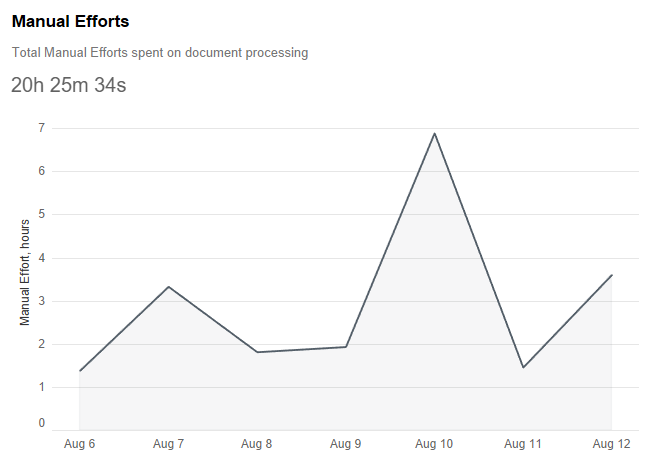
This chart shows the total amount of manual effort spent on document processing, both fully manual and bot-assisted processing.
Manual Effort (in hours) equal to the real time spent to perform a task: The time spent manually extracting the fields the model didn't extract.
In the Manual Effort chart, we can identify that users spent significantly more time on August 10 on tasks than in previous days.
Generally, changes in the charts above are interrelated. For example, if STP goes down, then the number of documents that are processed manually increases, and therefore manual effort increases. The first three charts help determine where and when any changes occurred in the process. Next, we go down to the level of model results, where we can understand what specific fields and values were involved.
However, it is also possible that the STP rate remains at the same level. Still, the number of documents increases significantly (for example, another source is added), and therefore the amount of manual work grows. However, this is not due to the deterioration of the models, which can be identified from the graphs below.
A high percentage of mistakes / low confidence
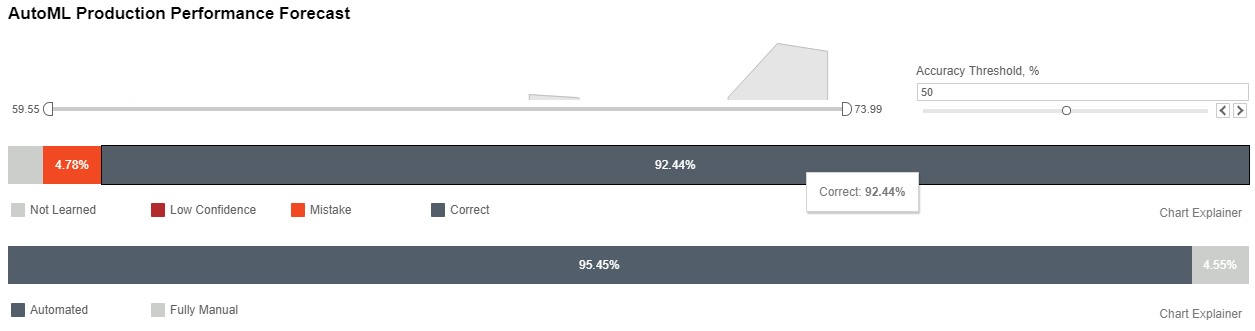
Quality description metrics are as follows:
- Not Learned — a ratio of fields that should have been but were not extracted by a model.
- Low Confidence — a ratio of fields that should / should not be extracted but were extracted, with a model score lower than the selected Accuracy Threshold.
- Mistake — a ratio of fields that should / should not be extracted, but extracted wrong values with a model score equal to or higher than the selected Accuracy Threshold.
- Correct — a ratio of the correctly extracted fields.
Automation Rate chart has the following metrics:
Automated — a ratio of documents that were successfully processed by a model, with or without human assistance.
Fully Manual — a ratio of documents that were processed by humans.
Using the filters on the dashboard, users can see what metrics were relevant for the past period. We can assume that over the past week, the number of Correct answers and the Automation Rate were higher. In the chart above, we can see that 7.56% are Mistake and Not Learned values. We will go down further and see what fields have difficulties for now.
A high percentage of field appearances in manual tasks
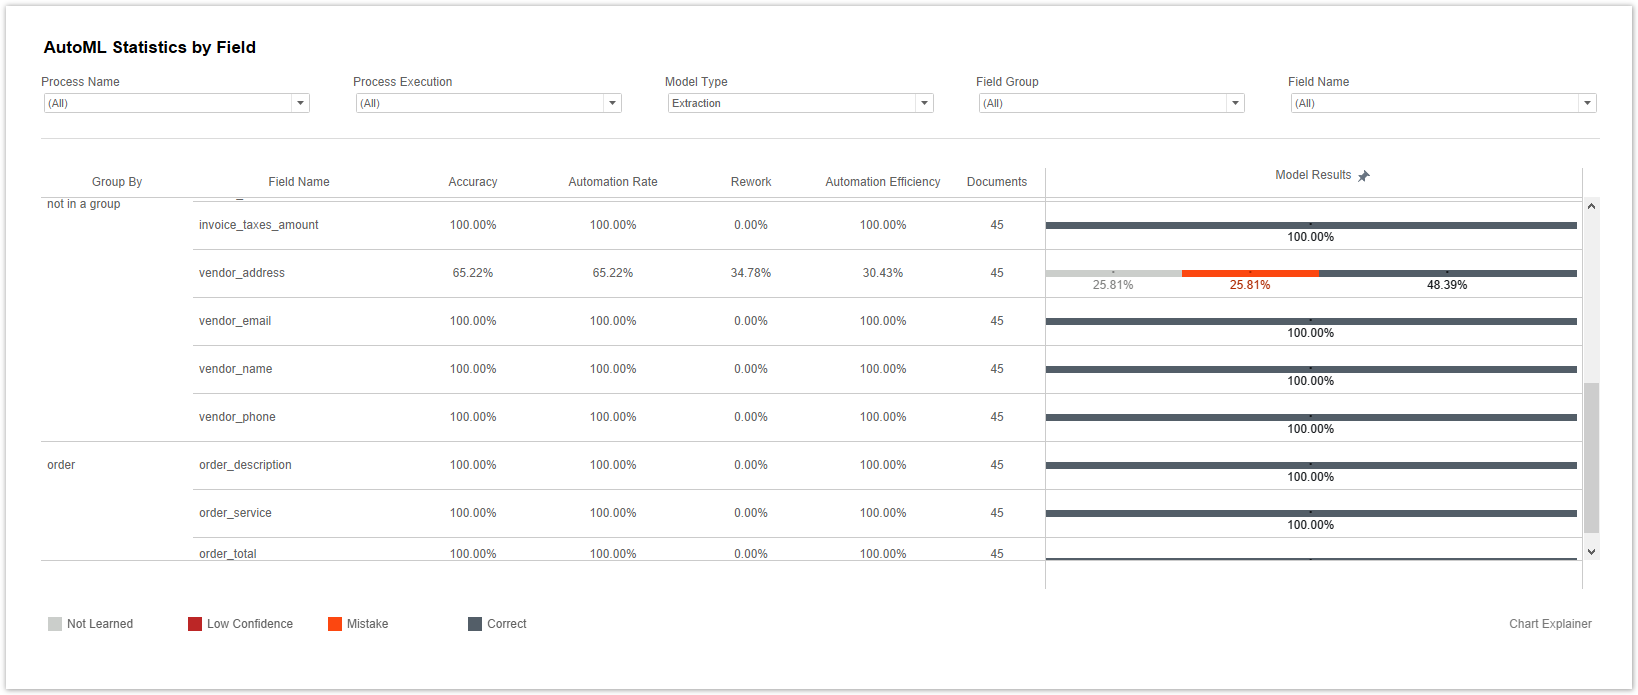
The AutoML Statistics by Field chart shows the model quality results per each field over all the documents.
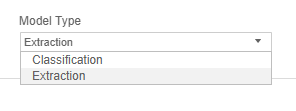
Set the model type via the Model Type filter: Classification or Extraction.
Here we find that the
vendor_addressfield has a large percentage of Mistakes, and in some cases, was not recognized by the model at all. In only 48.39%, the values are correct. The answer why this could happen will solve the issue.What do the statistical metrics in this table mean?
Accuracy means the total number of correctly extracted
vendor_addressvalues, divided by all values extracted by the Information Extraction model. Not Learned values are excluded from this metric, as they were not extracted.Automation Rate is calculated as correctly extracted vendor_address values, divided by all correct values existing in the documents.
Rework is values that were extracted incorrectly, divided by all the correct values in the documents.
Automation Efficiency is equal to Automation Rate minus Rework.
Fields with the Mistake or Not Learned values are both the cause of poor results and a place for improving automation performance. By analyzing a detailed field chart, the following issues can be identified in most common scenarios.
Model results: Mistake or Low Confidence
| Possible reason | Solution |
|---|---|
| Training and test datasets prepared with inaccuracies or values are missed | Retrain the model |
| Inconsistent gold data or insufficient normalization (extra symbols, different data types) | |
| Incorrect grouping for multi-value fields | Post-processing |
| OCR errors in extracted values | Post-processing |
| Specific or broken document structure after OCR |
Model results: Not Learned
| Possible reason | Solution |
|---|---|
| Not enough examples in the training set | |
| Tagging inconsistency in the training set, the field is tagged in different positions | Retrain the model |
| New document structure after OCR within the known layout | Retrain the model |
| Complicated dependencies in extracting logic that haven’t been found by the out-of-the-box model | Additional components (ML SDK) |
Summary
The AutoML dashboard is handy for a general analysis of ML model performance and an explanation of why the model works in one way or another. It also allows you to conduct a detailed analysis of the results and make decisions on improving the model or explain that the maximum in automation for this business process is reached.
To summarize:
- Classification of documents and Extraction of Information from them are the main use cases of the AutoML application.
- Such metrics as increased time spent on a task or increased amount of manual work indicate the presence of a bottleneck.
- To detect a bottleneck, use the AutoML dashboard with the STP, Volume, and Manual Efforts charts.
- Remember also to check Model results and analyze percentage or Errors and Field appearance in manual tasks.