
Process
The Process dashboard allows for an in-depth drill-down into the following entities:
- Process execution volume by status
- Quantity of completed transactions and transactions in processing
- SLA (Service Level Agreement) violation slices by time
- Volume and number of processes without preset SLA
- Process executions with issues
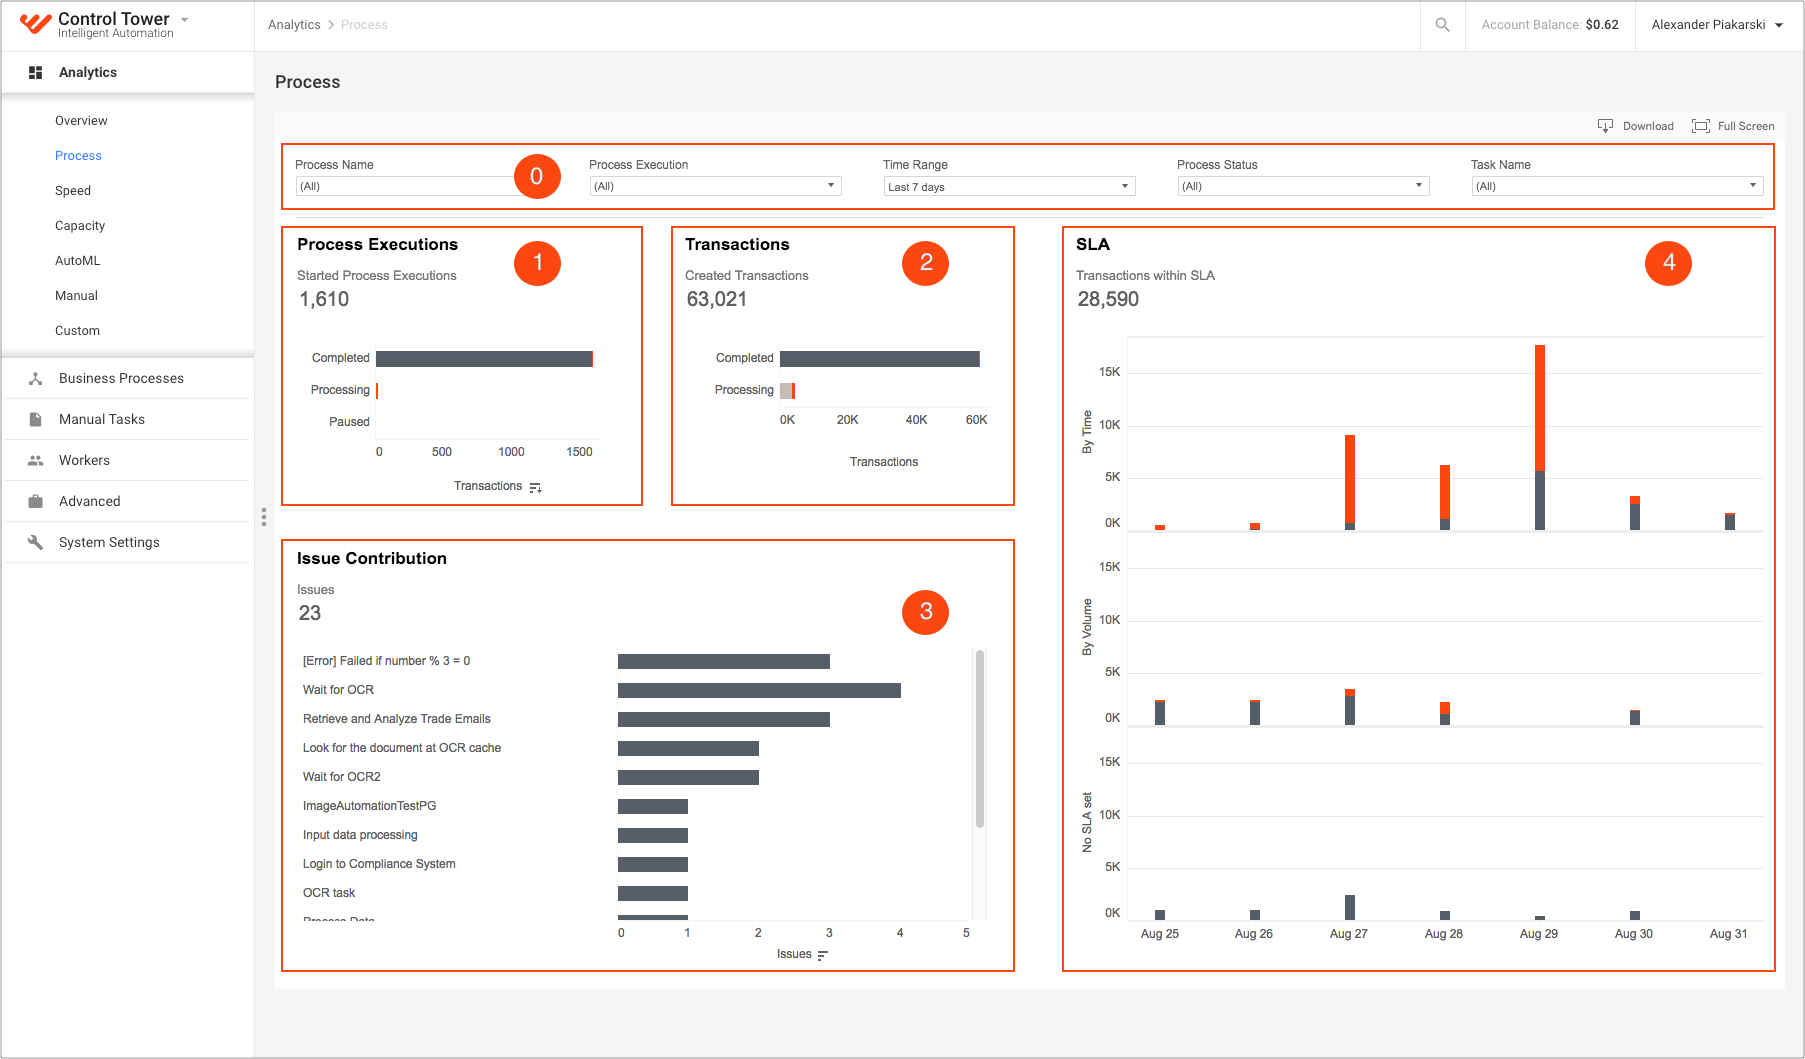
The dashboard comprises the following charts based on the indications in the figure above:
Process Executions
The chart shows the number of process executions with a breakdown by the process status:
X-axis: number of process executions
Y-axis: process statuses
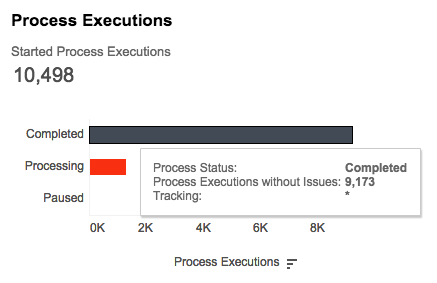
The red color segment indicates transactions with issues.
Tooltip
The tooltip contains the following data:
- Process Status
- Number of Process Executions
- Transaction tracking
Transactions
The chart shows the number of transactions with breakdown by their status:
X-axis: number of transactions
Y-axis: process statuses
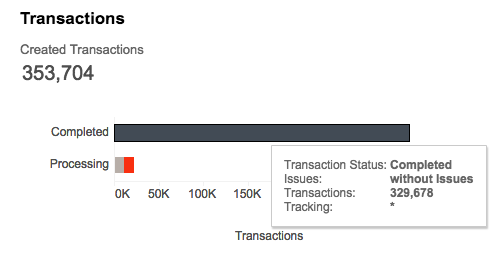
The red color segment indicates transactions with issues.
A transaction can have one of the following statuses:
Completed: processed end-to-end according to the logic of a Business Process.
For example, a transaction is end-to-end processing of an email: a message is picked up from a mailbox, marked as read, classified, data is extracted and inserted into a third-party system. Once all required steps are performed, the transaction is marked as completed. Also, if there is some logic for exceptions and the transaction hits the exceptions, it is marked as completed.
Processing: the transaction has not reached the end of the Business Process execution and has not yet been executed.
For example, an email is waiting to be picked up, or waiting in any queue, such as in OCR or Workspace, or a third-party system is unavailable, and the transaction is waiting, or an execution failed, but the transaction has not reached the end. The Business Process can be modified and repaired for the transaction.
When you set the Process Status filter to display only Completed processes, you can still see the Transactions chart demonstrating Processing transactions even if all Process Executions are shown as Completed.
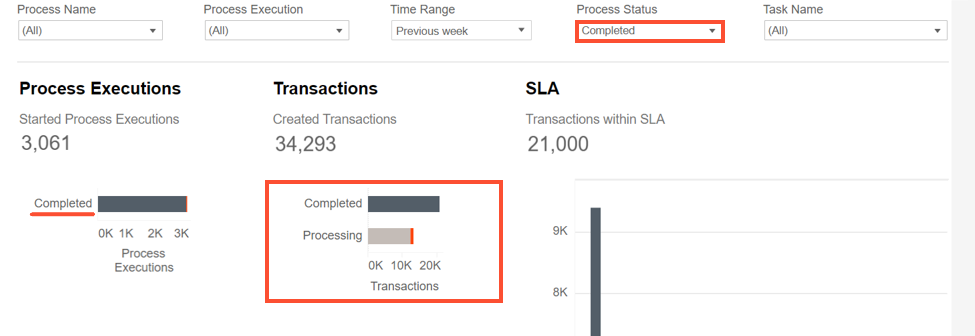
This happens because, on the Filters pane, you select the Process status—the execution status of a Business Process (BP). The Processing metric is based on the Transaction status—the status of transactions processed by the BP. Compare the two executions below:

If you stop a process execution that is in progress, you get the following result for the remaining process steps:
- Process Executions: Completed.
- Transactions: Processing, meaning that there are transactions that are not completed.
Tooltip
The tooltip enables access to the following data:
- Process Status
- Issues
- Number of transactions
- Transaction tracking
For the Issues tooltip, issues are counted at the level of Business Process executions. This means that all transactions within those BP executions are assumed as having issues. Thus, issues are not related to transactions themselves. As a result, the completed with issues and processing with issues statuses mean that there are some issues within associated executions.
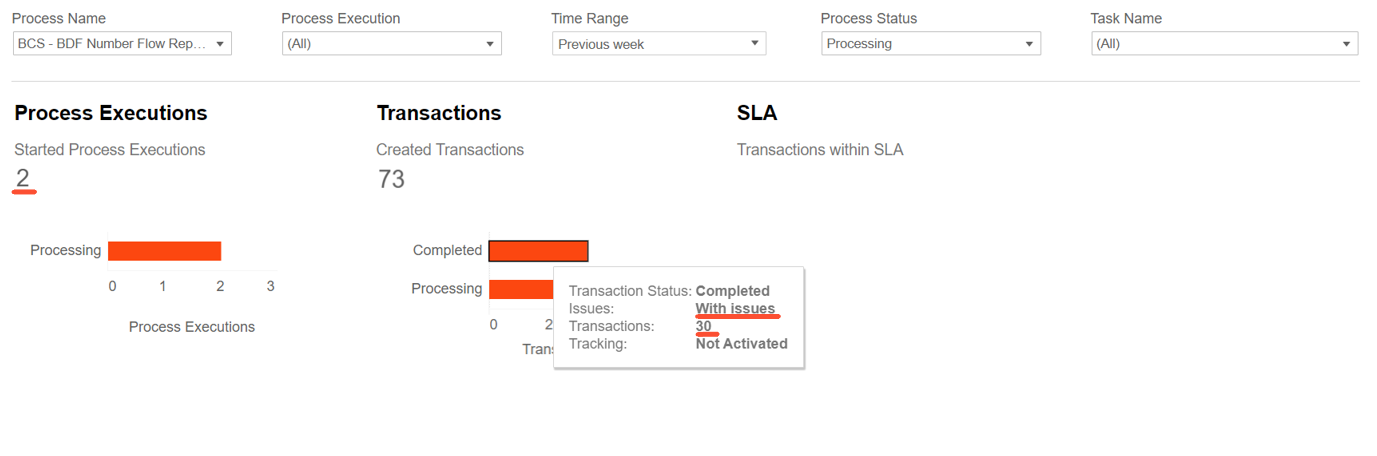
For instance, in the figure below, two process executions under processing have issues, and 30 transactions within the executions are marked as Completed with issues.
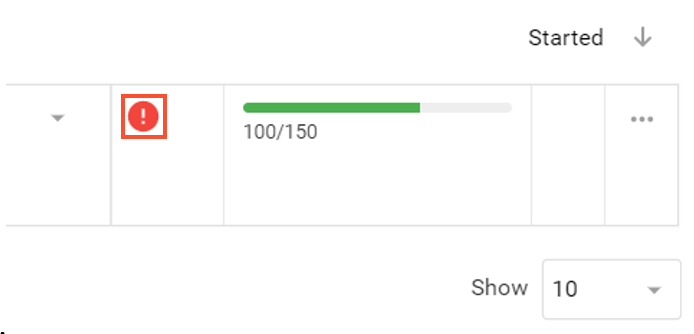
To see detailed issues, go back to the Business Process list, find the required process execution (instance), and click the red exclamation mark:
Issue Contribution
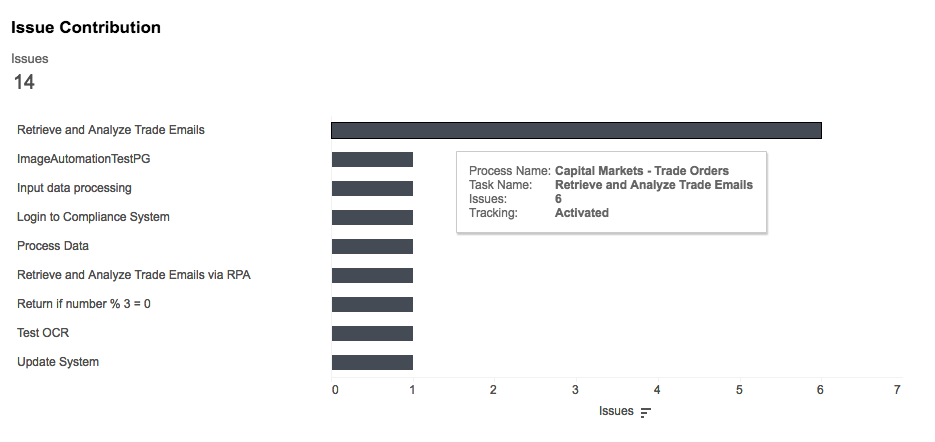
The chart shows tasks with issues:
X-axis: number of issues
Y-axis: list of tasks in the descending order
Tooltip
The tooltip contains the following information:
- Process Name
- Task Name
- Number of issues
- Transactions tracking
SLA
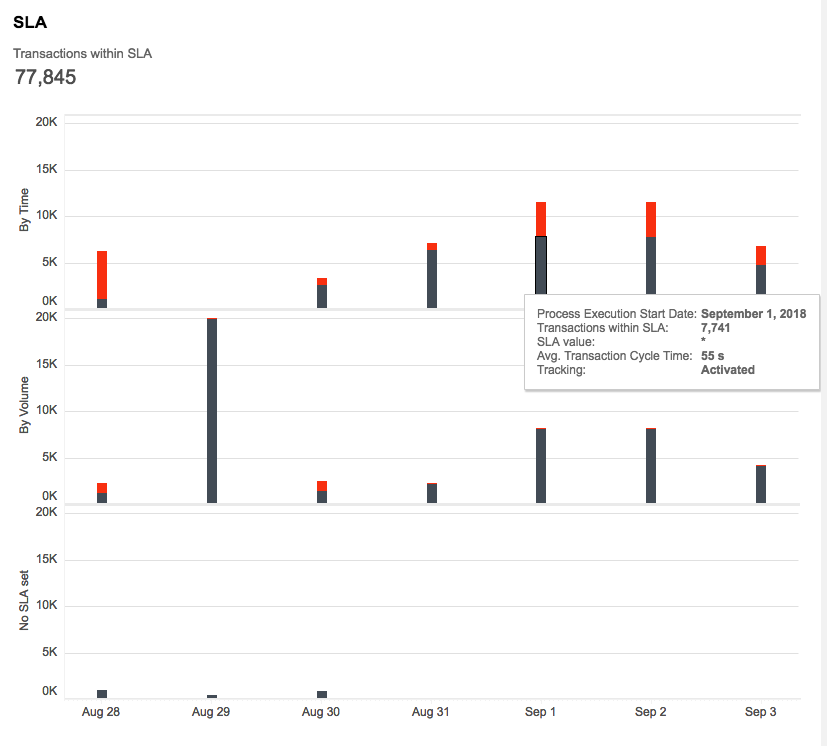
SLA (Service Level Agreement) is used to define whether transaction processing meets business expectations. The chart shows the number of transactions within SLA and SLA violations on a daily basis:
X-axis: Process Execution Start Date
Y-axis: the number of transactions on a particular day, divided into three parts, depending on the SLA setting
There are three possible SLA settings:
SLA by Time. The cycle time of a transaction must be lower than X seconds. If a transaction cycle time is less than or equal to the SLA value, a transaction meets SLA. Otherwise, SLA is missed.
SLA by Volume. The transaction volume must be higher than X transactions per day. If the volume for a day is greater than or equal to the SLA value, all transactions meet SLA. All transactions below the SLA value are marked as missed SLAs.
No SLA set. All transactions are considered to meet SLA by default.
Note that the SLA chart shows only transactions for completed Business Process executions. So, if there are no completed Business Process executions, the chart is empty. If the transaction tracking is not activated, all transactions for such completed executions are counted in the No SLA set category. To enable Transaction tracking, refer to the Track transactions topic.
Color coding
The chart uses the following color coding:
-Gray: transactions within SLA (met SLA)
-Red: SLA violations (missed SLA)
Tooltip
The tooltip contains additional information:
- Process Execution Start Day.
- Number of SLA violations or Transactions within SLA, depends on which element you hold the pointer over.
- SLA value:
- Seconds for SLA by Time.
- Number of transactions for SLA by Volume.
- Null for No SLA set.
- Average Cycle Time for the element's aggregated transactions.
- Transaction tracking.