
Issues related to database performance
Control Tower (CT) can work slow due to high load on the MS SQL end, slow queries, deadlocks.
Confirm issue
To confirm your issue is due to the database indeed, check Kibana dashboards. Refer to Performance dashboards | Overview, but pay extra attention to the following:
important
Perform the steps below only if the Client: Task Transition / Result: processing by client app value is high. Otherwise, skip the rest of the checks and investigate another possible cause.
Once you confirm your issue is due to the database performance, follow the steps below to identify the most probable root cause.
Identify and eliminate root cause
Check data volume
Make sure the issue is not caused by too much data in the database.
Firstly, check the out-of-the-box Data Purge scheduler. In Control Tower, go to System Settings > System Preferences and click the Schedule Settings tab.
In case you discover that the issue is related to the active Data Purge configuration, proceed as described below:
If the purge is configured to run during business hours, reschedule it to start, for instance, at night or during weekends. For instructions, refer to the Edit Data Purge settings article.
If your Data Purge takes too long to complete, thus preventing Business Processes from running freely, create a support ticket, provide the Data Purge details and a short description of the issue.
Alternatively, you can work with Database Analysts (DBAs) to check the following bullets from the standard checklist:
Regardless of the UI Data Purge, check if there is a stored procedure running a Data Purge:
select db_name(req.database_id) as db_name
     , st.text as full_text
     , substring(st.text
                , (req.statement_start_offset / 2) + 1
                , ((case statement_end_offset
                        when -1 then datalength(st.text)
                        else req.statement_end_offset
                    end - req.statement_start_offset) / 2) + 1
                 )                  as statement_text
     , req.session_id
     , req.blocking_session_id
     , req.wait_type
     , req.wait_time
     , req.wait_resource
     , req.status
     , req.command
     , req.cpu_time                 as cpu_time_ms
     , req.total_elapsed_time       as total_time_ms
     , req.percent_complete
     , qp.query_plan
from sys.dm_exec_requests                           req
outer apply sys.dm_exec_query_plan(req.plan_handle) qp
cross apply sys.dm_exec_sql_text(sql_handle)        st;
Check table sizes.
Check Data Store sizes.
Analyze Data Stores and queries
Verify if the issue is related to Data Stores and inefficient queries:
- Find top queries by execution.
- Find top queries by CPU.
- Check indexes on Data Stores.
- Check the Data Store column size limitation.
Take a few thread dumps in CT and provide them to the Workfusion team with your support request ticket. For detailed thread dump instructions, refer to Thread Dump analysis. The team will analyze the data and try to figure out the problem.
Investigate CPU usage
When you observe the average CPU usage linearly increasing, this can be due to the growing size of the database log. The transaction log for the workfusion database can get filled up due to growing sql LOG_BACKUP.
If the problem is there, reach out to the database team.
Evaluate disk utilization
Check the server disk space:
When disk utilization in the database server exceeds 90%, it can due to either of the following:
- The application creates large amounts of data.
- Data Purge is not enabled or misconfigured.
Work with the DBA team to identify the root cause and eliminate the issue.
Click to see additional information and examples
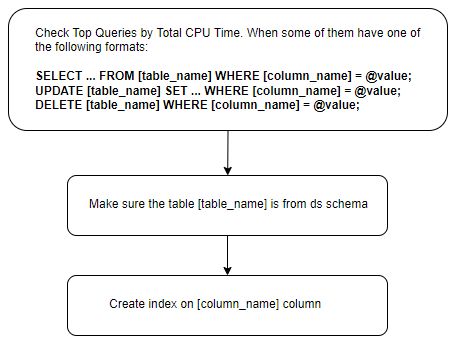
When you have checked your Data Stores and found slow queries running in them, consider SELECT Optimization and applying indexes:
important
You can apply indexes and optimize SELECT only against Data Store tables. It is not recommended to make the adjustments in any other way unless they are made during a support call by a dedicated Workfusion support DBA team.
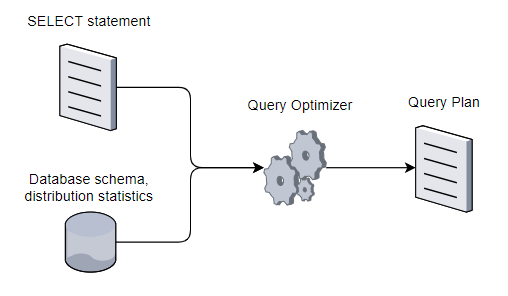
Under the hood, slow query execution begins with the database server analyzing the statement to determine the most efficient way to extract the requested data—that means to optimize the SELECT statement. The task is on Query Optimizer. Typically, Query Optimizer does the following:
- Parses, checking the SQL and TSQL syntax, keywords, and rules
- Binds, creating a query tree with a basic list of processes required to execute the query
- Optimizes, finding the best way to execute the query
You can find detailed information on Query Optimizer in the Microsoft documentation.
The output of the Query Optimizer is a Query Execution Plan defined as a sequence for accessing source tables. The plan defines how those source tables are accessed and joined together and any other operations along the way. The SELECT statement references multiple tables that can be used to further extract data from other tables, which might complicate things. Therefore, optimization comes in handy. In this case, the required optimization is selecting one execution plan from a multitude of possible ones.
The diagram below depicts the high-level query execution architecture:
There are three important optimization rules:
- SQL Server Query Optimizer does not choose only an execution plan with the lowest resource cost. It chooses a plan that returns results to the user at a reasonable cost and the fastest speed. Parallel query execution consumes more resources, but it is way faster.
- SQL Server Query Optimizer relies on distribution statistics to estimate the resource costs of different methods for extracting information from a table or index.
- SQL Server Query Optimizer is important because it enables the database server to adjust dynamically to changing conditions.
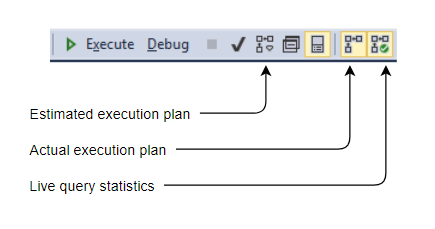
For an Execution Plan, the MS SQL Management Studio user interface features the following options:
- The Estimated Execution Plan is a compiled plan produced by Query Optimizer.
- The Actual Execution Plan is the same as the compiled plan plus its execution context. This includes runtime information available after the execution is completed, such as execution warnings or the elapsed and CPU time during execution in newer Database Engine versions.
- Live Query Statistics is the same as the compiled plan plus its execution context. The statistics include runtime information during execution and are updated every second. Runtime information contains, for example, the actual number of rows flowing through operators.
Based on the example below, let's see how inefficient a query can execute and how to track it in the Management Studio analyzer view:
SELECT DISTINCT
    PRODUCT.ProductID,
    PRODUCT.Name
FROM Production.Product PRODUCT
    INNER JOIN Sales.SalesOrderDetail DETAIL
ON PRODUCT.ProductID = DETAIL.ProductID
OR PRODUCT.rowguid = DETAIL.rowguid;
This is how a query is recognized by query optimization:
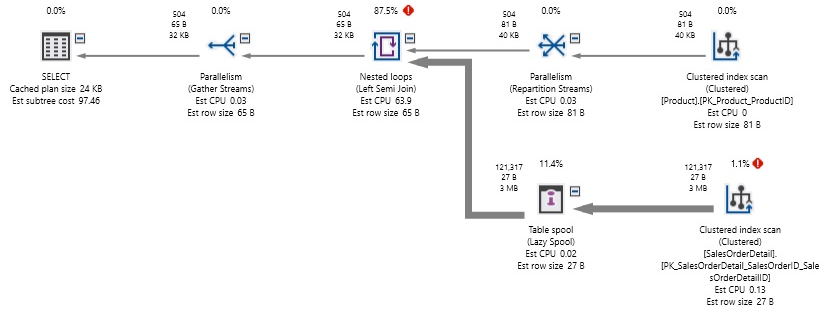
After executing the above SQL script, you get the results for specific tables, as shown below. In this particular case, the Product table has only 504 rows, but SalesOrderDetail has 121,317:

From the screenshots above, you can see that processing the OR condition statement took a lot of computing power. 1.2 million reads were made—far more data was read than the full content of each table. In addition, the query took extremely long to execute.
To speed up execution and free resources, improve the SQL script accordingly:
SELECT
    PRODUCT.ProductID,
    PRODUCT.Name
FROM Production.Product PRODUCT
    INNER JOIN Sales.SalesOrderDetail DETAIL
ON PRODUCT.ProductID = DETAIL.ProductID
UNION
SELECT
    PRODUCT.ProductID,
    PRODUCT.Name
FROM Production.Product PRODUCT
    INNER JOIN Sales.SalesOrderDetail DETAIL
ON PRODUCT.rowguid = DETAIL.rowguid
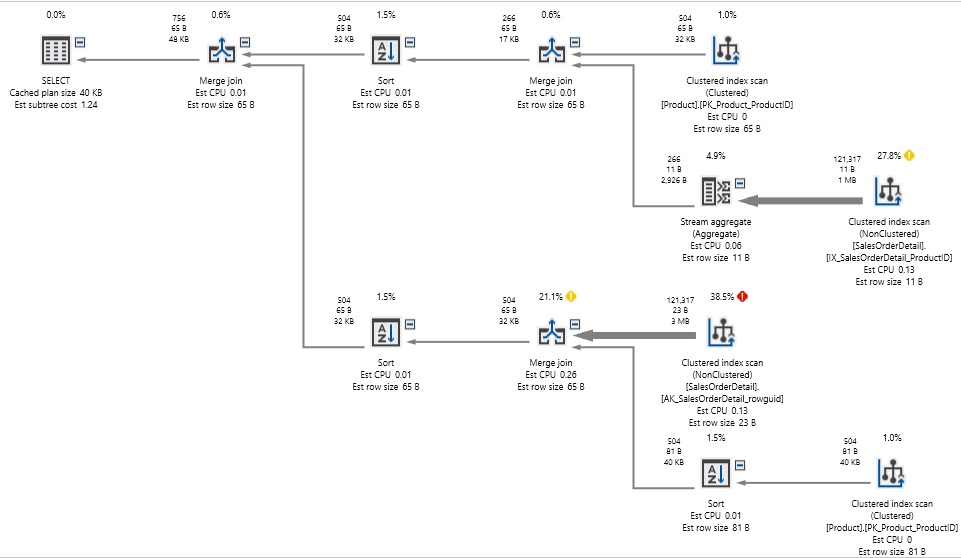
Each element of the OR condition statement above was replaced with a SELECT statement querying each table twice. The UNION statement concatenates the result set and removes duplicates. The combination of the above makes execution way faster and more efficient:

In the example above, the execution plan is significantly more complex. However, the logical read number dropped from 1.2 million to 750, and the query was executed in less than half the time required before.
Other potential causes of query performance degradation
Other potential causes for investigation include:
Wildcard string search is inherently expensive. Only improved design and architecture rules allow you to either eliminate the leading “%” or set search restrictions, bringing in other filters or solutions.
Large-volume write operations often lock an entire table for the period while data is being brought up to date, constraints are checked, indexes are updated, and triggers are processed (if any). Locking and blocking prevent data corruption, but when the contention continues for a long time, other queries can be forced to wait. Moreover, it generates log file growth causing physical storage issues.
Missing or defragmented indexes can potentially slow down execution. Check Studio GUI or the execution plan XML for "MISSING INDEX" warnings. You can also easily defragment indexes, but you may want help from the DBA team to execute the defragmentation query.
Overindexing degrades the Insert, Update, and Delete operations and reduces available space.
High table count forces Query Optimizer to sift through a larger result set and discard more potentially valid results as it has well under one second to find a great execution plan. If you are evaluating a poorly performing query with a large table count, try splitting it into smaller queries. This tactic may not always provide a significant improvement. Still, it is often effective when other avenues have been explored, and there are many tables read together in a single query.
Partnering with the DBA team, collect data on deadlocks. A deadlock occurs when two processes compete for exclusive access to a resource but cannot obtain it. This results in a standoff where neither process can proceed.
The only way out of a deadlock is for one of the processes to be terminated. SQL Server automatically detects deadlocks and kills one of the processes known as the victim.
warning
When you attempt to kill a process, you have to be absolutely sure you can do this. Otherwise, this may cause significant damage.
If there are many deadlocks, SQL Server adjusts the frequency of the deadlock search automatically and returns to default five-second intervals if deadlocks are no longer as frequent.
For best practices of addressing deadlocks, refer to DB locks analysis.
Real-world example
Below is a customer case to demonstrate the database performance issues from the above sections and their solution:
update "ds__odf_transactions"
set transaction_data = '{ "meta" : { "transaction_dto_id" : "d6c9800a-5982-4fb4-882f-b3306b21eba4" }, "id" : "d6c9800a-5982-4fb4-882f-b3306b21eba4", "docs" : null }'
where transaction_id = 'd6c9800a-5982-4fb4-882f-b3306b21eba4'
The issue with the query was basically about a missing index in the transaction_id column. This caused a full table scan (cluster index scan), locking many rows and resulting in deadlocks in other sessions.
The DBA team proposed the following solution:
alter table ds.ds__odf_transactions alter column transaction_id nvarchar(36);
create nonclustered index ix_ds_odf_transactions_transaction_id on ds.ds_odf_transactions (transaction_id);
Output
If you confirm the issue is related to slow database performance and you cannot resolve it by any methods described above, gather required data as listed in Identify and eliminate root cause and provide them in your support request ticket. Otherwise, continue the investigation.
View also: