
Superset Analytics
Superset Analytics is an open-source tool that provides several built-in dashboards for Digital Workers that already contain all required metrics. To reflect your business needs, you can also create custom dashboards from scratch or use existing ones as a reference by copying and altering them.
Superset provides you with the following capabilities:
- Create dashboards.
- Search metrics.
- Create any charts, for example, heatmaps.
- Set up data visibility permissions for users and groups.
The Superset dashboards are similar to Tableau's ones and can provide the same information as in there.
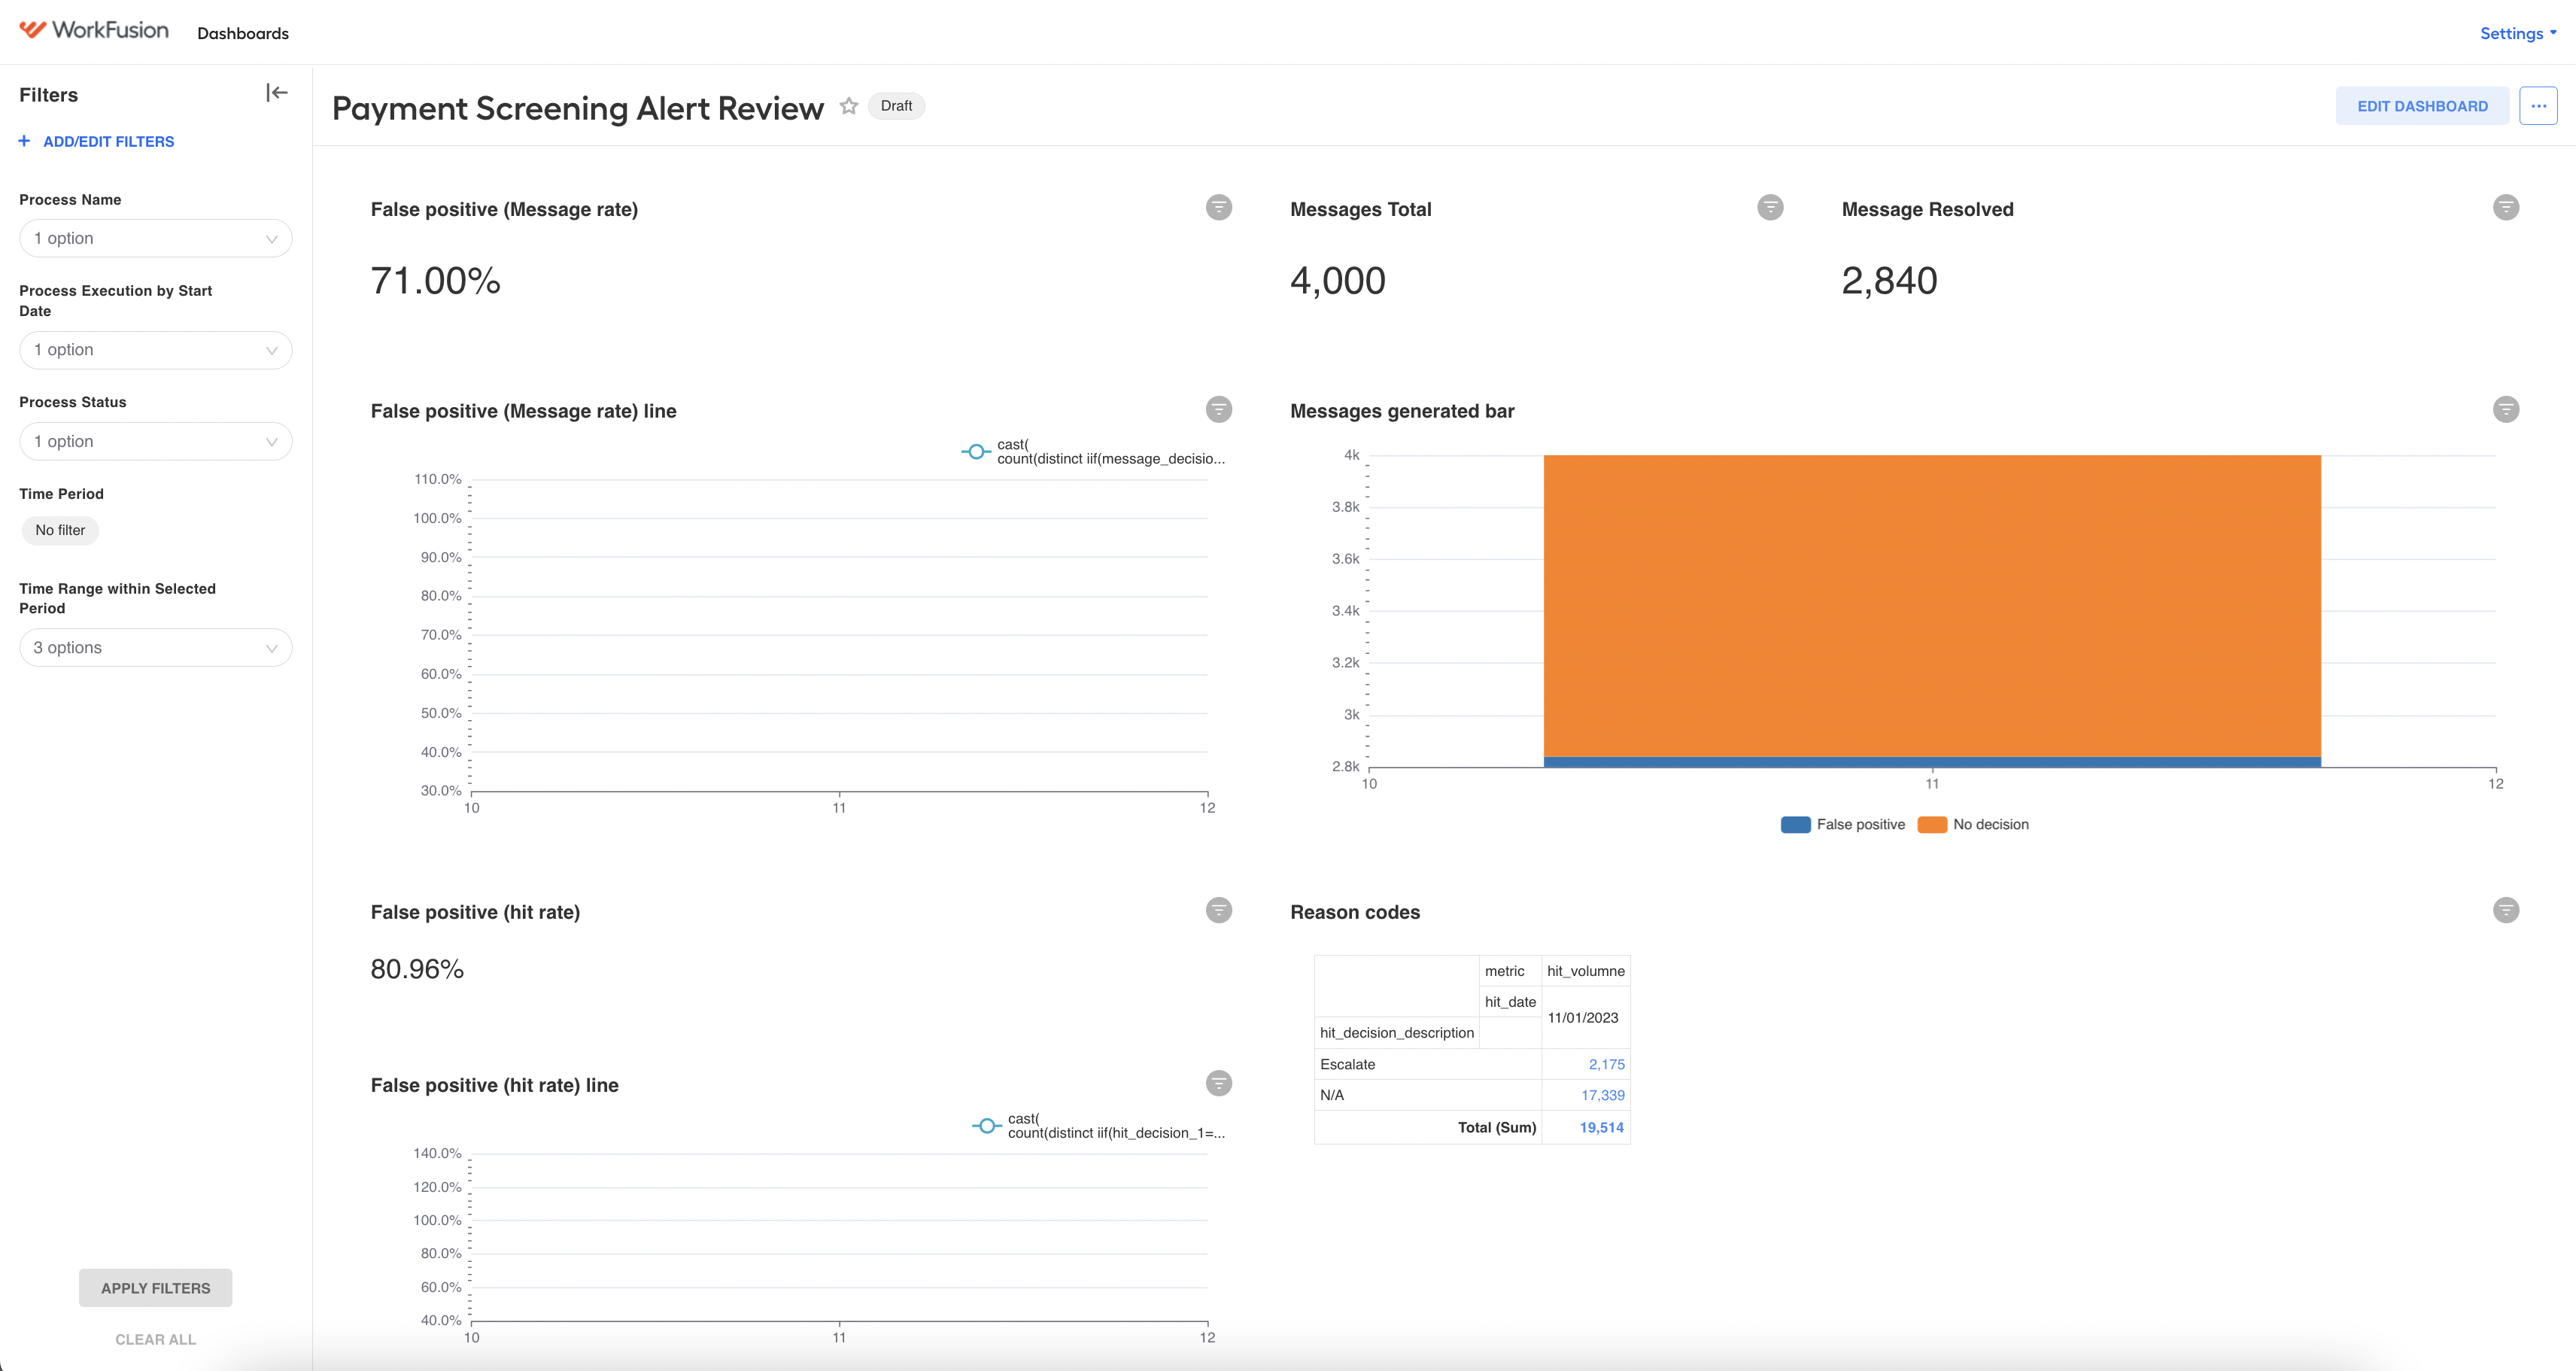
Upon setting up Superset, you can access three dashboards corresponding to the Digital Workers' skills.
Create dashboard
To create dashboards, you must have the admin or editor permissions.
To create a dashboard, set up your database and datasets by following the steps:
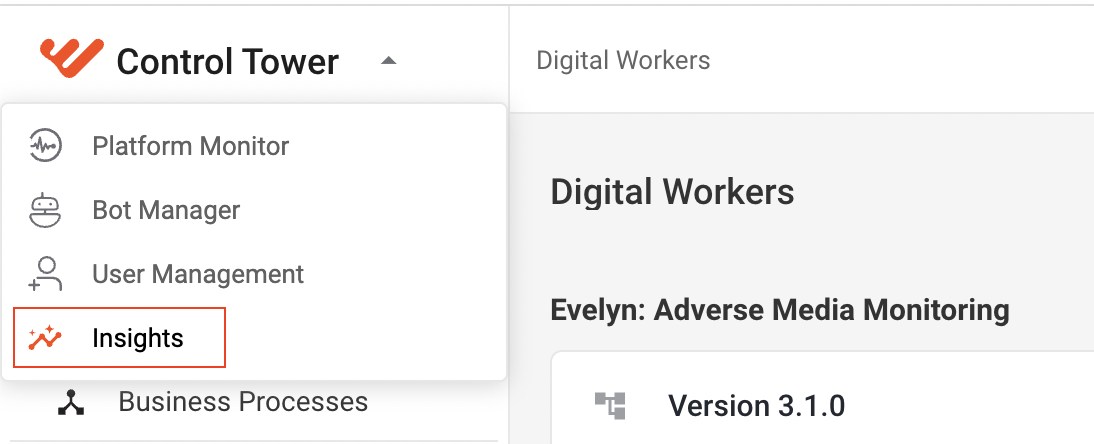
In Control Tower, click the logo in the top-left corner and click Insights. The Superset main screen appears.
Connect to your existing database, or create a new connection:
On the Superset main screen, click Data > Databases.
The Databases tab contains all your established connections to databases.
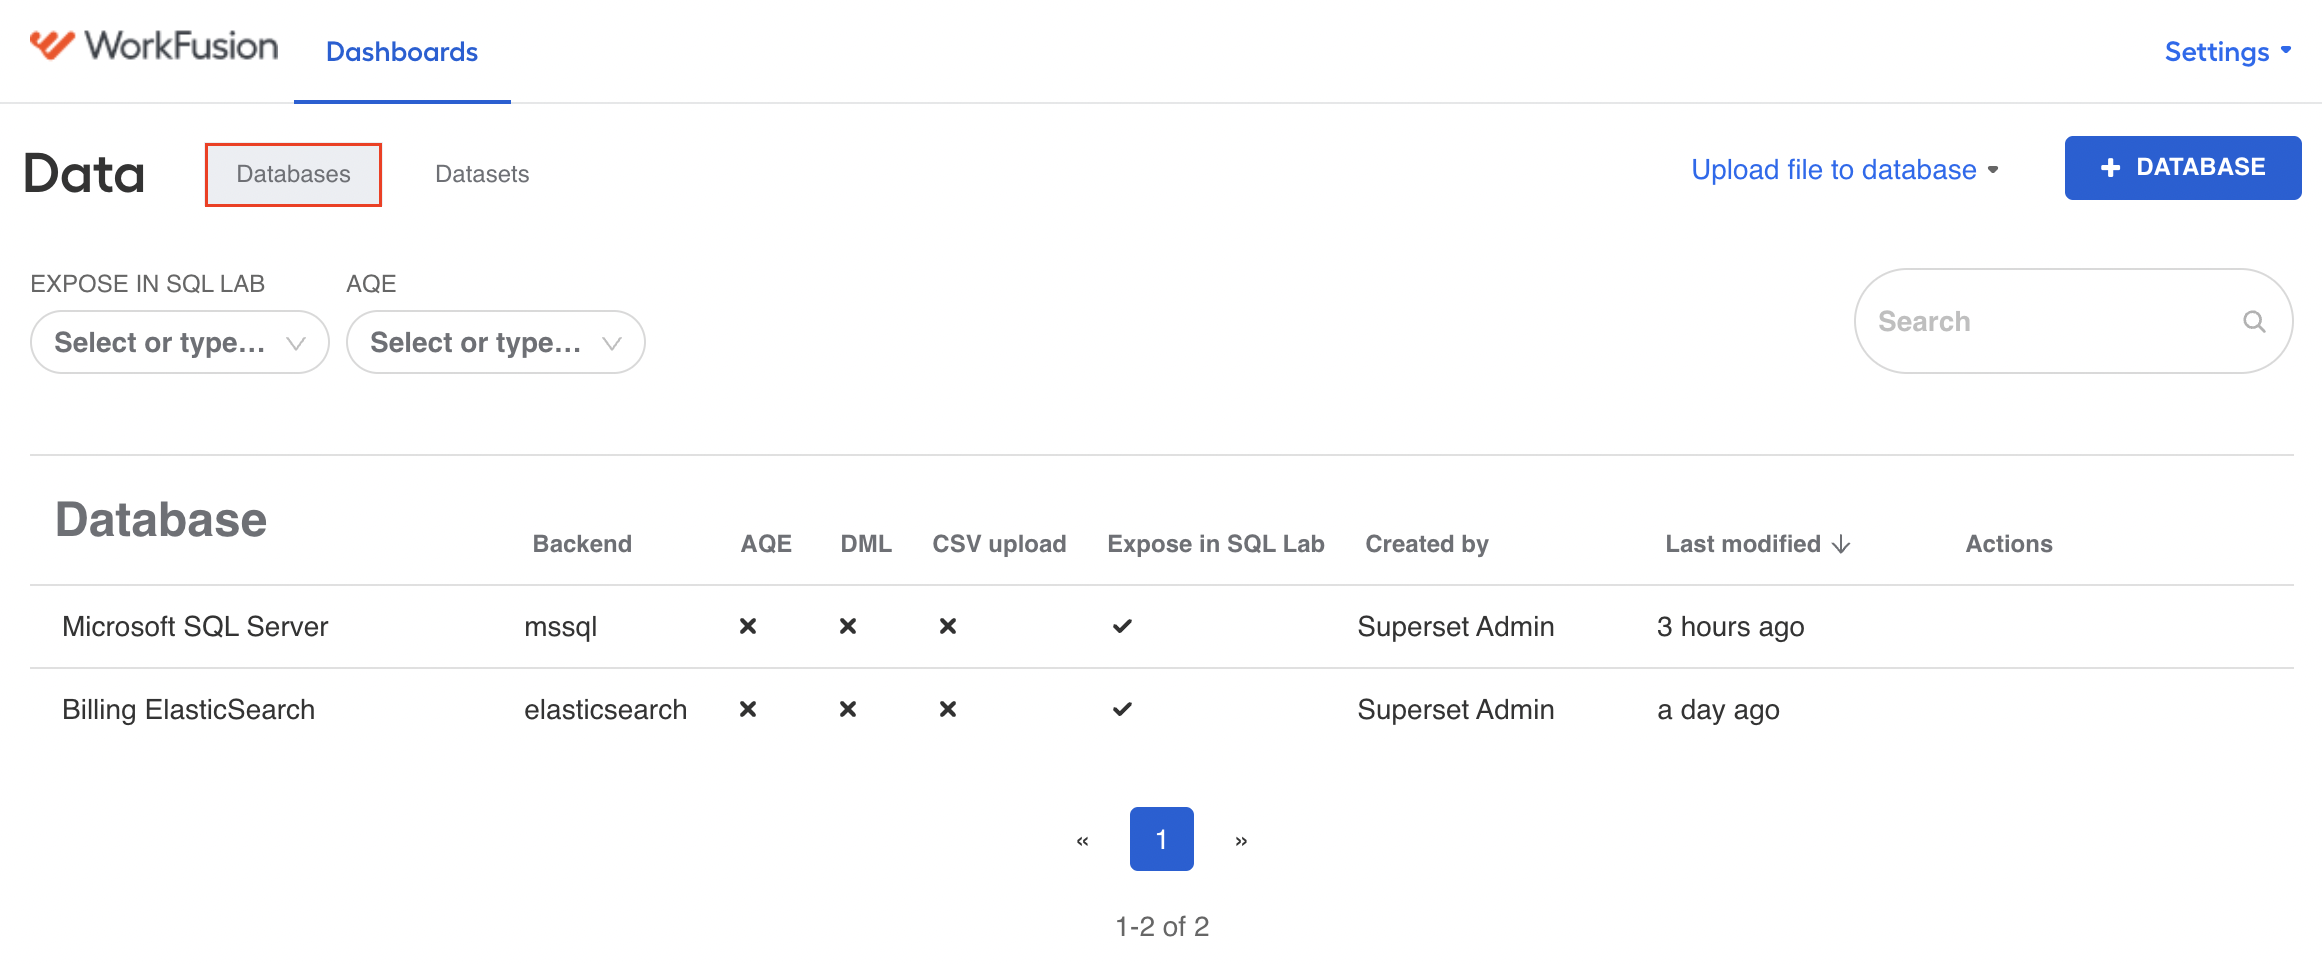
Click the Add Database (+) button to create a new connection.
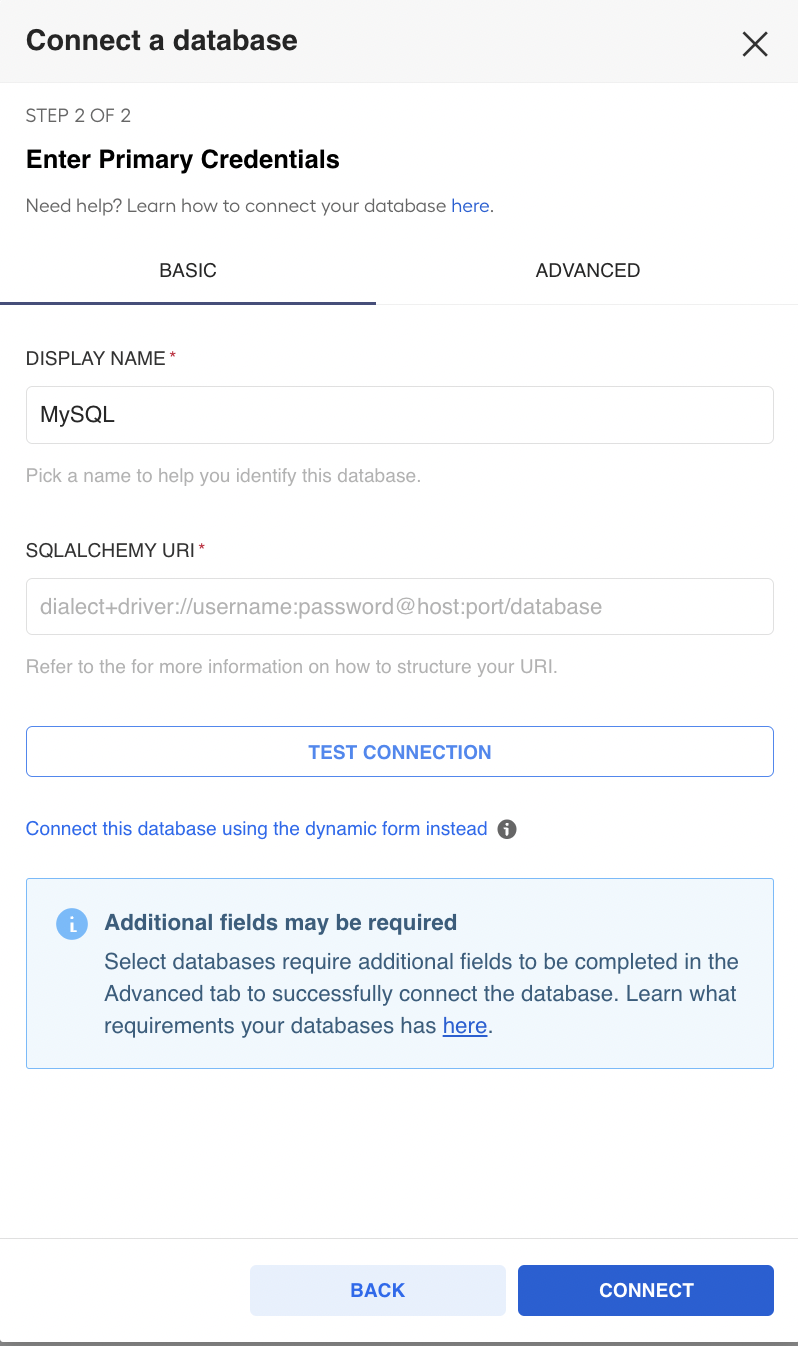
Specify the connection parameters:
- Display name: the name for your database connection to be displayed in the list.
- SQL Alchemy URI: the address of your database.
note
Here, Superset syncs with your deployed Microsoft SQL server and imports data from its tables.
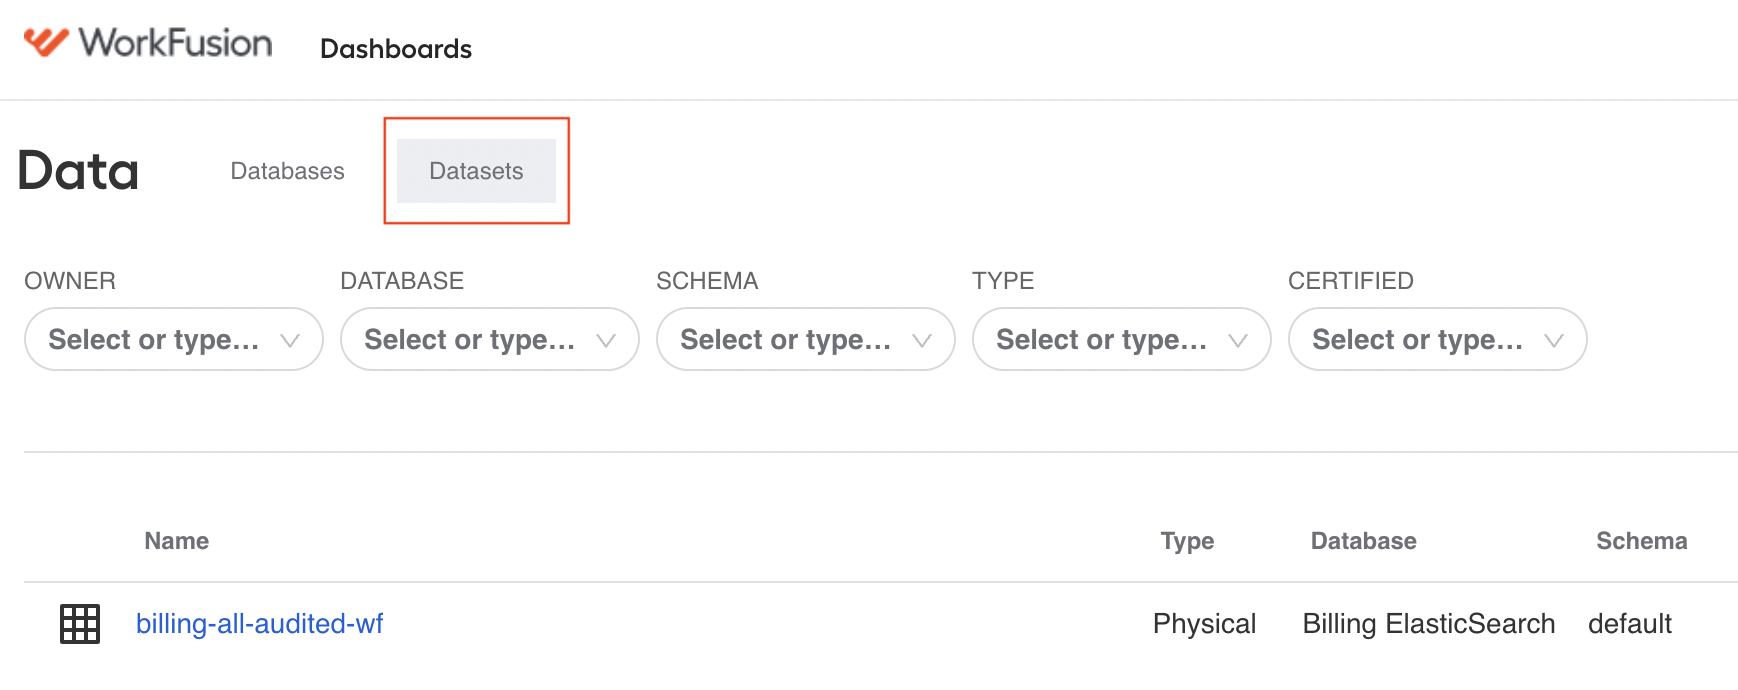
On the Data screen, go to the Datasets tab to find the uploaded datasets available in the connected database.
In the top menu, go to the Charts tab, and click the + Chart button.
warning
If you don't see the Charts or other tabs, ask your administrators to enable it for your user or group.
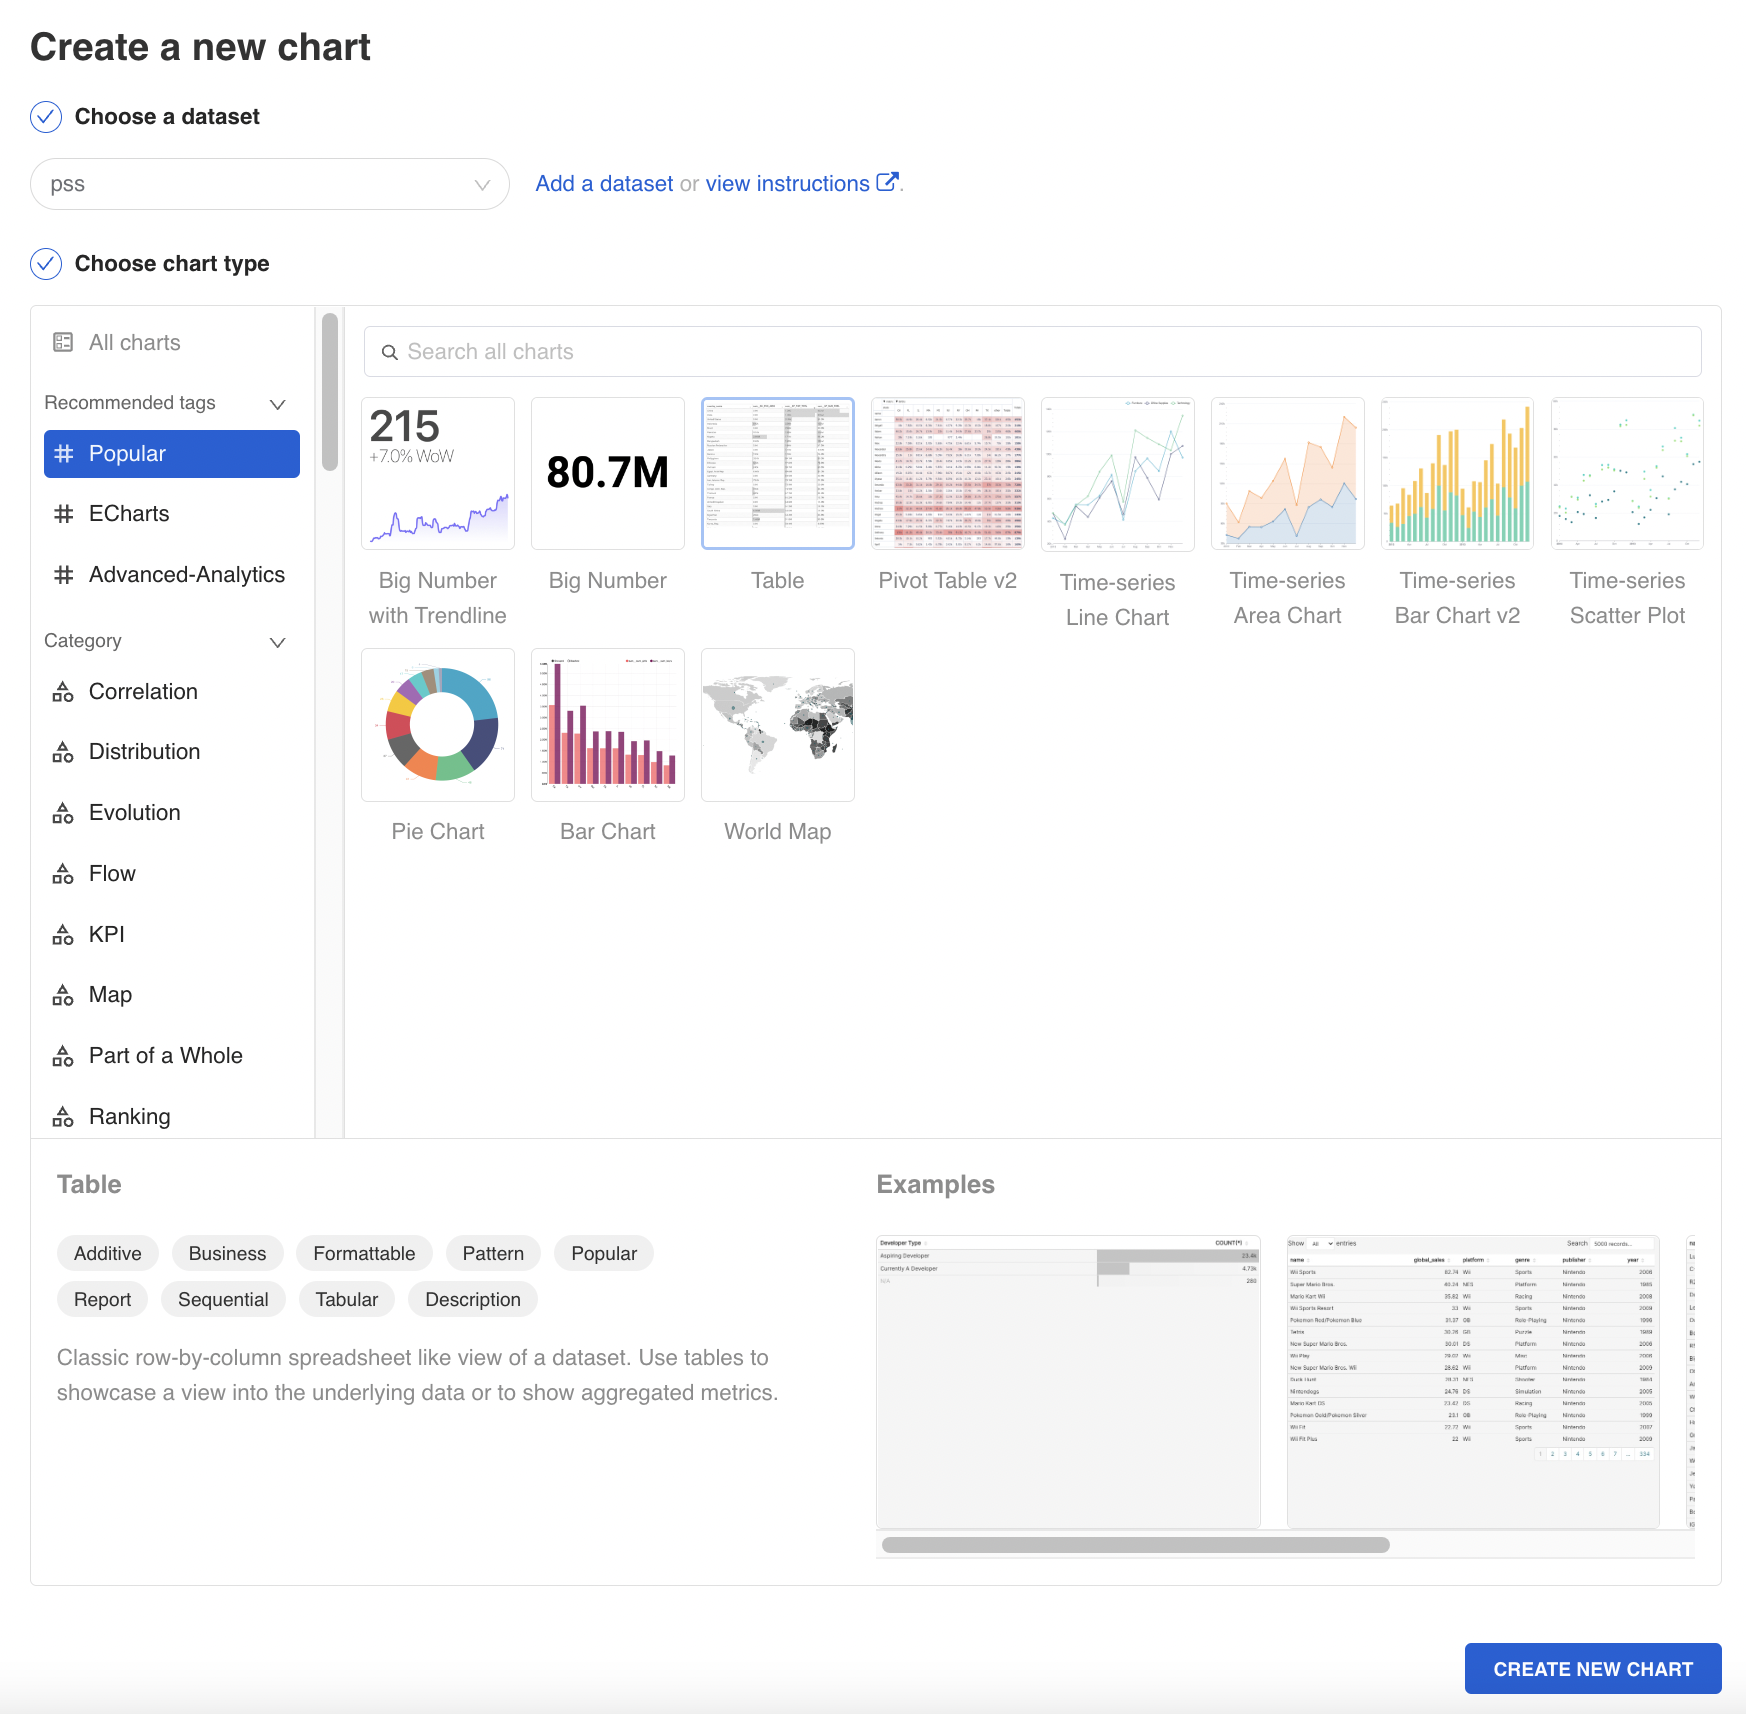
On the Create a new chart screen, specify the parameters for your new dashboard:
In the Choose a dataset box, select a dataset to use in your chart.
In the Choose chart type box, select a required chart from the list, for example, Table.
Click Save. The New Chart screen appears.
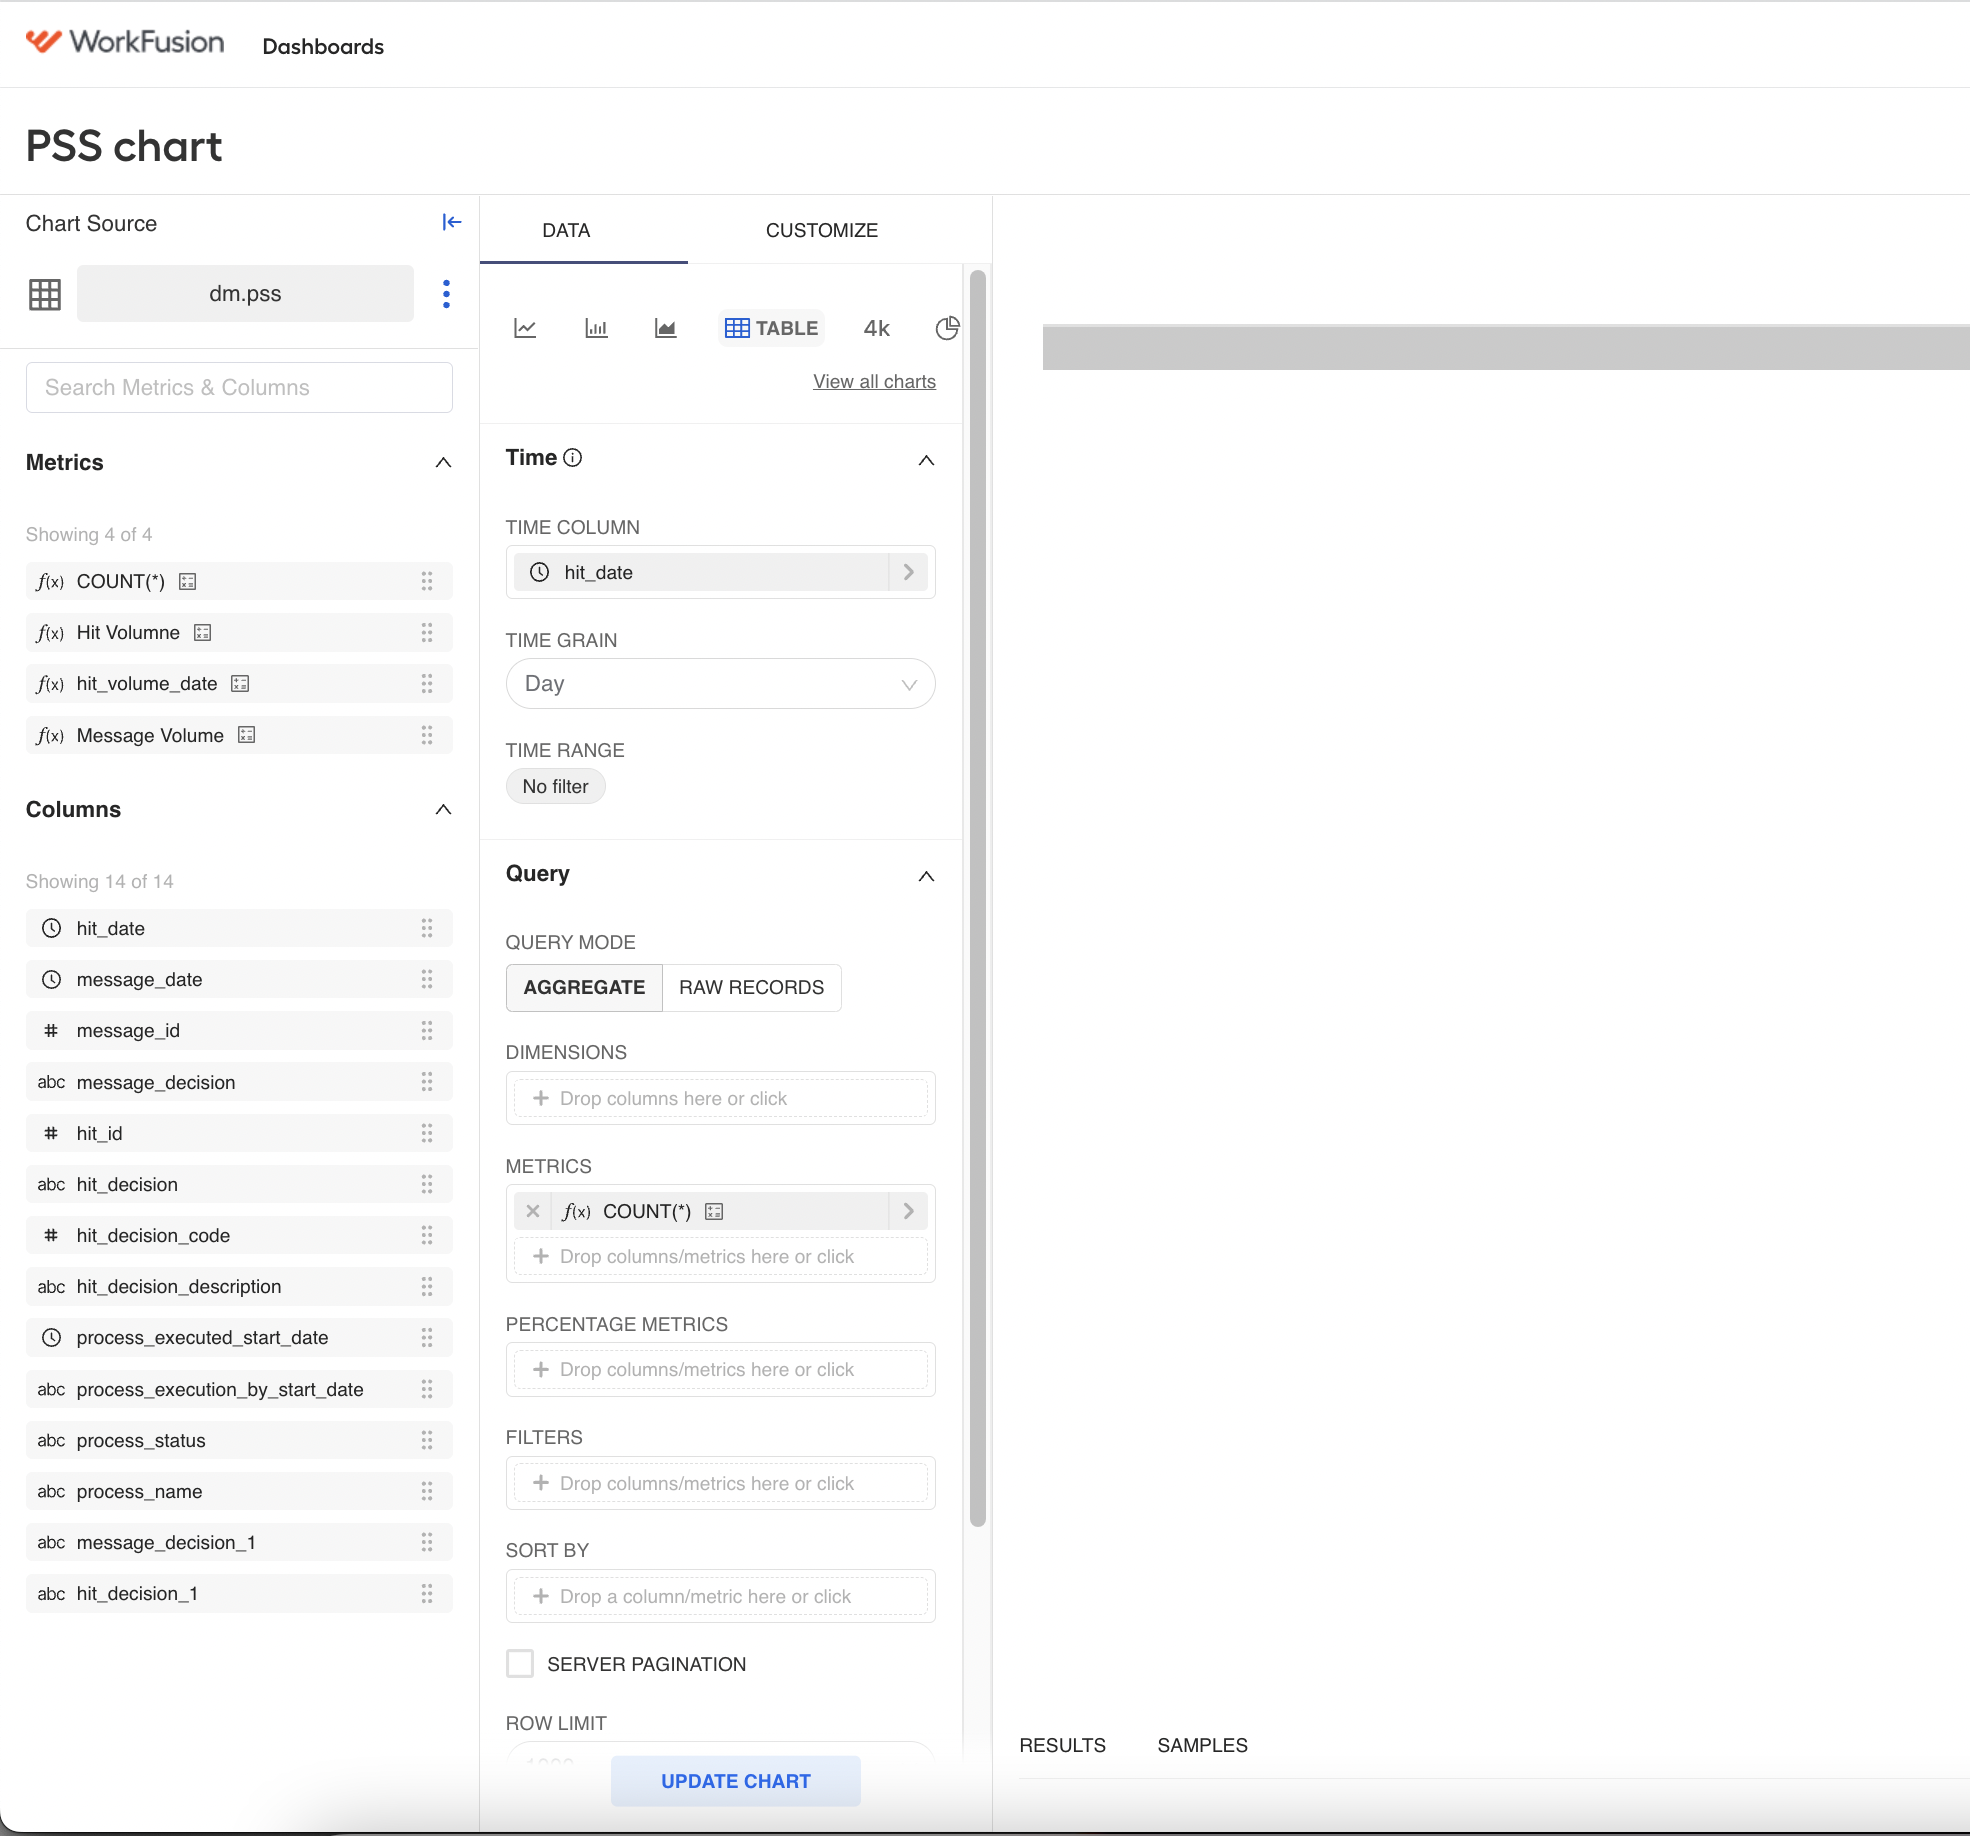
On the Chart screen, specify the parameters of your Query.
note
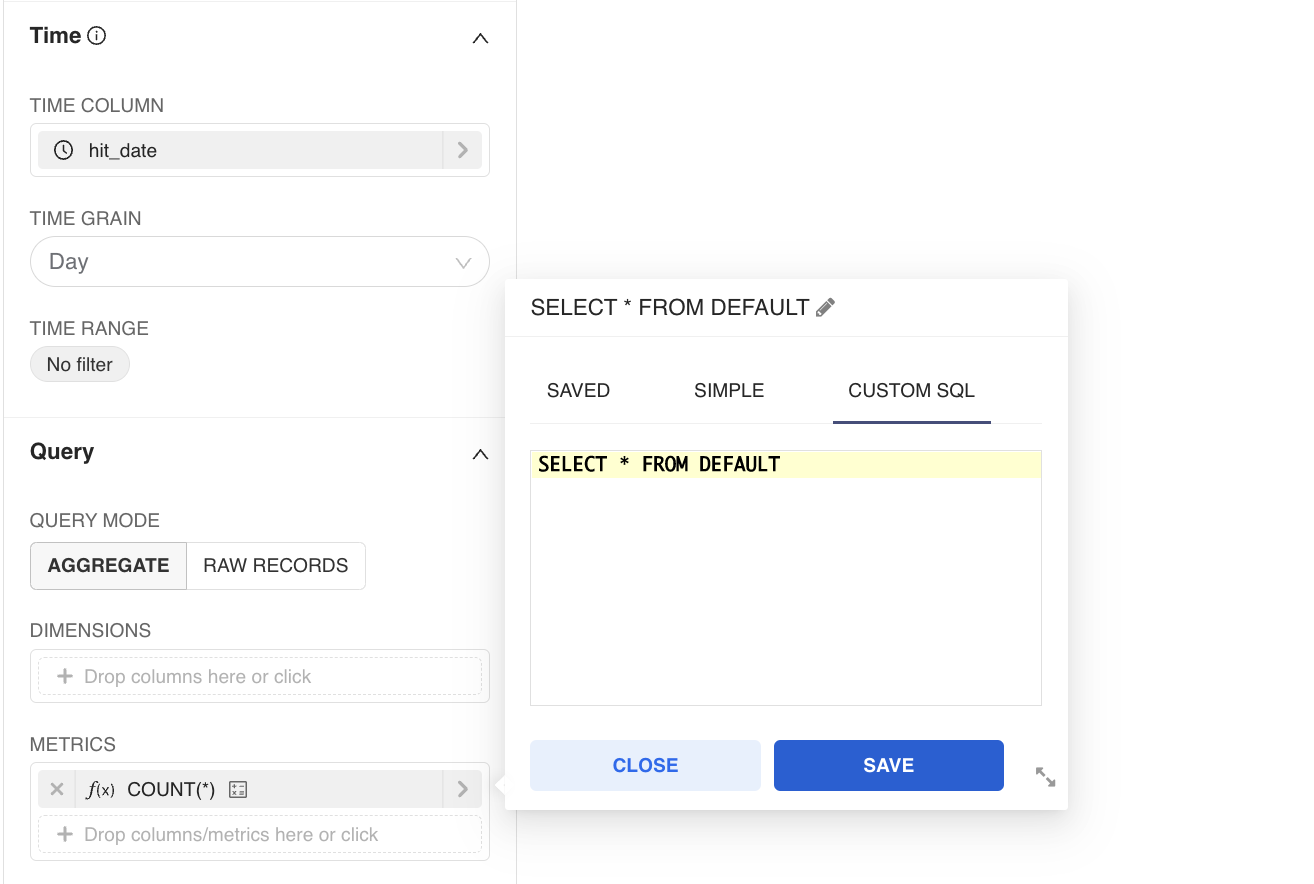
You can write the metrics using common SQL expressions. Also, with your SQL engineers' assistance, you can create complex SQL logic, for example, to integrate multiple tables and join all their datasets.
You can directly connect to the database and run the queries without using a database editor.
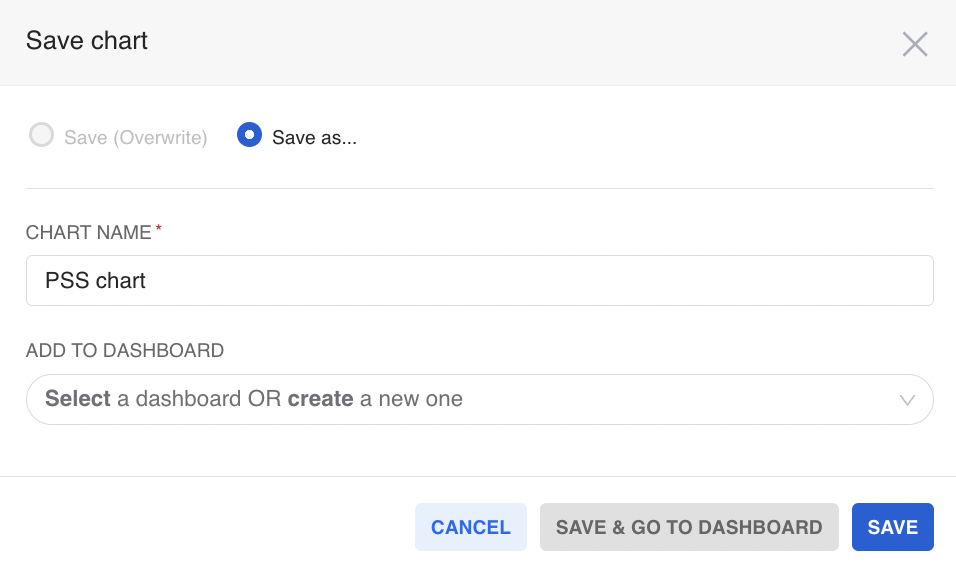
After your chart is ready, click Save:
- On the Save Chart screen, in the Add to dashboard box, select the dashboard where you want it to appear.
- Click Save or Save & go to Dashboard to open your updated dashboard.
On the Dashboard screen, click Edit Dashboard to customize your dashboard. For example, add a header, custom markdown code, additional raws, and other containers.
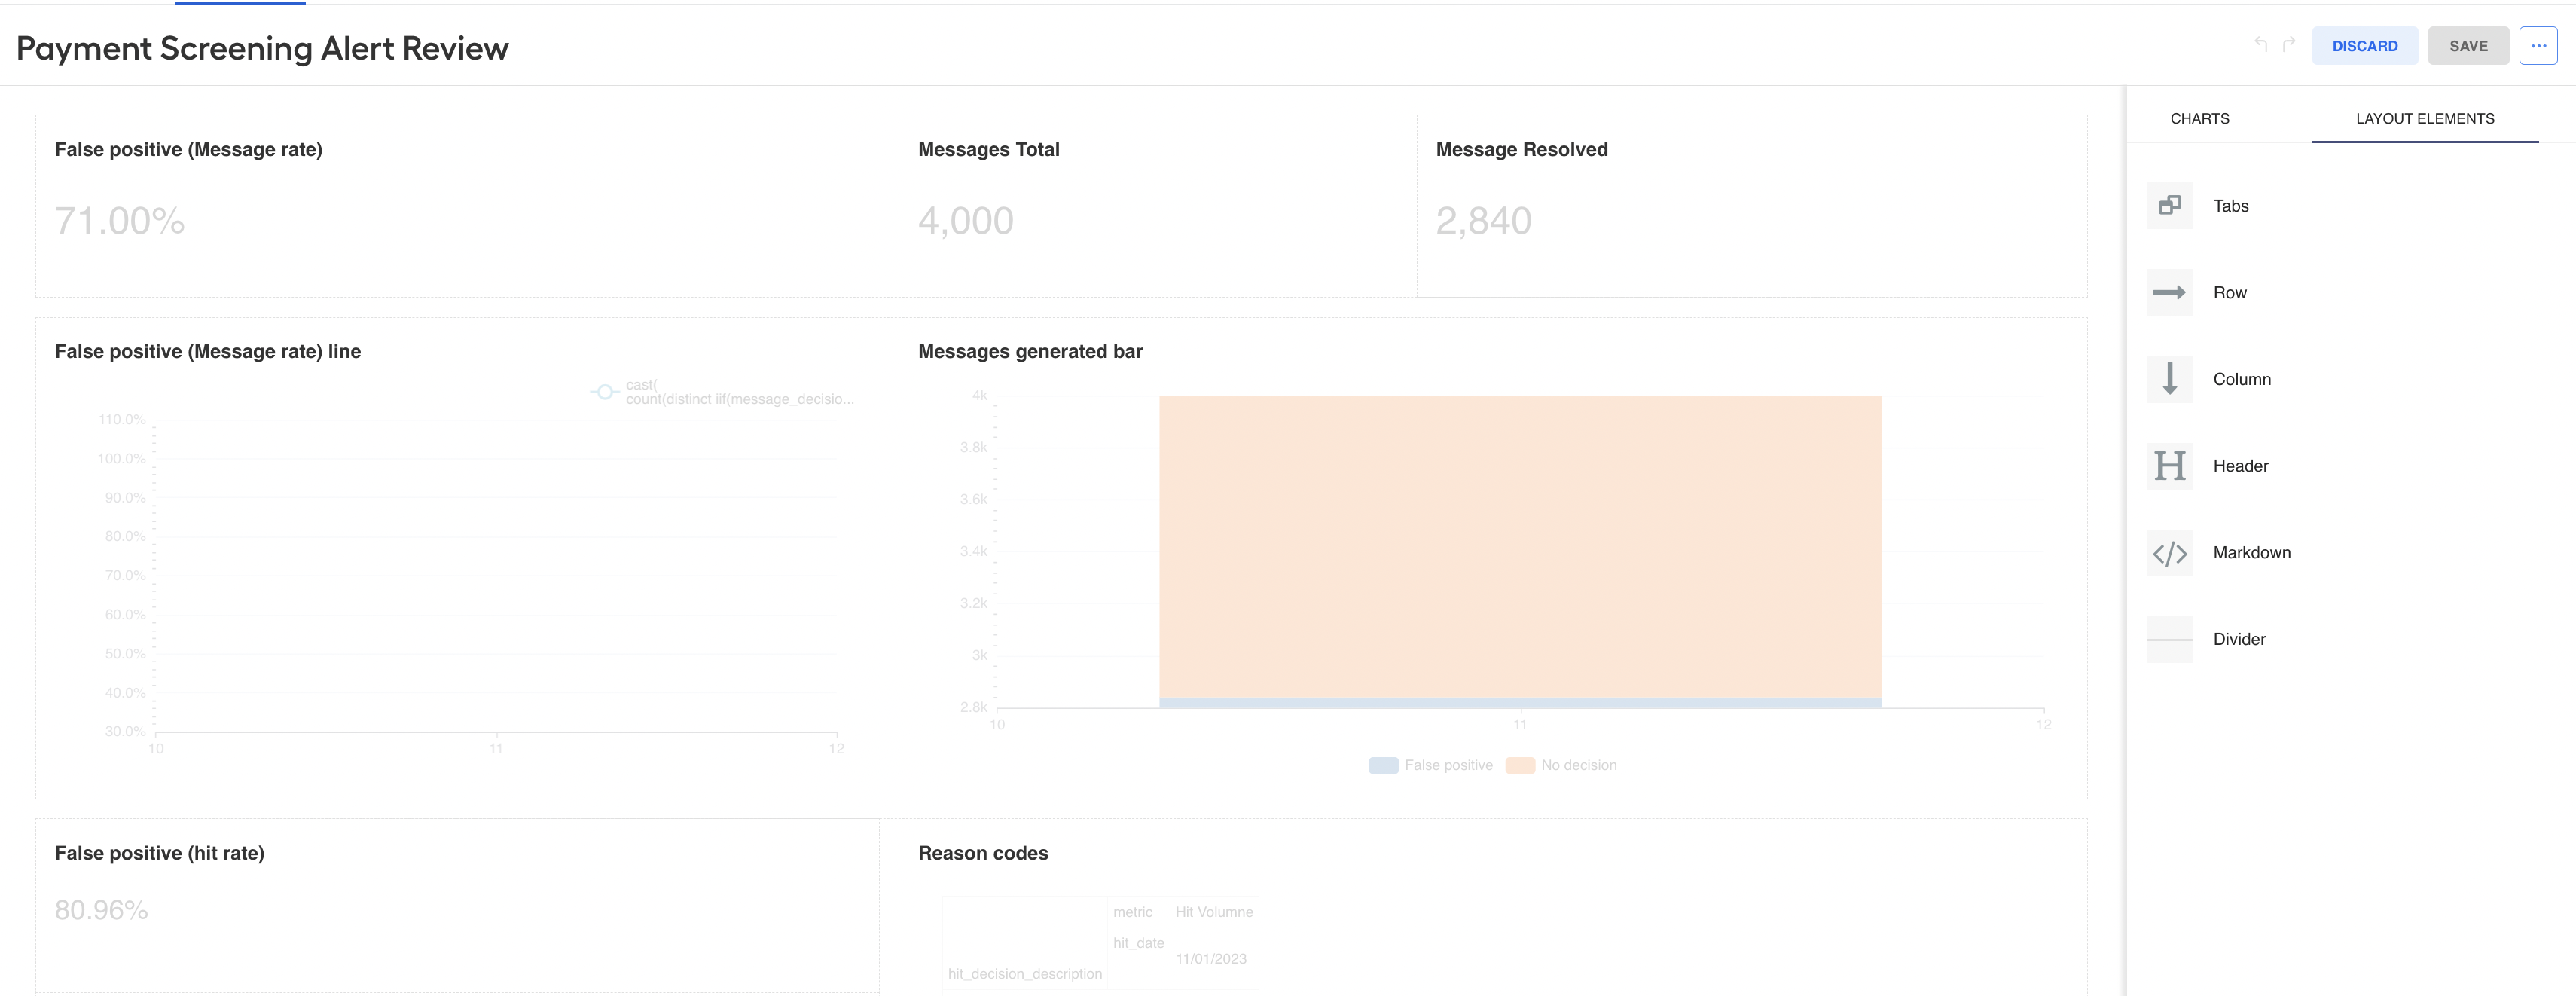
You can also drag the required charts from the Charts tab to form your dashboard and make it display only the required metrics.
After you finish the customization, click Save. The updated dashboard appears in the list under the Dashboards tab.