Analytics overview
WorkFusion Analytics provides you with valuable insights into the performance and health of your business processes.
High-level components
Analytics is based on a data visualization tool that builds dashboards and enables visual graphical analysis and filtering control for them.
In terms of high-level components, WorkFusion Analytics consists of the following:
- Server. Dashboards are published there, and Control Tower takes them from the Server to display on its Dashboard page.
- Desktop. Helps to create new dashboards within self-service BI and customize out-of-the-box dashboards.
Dashboards
The dashboard is a reporting mechanism to aggregate and display metrics and key performance indicators (KPIs). Dashboards help to improve decision-making by revealing and communicating in-context insight into business performance.
A dashboard consists of one or more charts, tables, and numeric metrics. Dashboards are displayed on the main Control Tower page or Dashboard Page.
In addition to out-of-the-box dashboards, you can request on-demand dashboard delivery. WorkFusion also offers training sessions teaching customer users how to create custom dashboards. Refer to the Business Intelligence Analyst course in WorkFusion Automation Academy.
Analytics in Control Tower
To view Analytics dashboards, go to the Control Tower main menu and click Analytics. By default, all visualizations are clustered into the following groups:
- The General group contains all main dashboards. For detailed information on each visualization, see other articles in the section.
- The Use cases group contains visualizations specific to your installed pre-packaged use cases. It can be hidden if you don't have any.
- In the Custom group, you can find your custom dashboards.
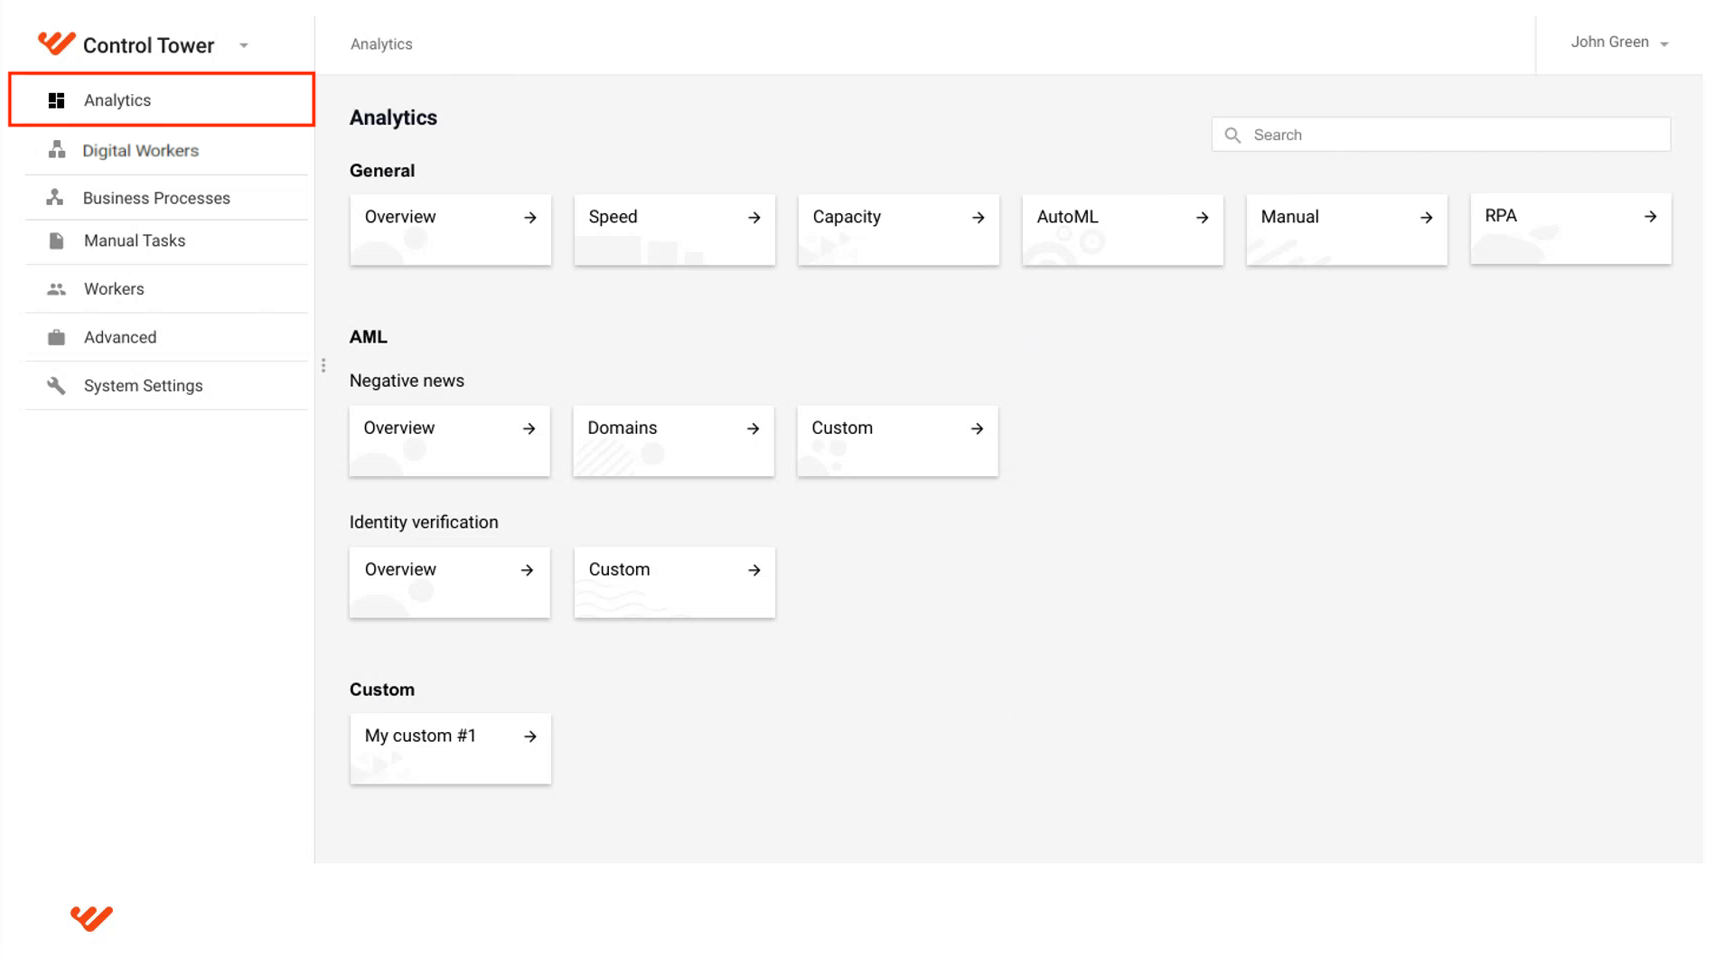
The Analytics menu supports a three-level hierarchy defined by the Tableau Workbook naming conventions. Visually, it can be presented as the following structure:
Analytics/
  ├─ Name category 1/
  │   └─ Subcategory 1/
  ├─ Name category 2/
  │   └─ Subcategory 2/
  └─ Name category 3/
      └─ Subcategory 3/
When developing a workbook and publishing it from Tableau, follow the naming conventions listed below to create the hierarchy:
- Separate each menu level with the _ symbol.
- The full name must not contain any special characters except the + sign. On the user interface, the sign is replaced with blank spaces.
- The en_ prefix is required to define the language and appropriate location.
- The _custom postfix is required to indicate custom dashboards.
Alternatively, you can create the structure directly on the Tableau Server.
The hierarchy levels are optional and there can be one or two group identifiers. The third level is defined by the sheet name for the dashboard.
Examples:
- The "en_Anti+Money+Laundering_Adverse+Media+Screening_Articles_custom.tbw" filename will create the structure: menu Analytics > category Anti Money Laundering > subcategory Adverse Media Screening that contains the actual dashboard. Here, "Articles" is used for the name uniqueness.
- The "en_Identity+Verification_Overview_custom.tbw" filename defines the following structure: menu Analytics > category Identity Verification with the direct link to the Dashboard next to it. Here, no subcategory is created.
You can restrict access to specific dashboards for certain users, groups, or roles. For more information, see Filters for collaborative work.
If you have any questions regarding working with analytics in WorkFusion Intelligent Automation Cloud or any other topics, see Analytics FAQ and reach out to us on the WorkFusion Forum.
Licensing
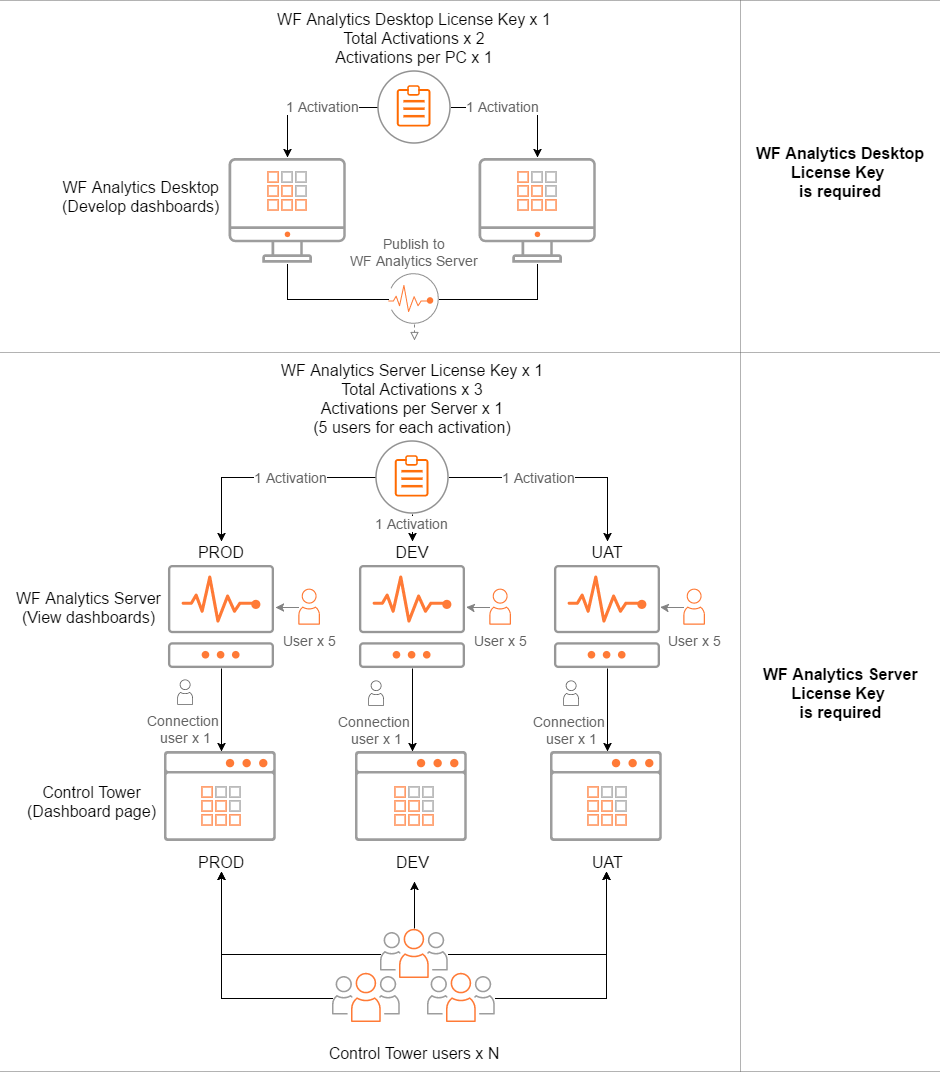
To work with WorkFusion Analytics, you need the following:
Desktop License Key is available for 2 activations—1 activation per PC. You can use it only for WorkFusion Analytics Desktop (not Tableau).
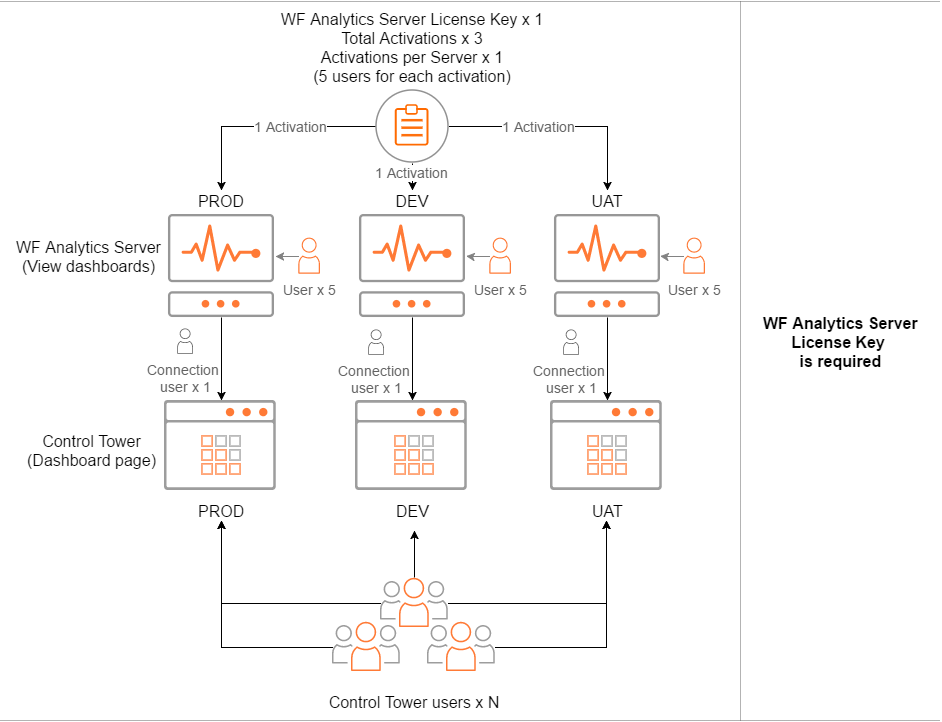
Server License Key is available for 3 activations—1 activation per server (supposing you are using the same key on Dev, UAT, Prod environments). You can use it only for WorkFusion Analytics Server (not Tableau).
Each activation provides access to the WF Analytics Server web application for 5 WF Analytics Server users. One of the five users is intended for the Analytics-Control Tower integration. Supposedly, you will not need more than five WF Analytics Server users to view and interact with dashboards in the application. Thus, one Server License Key is enough.
To view dashboards in Control Tower, only one Server License Key is required. If Analytics is enabled in Control Tower, any CT user can view dashboards, and the number of such viewers is unlimited.
Below, you can see license usage schemes for the following cases:
OOTB Tableau-based dashboards
OOTB Tableau-based dashboards with the development and customization option