Activate alerts
You can monitor the system status with the ELK-based alerting system that allows checking the status of system components and server indicators and notifying the administrator in case of a problem. Alerting lets you define rules to detect complex conditions within different Kibana apps and trigger actions when those conditions are met. You can find more details in the official elastic documentation (https://www.elastic.co/guide/en/kibana/current/alerting-getting-started.html).
Work.AI also includes several pre-configured alerts:
- BI license usage: notifies about the expired Analytics license has expired and reminds to renew it.
- Certificates expiration: checks your
ca.crtandserver.crtcertificates and notifies you if any of them are about to expire. - Datapurge full cannot keep up: notifies if the database data management procedure (database cleanup process) for all tables failed to complete multiple times within the configured timeframe.
- Disk I/O threshold reached: checks disk performance, that is, how long the disk is processing I/O operations. Notifies you when the load is above 80%.
- Disk space threshold reached: monitors used disk space and notifies you if more than 80% is used.
- Host CPU usage: monitors CPU usage and notifies you if it's over 80%.
- Host memory usage: monitors RAM usage and notifies you if more than 85% is used.
- Java out of memory heap space: controls the use of RAM allocated for Java and tells you when memory is running out.
- Java out of memory metaspace: warns you when the amount of native memory allocated for Java class metadata is exhausted.
- Marathon deployments: warns you that the maximum number of Marathon deployments has been reached.
- Marathon disconnected from mesos: warns you when marathon-mesos communication issues are observed.
- NFS mount: notifies if there is a problem while mounting NFS drives.
- Nginx cert verify: notify if there is a problem with Nginx upstream SSL certificates validation.
- OCR license threshold: warns if the remaining number of pages to be processed according to the current OCR license is below the warning threshold.
- Rabbitmq channels: warns if the number of Rabbitmq channels is above the threshold or over 1800 channels.
- Service down: notifies if any of the services supervised by the supervisor go into the downstate (only for the non-HA mode).
- Active-active service down: notifies if any Active-Active services go into the downstate on at least one of the master servers (only for the HA mode).
- Supervisord restart: warns if the Supervisor service, which manages all Product services, has been restarted.
Additional pre-configured alerts for the high-availability mode notify you about failed services on all Master nodes:
- Automl model management service down
- Automl model service down
- Bot manager service down
- Nexus service down
- SQC service down
- Task dispatcher service down
- Worker management service down
- Workfusion service down
- Workspace service down
Activate alerts
To receive notifications from ELK, configure alerting:
On your main installation server, in the directory with the installation package, edit
config.yml.$ cd /opt/workfusion/wf_installer
$ ./install.sh edit_config INSTALLATION_SERVERTo enable email and Slack notifications, set the
alerting_email_enabledandalerting_slack_enabledparameters toTrue, and change other parameters. All ELK alerts are already pre-configured.alerting_enabled: true # leave this value as true, even if you don't need any notifications to be set up. This will allow you to collect all alert events in the internal index for potential troubleshooting.
alerting_email_enabled: false
alerting_email_account: 'standard' # Supported values: 'standard', 'outlook', or 'gmail'. If you are using Gmail or Outlook, applying the corresponding profile is recommended. Use the standard profile if you are using another email system.
alerting_email_from: 'sample@sample.local' # Email address FROM which alerts will be sent
alerting_email_to: 'ops@org.local' # Email address TO which alerts will be sent
alerting_email_auth_enabled: 'true'
alerting_email_host: 'smtp.example.local' # Your SMPT server (e.g. smtp.gmail.com, smtp.office365.com, <your exchange server>)
alerting_email_port: '587' # Port of your SMTP server
alerting_email_server_secure_connection: 'true' # Whether or not secure connection is used
alerting_email_username: 'sample-username' # SMTP username of your email account (FROM which alerting emails will be sent)
alerting_email_pass: 'sample-password' # SMTP password of your email account (FROM which alerting emails will be sent)
alerting_slack_enabled: false
alerting_slack_hook: 'https://hooks.slack.com/services/xxx/xxx' # Your slack webhook used for integration. The Slack admin should configure it for your slack account before installation in https://my.slack.com/services/new/incoming-webhook. Refer to https://www.elastic.co/guide/en/elasticsearch/reference/current/actions-slack.htmlTo enable alerts, on the installation server, run the following commands:
By default, executing ./install.sh alerting_enable does not overwrite existing alerts. That was done intentionally not to wipe any custom configuration performed with rules. But, if it is OK to lose any customizations, and the goal is to batch-modify all existing rules (for example, add a new notification channel - slack), the additional parameter -e overwrite_alerting_rules=true can be passed to the ./install.sh script. This recreates all OOTB rules from scratch, considering configuration parameters in the config.yml file.
Pay attention, if any custom connectors or fields were added to rules, they will be destroyed.
- Standard setup
- Multipoint setup
$ ./install.sh alerting_enable kibana
$ ./install.sh alerting_enable kibana -c local
Deactivate alerts for false-positive errors
Sometimes the condition under which the alert is triggered is acceptable in exceptional cases or doesn't have the highest priority to be mitigated. Nevertheless, the alert remains active and sends notifications over a specified period, which can be confusing.
To prevent this, deactivate notifications for a specific alert rule:
In the Kibana Settings panel, go to the Stack Management.
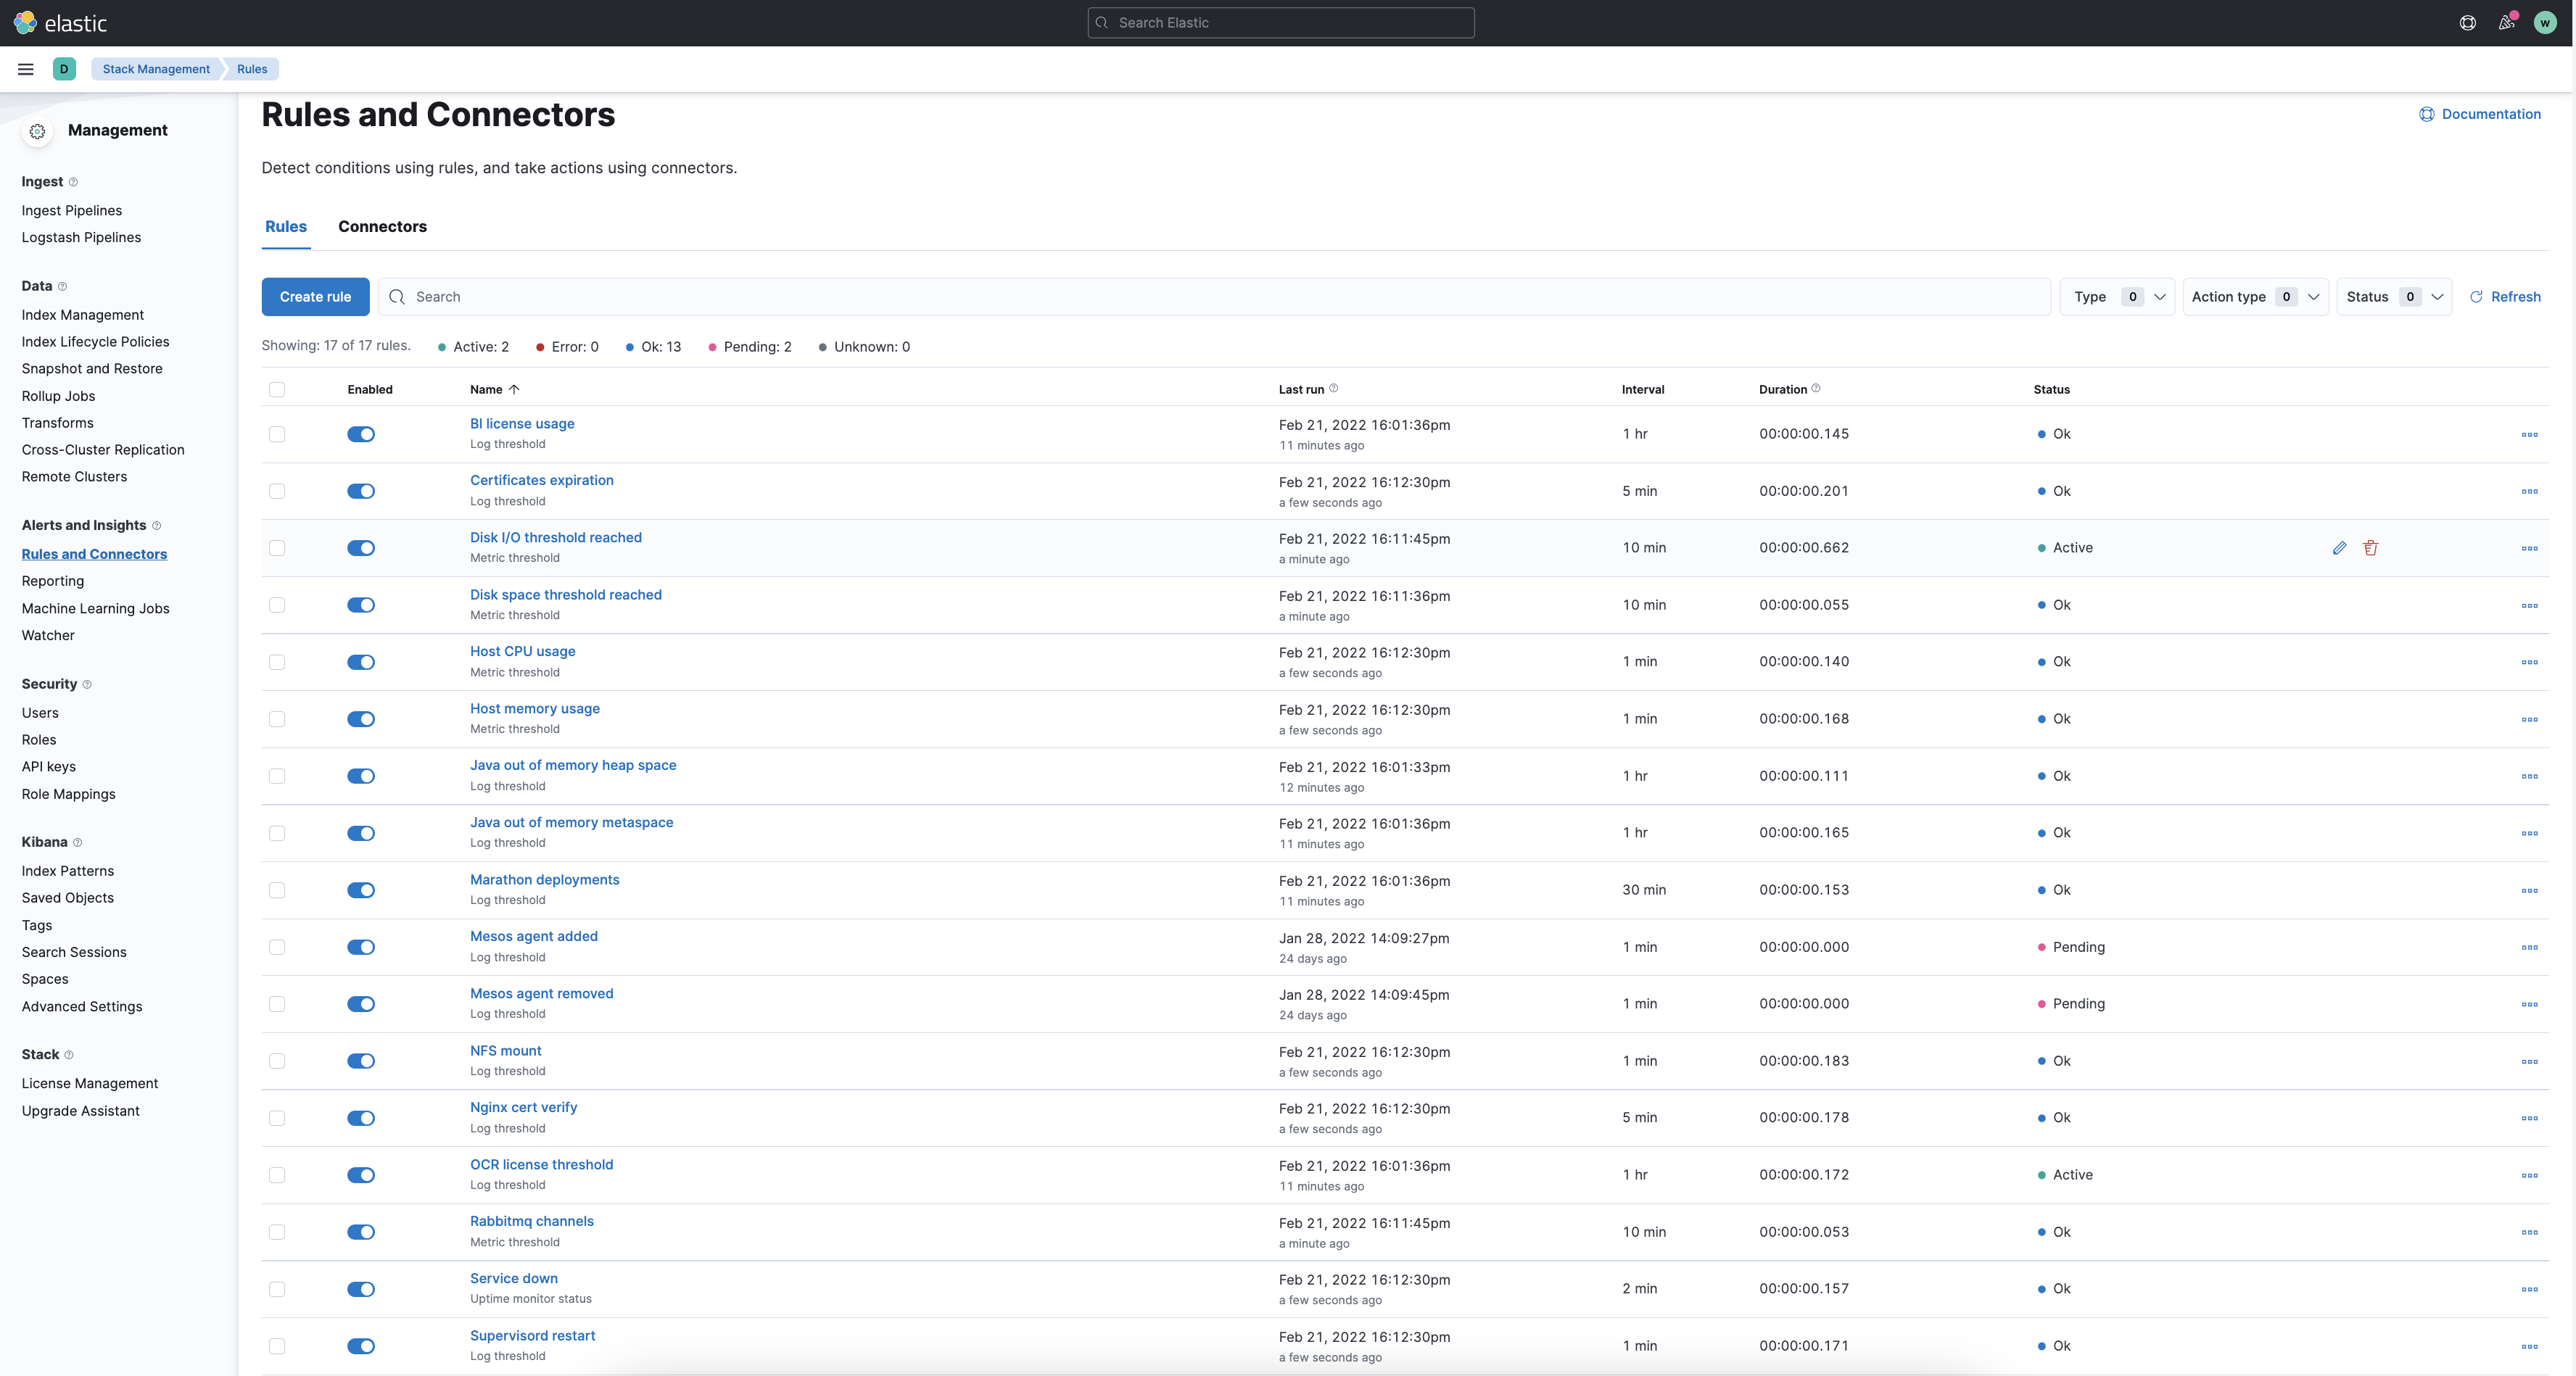
In the Settings menu, select Rules and Connectors.
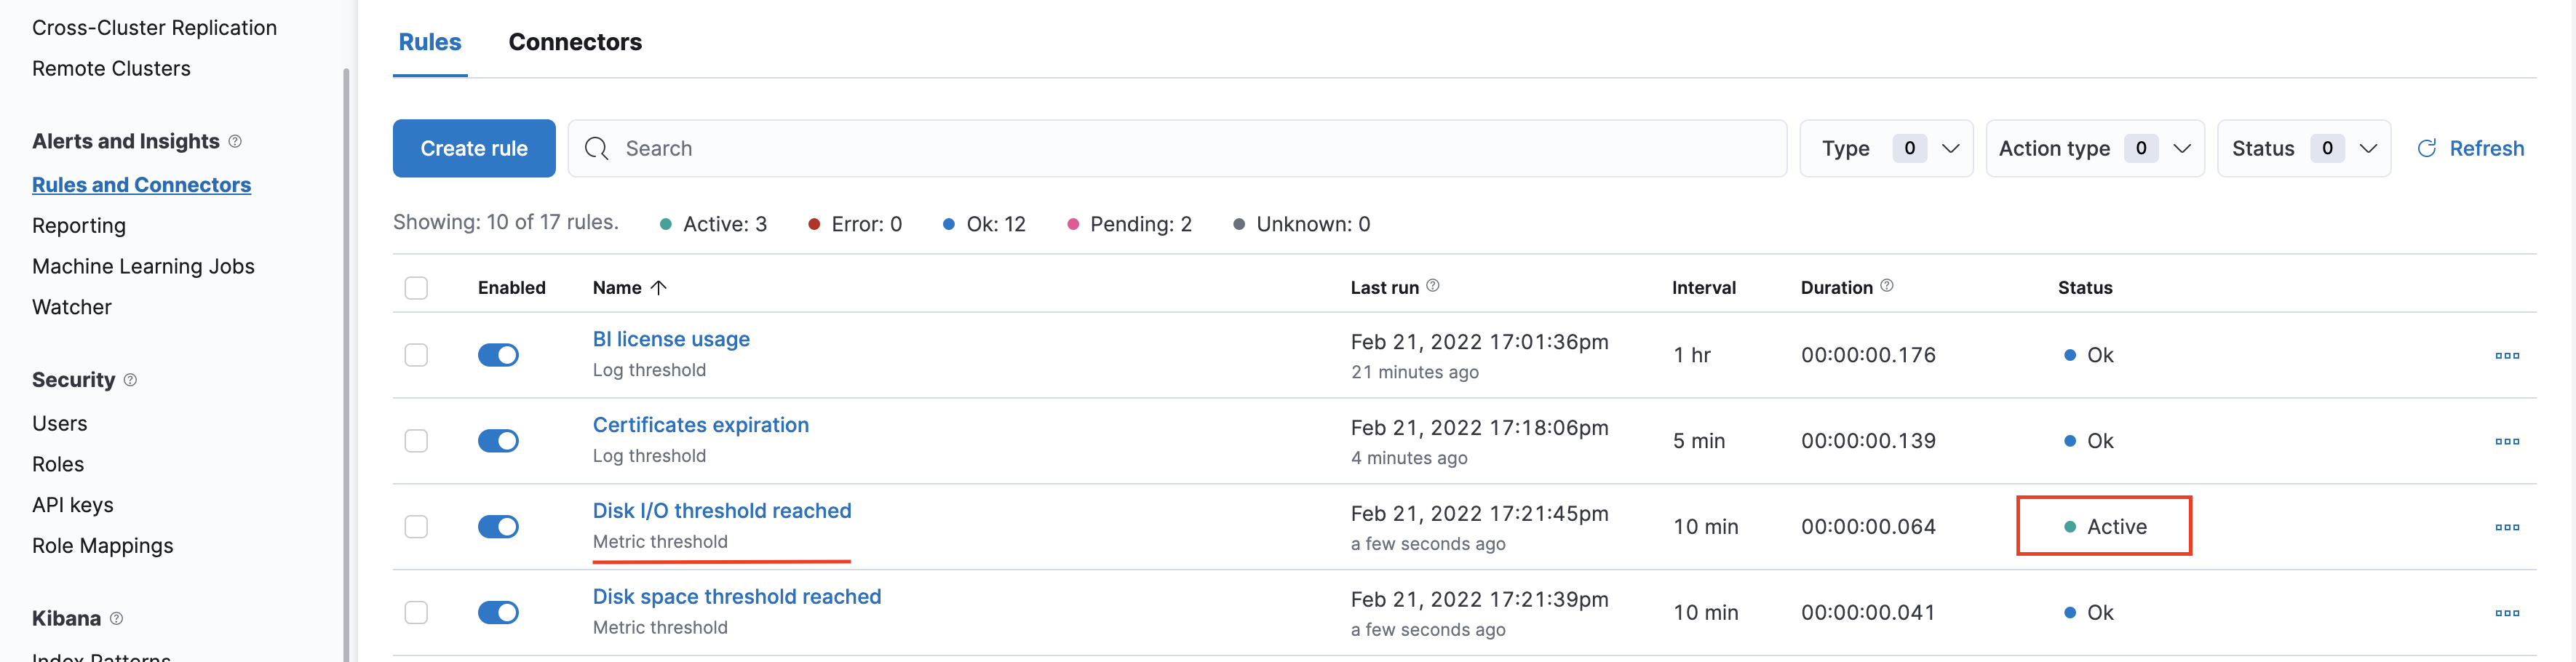
Select the alert rule you need; it must be in the active state.
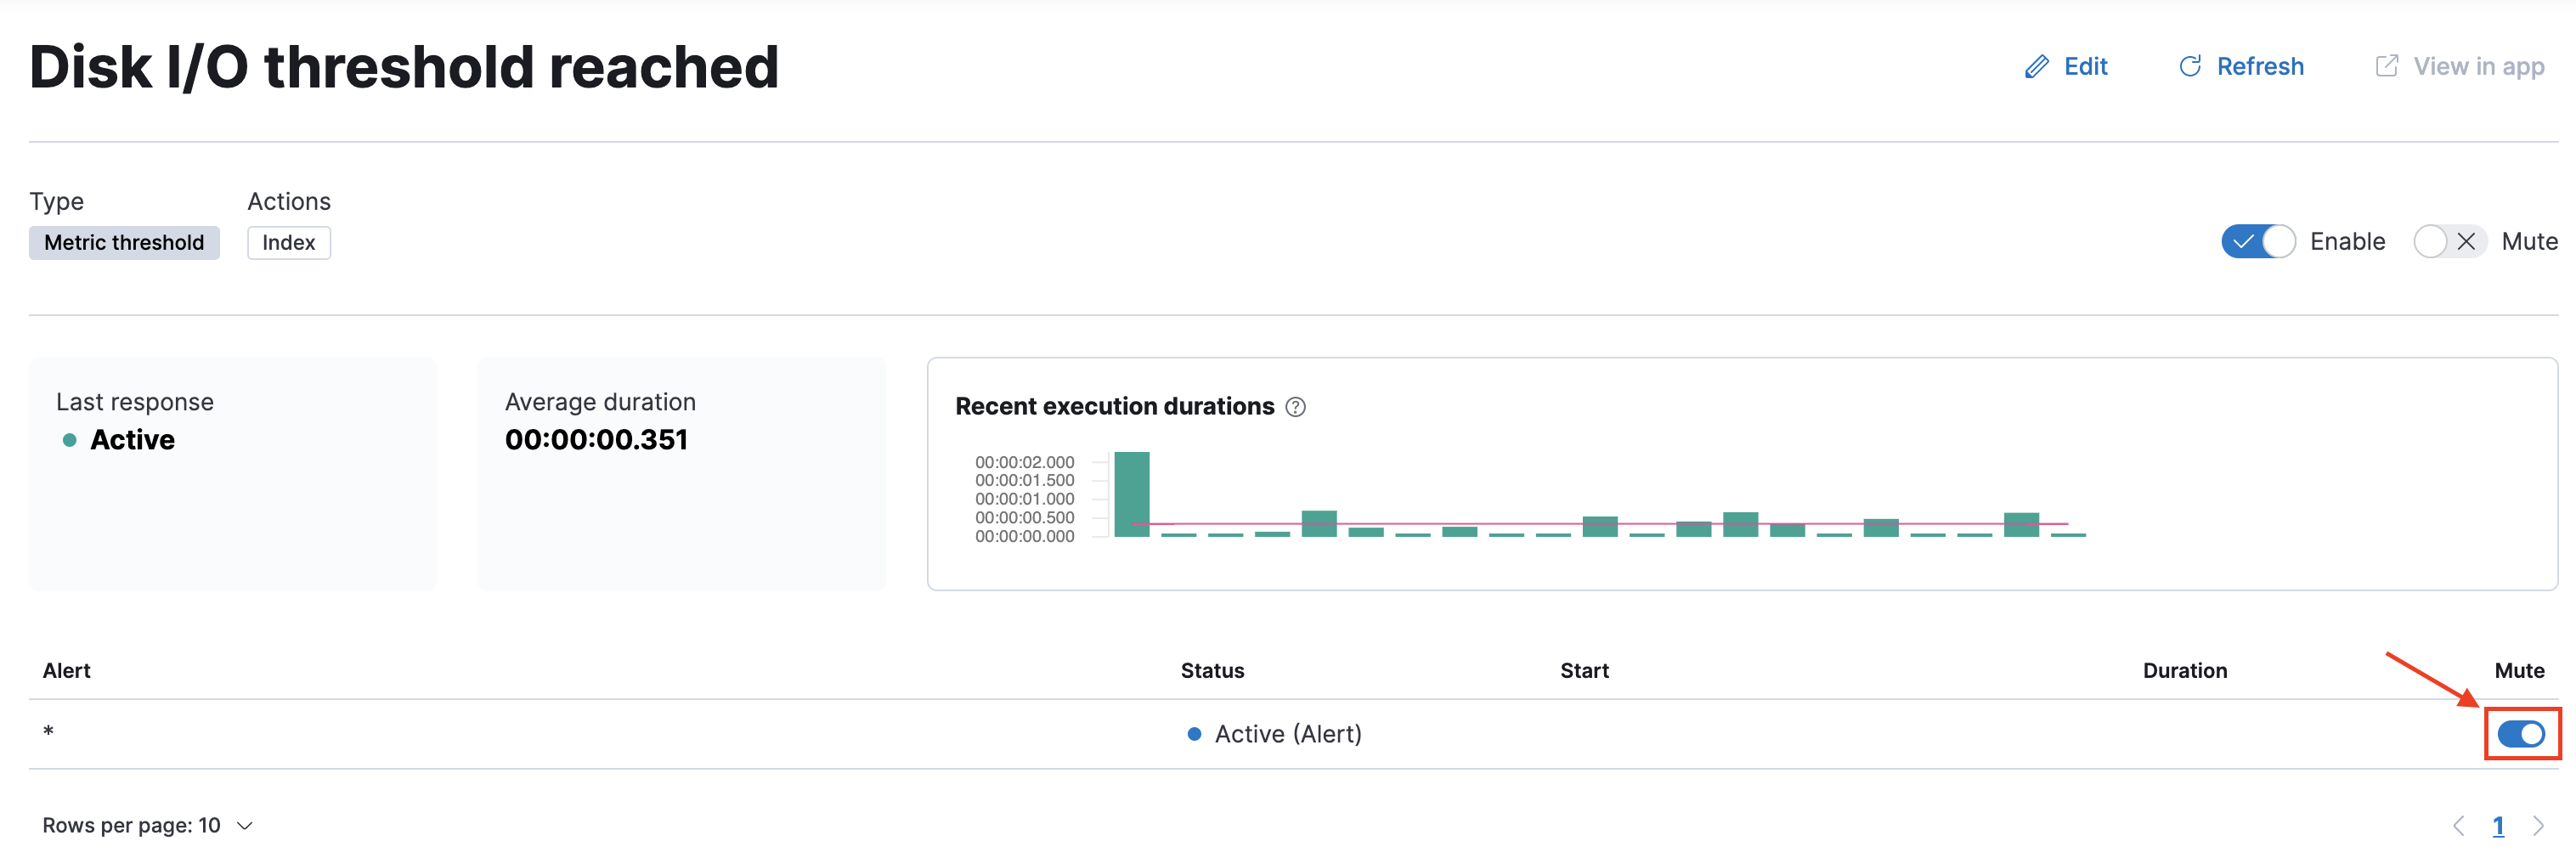
For the alert in the active state, toggle Mute.