Analyze and improve model
Input: Generated CSV file with results of IE process.
Output: Trained model properly tuned to meet the required success criteria.
After splitting the dataset into training and test sets, the Data Analyst together with the ML Engineer launches model training, and after that runs Information Extraction / Classification on a test set.
Make sure the input file provided for extraction includes the following information:
- Column with links to the original documents
- Column with links to the OCRed documents
- Column with labeled text (as XML content)
This is important since this information will be used in the next step: statistics calculation.
When uploading a file for extraction, you may see a notification that names of the columns in your file don't match what was pre-defined in the Manual Task or the Business Process. There will be an option to map columns. Click on "Match columns" and map columns from your input file with columns in this Task or Process.
After Model Execution on the test set (123 documents), as output we get a file containing all the information from the input file and also a column with extracted text (as XML content).
Now, when we have a consolidated file with gold and extracted values, it's easy to run a Business Process Statistics aggregation v2.0 to get detailed information as well as accurate statistics per field.
Running statistics aggregation BP
Now you need to run a statistics aggregation BP, for instructions see this document.
Note, that instead of going to the Results tab in step 5 you need to go to S3, find the corresponding bucket, folder and download the Excel file with statistics.
Analysis of results
After running the Statistics Aggregation Business Process on 123 documents, we get the following file with the results.
Raw Data
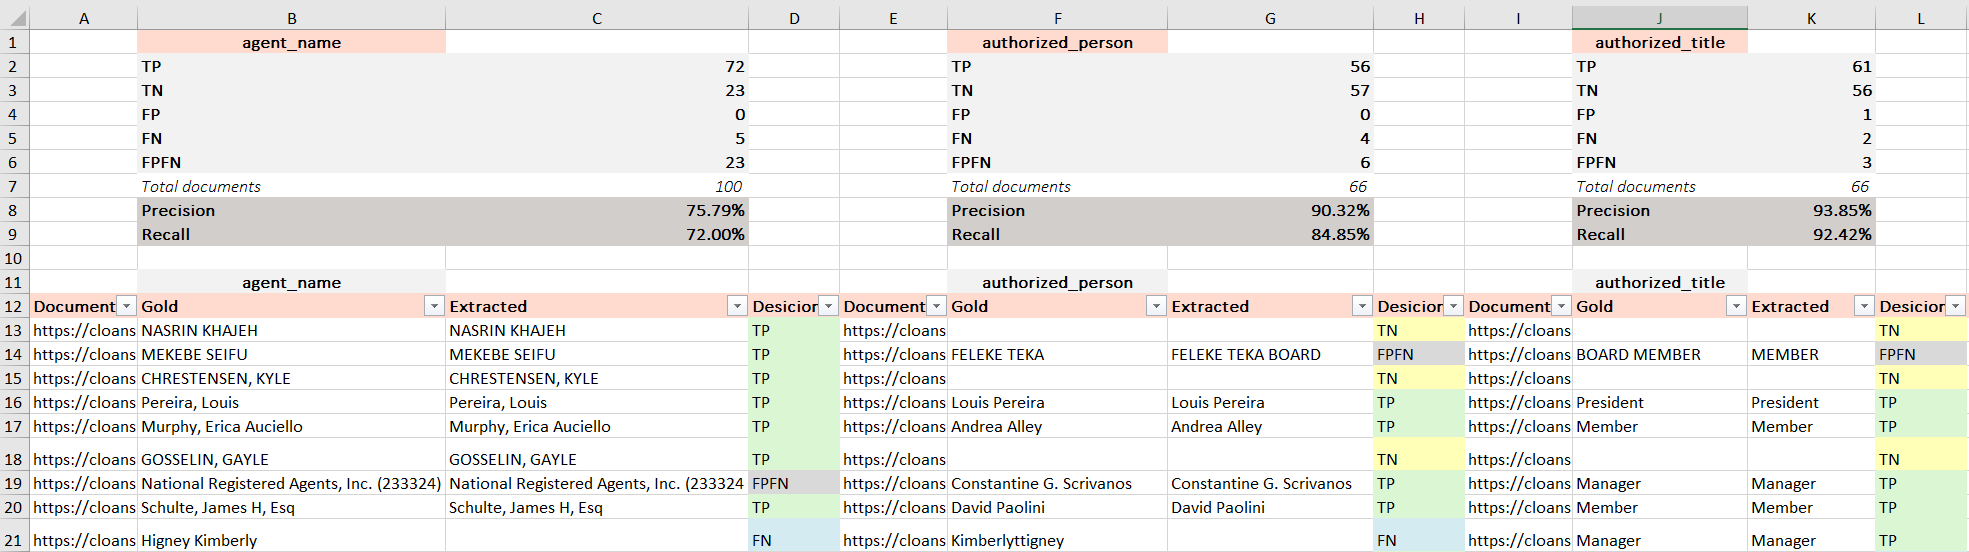
Deliverable
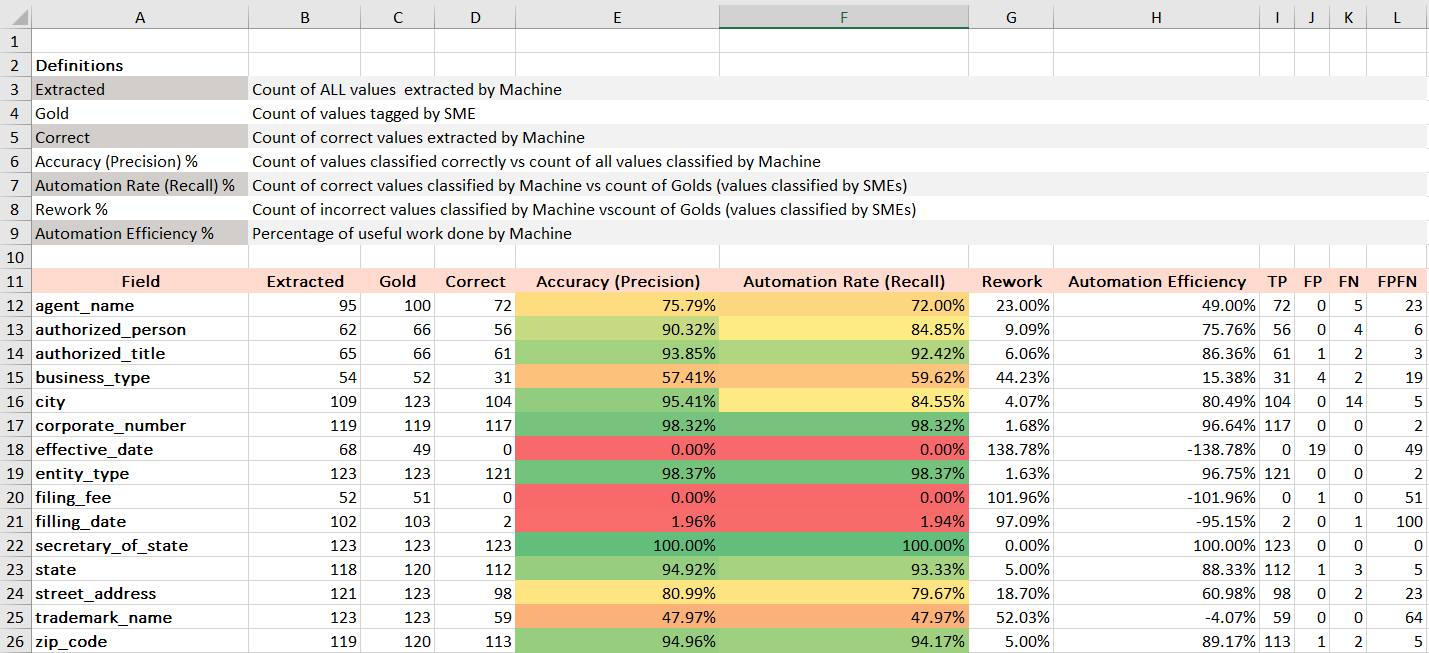
In order to understand what kind of improvements should be applied to the model to meet the required success criteria, it's necessary to thoroughly analyze extraction results for every field, specifically:
- Reasons for FP
- Reasons for FP/FN
- Reasons for FN
As the result, the following report can be generated:
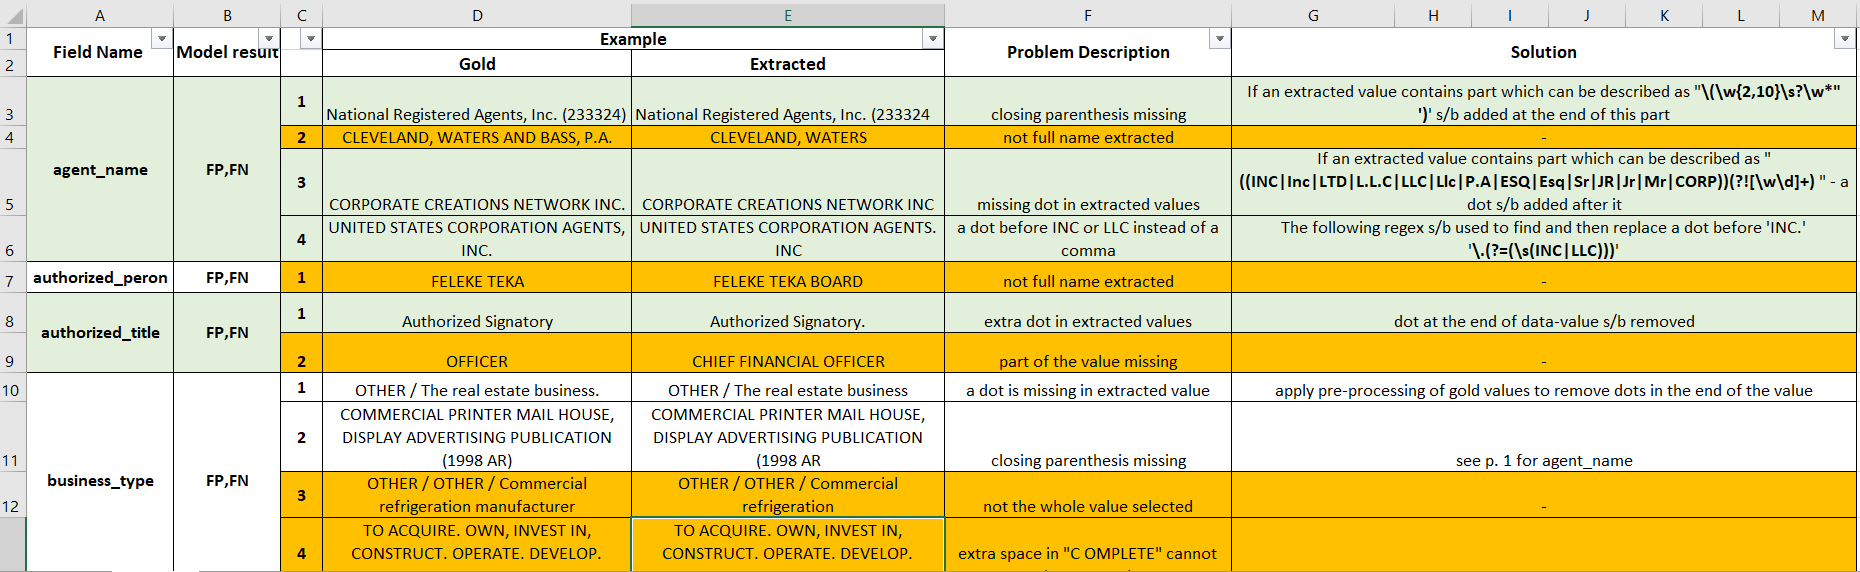
In this report, you should specify name of the field, most common mistakes for each field, and propose a solution (some rules) for their correction.
Note that your rules for post-processing should not be confusing and should capture only frequent mistakes.
For example:
| Gold | Extracted |
|---|---|
| JOHN C. HAMPE | JOHN C. HAMPE, |
| MANAGER OF THE EUROPEAN EQUIPMENT FUND | MANAGER OF THE EUROPEAN EOUIPMENT LEASING FUND |
In the first line we see that during extraction "," (comma) was also selected, so the rule can be: Delete all commas/dots after data value for the field authorized_person.
In the second line we see that in the word "EQUIPMENT," the letter Q was replaced with O, but we cannot write a rule to replace Os with Qs as this is a very specific case and replacement will affect other words. Same concern regarding records marked orange in the above report: They describe problems that cannot be fixed by simple post-processing. Possible solutions for such cases can increasing the dataset and creation of additional components.
After major problems were analyzed and solutions defined, the next step is to apply post-processing. It is usually performed by ML Engineer.
After post-processing is done it's necessary to analyze results one more time in order to define whether they meet success criteria and what additional model improvements need to be done (if any).
Below are the results after implementation of all the steps defined in the "post-processing solutions" file.
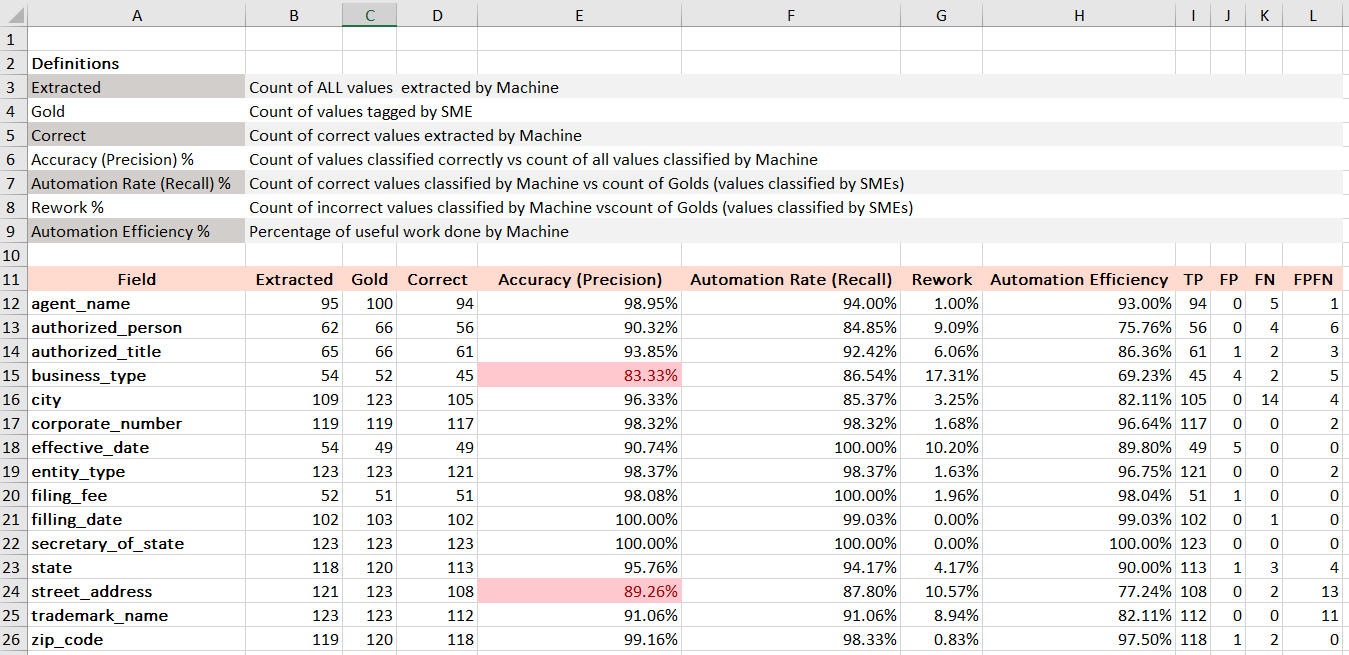
As seen in the table above, we met success criteria for the Automation Rate (recall), which is 60%, and for Accuracy (Precision) for almost all the fields except business_type and street_address. Here more complicated logic and techniques should be applied.
Nevertheless, these cases should be explained to the customer and a solution should be proposed. Some possible explanations and improvements are given on additional sheet of this Excel file:
Case 2. Dataset with mistakes
The results demonstrated above were produced on the high-quality dataset. But let's assume the mistakes were not found and corrected during the validation step. So the model will be trained on a dataset with mistakes:
Download a dataset with mistakes.
Here we can see the statistics received on the bad dataset are lower, because the confidence of the model is lower due to inconsistent labeling (Automation Rate is lower) and the values extracted are not corrected due to incomplete and wrong labeling (Accuracy is lower).
So the dataset is cleaned: All the documents with labels WRONG TAG, MISSING TAG, INCOMPLETE and INCONSISTENT TAG are re-labeled and documents marked as Bad OCR are excluded. Then we'll arrive at the results mentioned above.
See the delta of statistics changing on documents correction:
- Download the statistics delta.
The best statistics are generated on the correct data to the maximum possible extended dataset with post-processing applied.