Analyze OCR dashboards
View OCR dashboards
To view OCR dashboards, go to Kibana > the Welcome dashboard > OCR overview.
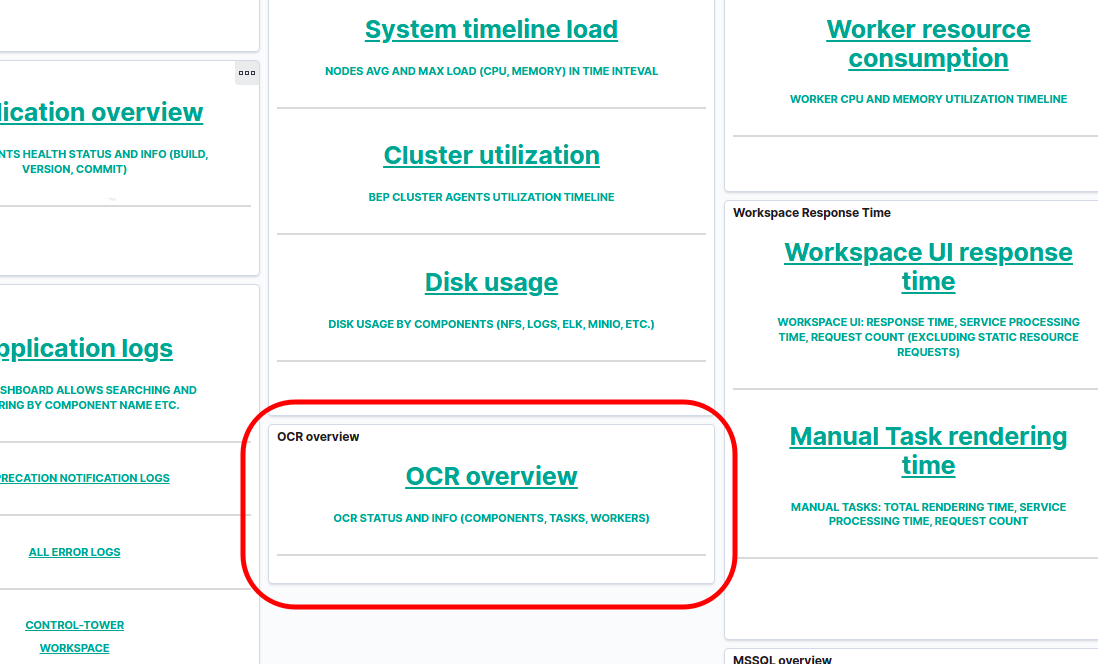
The available OCR dashboards are as follows:
Status: information on the OCR overall status. The dashboard can have the following values:
OKWARNERROR

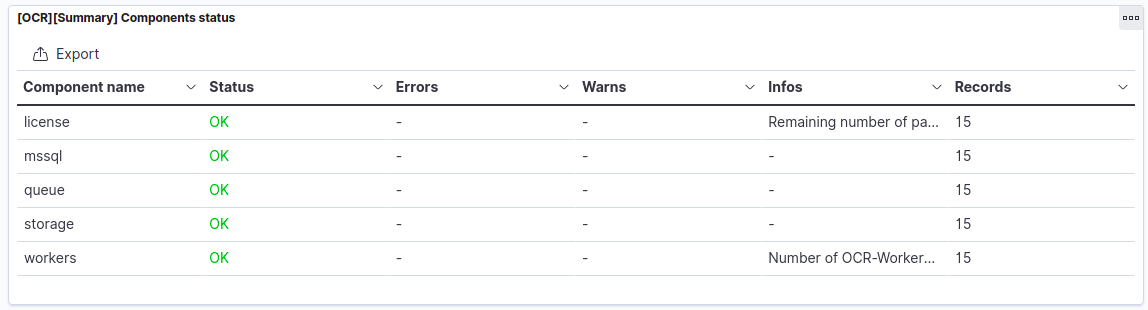
Components status: data on the health status of connected components from the OCR side.
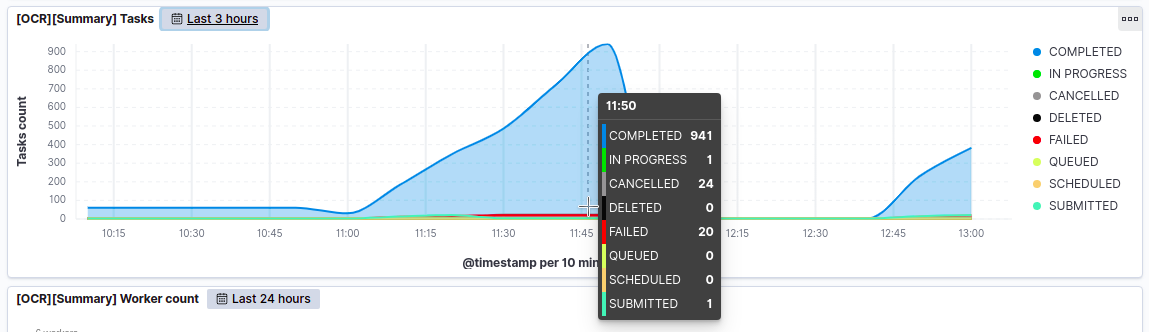
Tasks: information about the internal OCR queue and its current state.
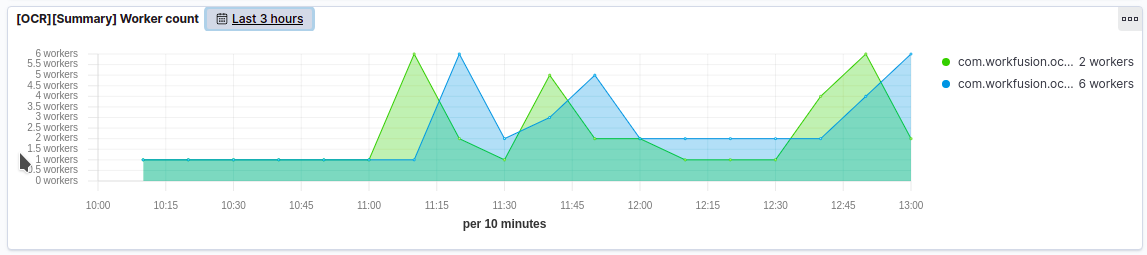
Workers count: information about the v1 and v2 workers count.
Pages count (completed tasks): the number of pages for processed documents.

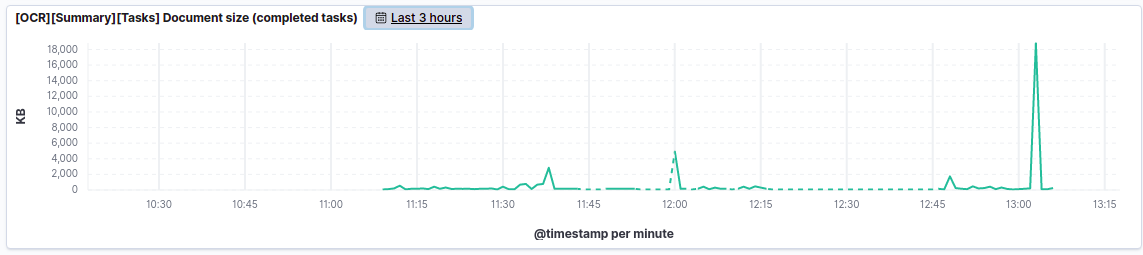
Document size (completed tasks): information about the document file size for processed documents.
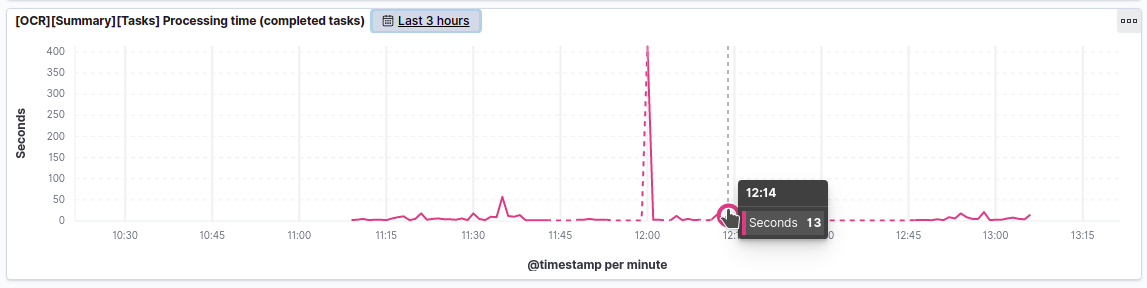
Processing time (completed tasks): information about the processing time for each document.
Analyze performance
The OCR dashboards allow performing an overall analysis of document processing tasks.
The last three graphs represent the dependence of the document processing time on the document size (the number of pages and file size). You can observe that a large multi-page document (100 pages, 18 MB) causes a significant processing time increase (400 seconds).
According to the Tasks dashboard, when processing errors are analyzed, you can find the exact time when issues with document processing started. It is also possible to find problem documents by this time in the database and S3 Manager.
For troubleshooting tips, refer to Issues related to OCR server performance.