Create custom dashboards
This guide gives you a quick introduction to custom dashboards: how to create datasets and charts and organize them into a dashboard. Since WorkFusion Analytics is originally based on Superset, you can refer to the Superset official documentation for additional details.
Connect to database
To manage existing Superset-related database connections and add new ones, navigate to Analytics > Data > Databases.
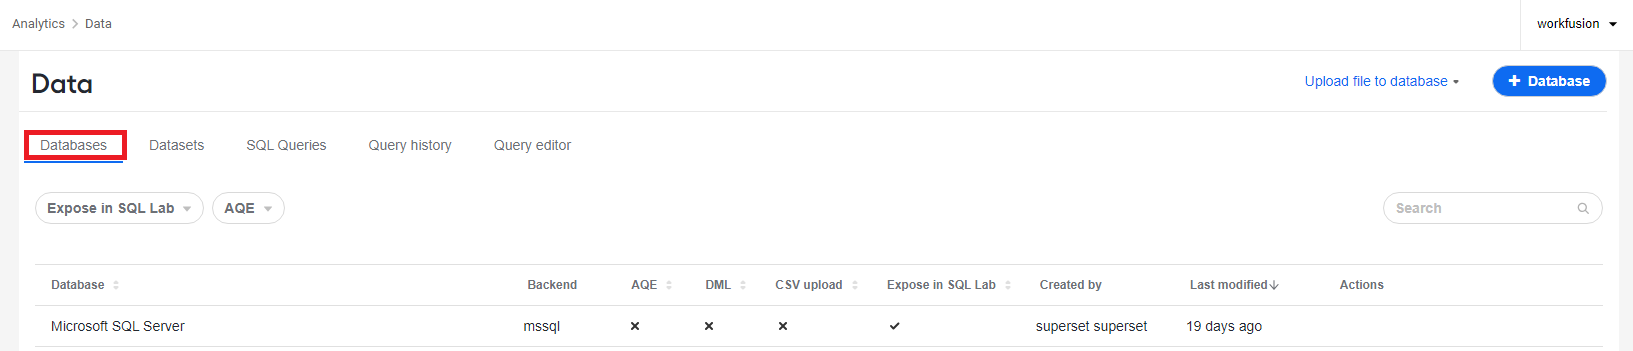
To set up a new database connection, follow the steps below:
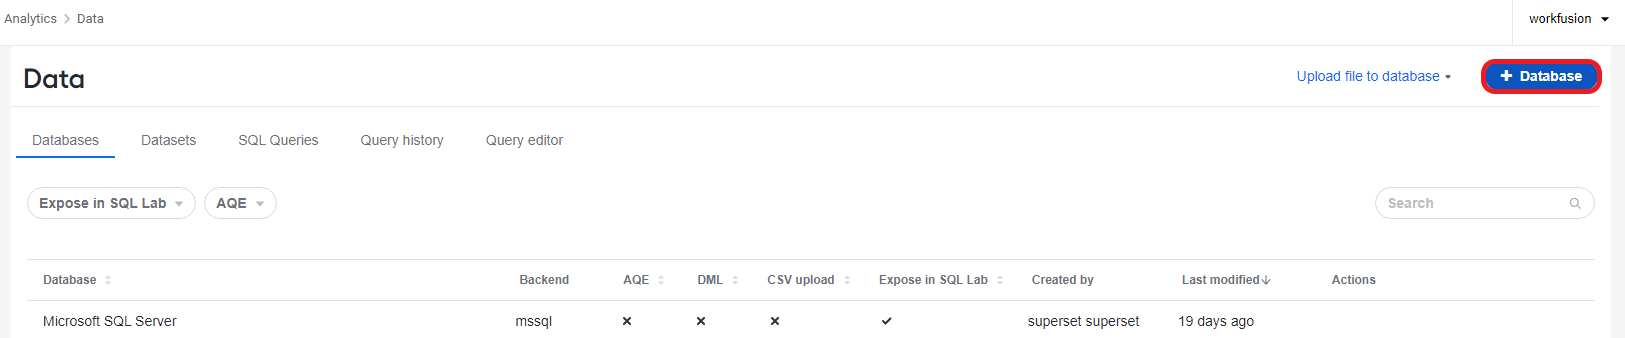
On the Databases page, click +Database.
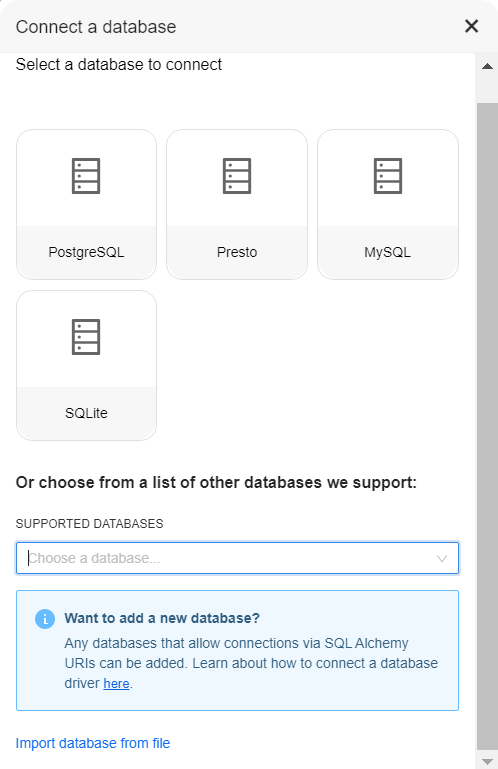
In the Connect a database window, choose the type of the connected database:
Configure the settings for the chosen database and click Connect.
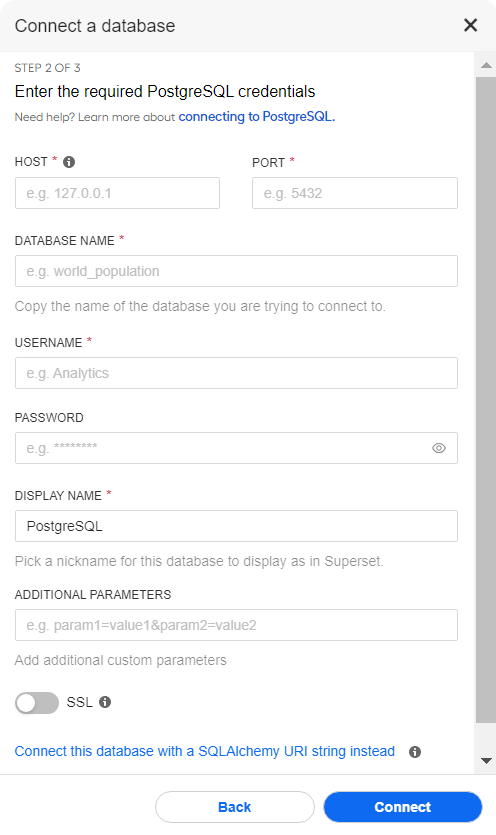
For advanced database configuration tips, refer to the official Superset documentation.
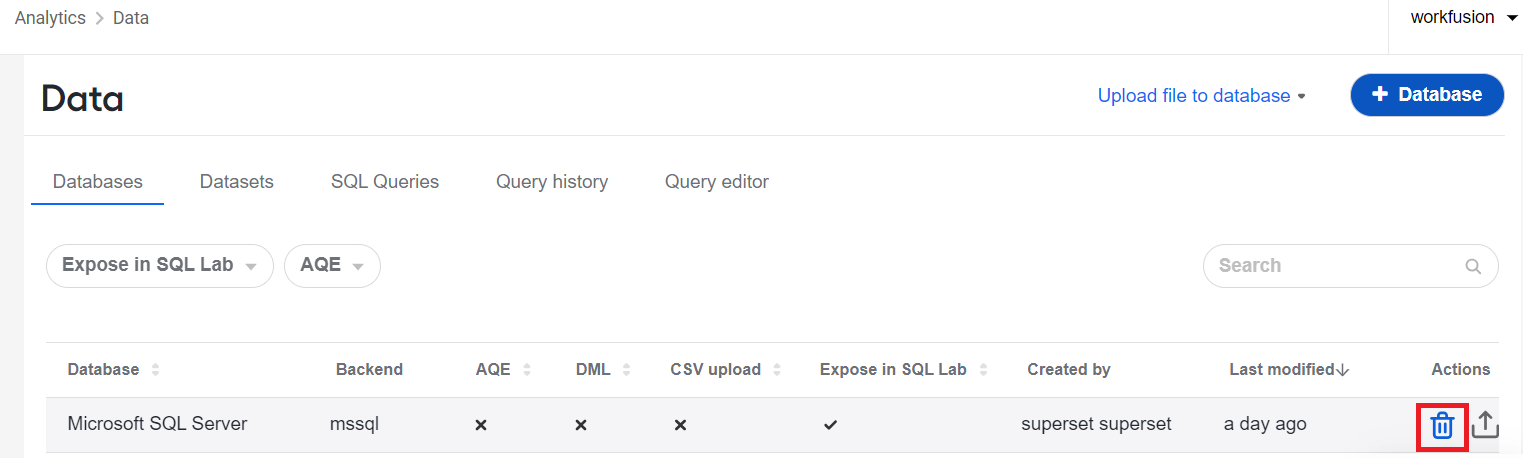
To delete a database connection, hover over the line corresponding to it and click the Delete button:
View dashboards
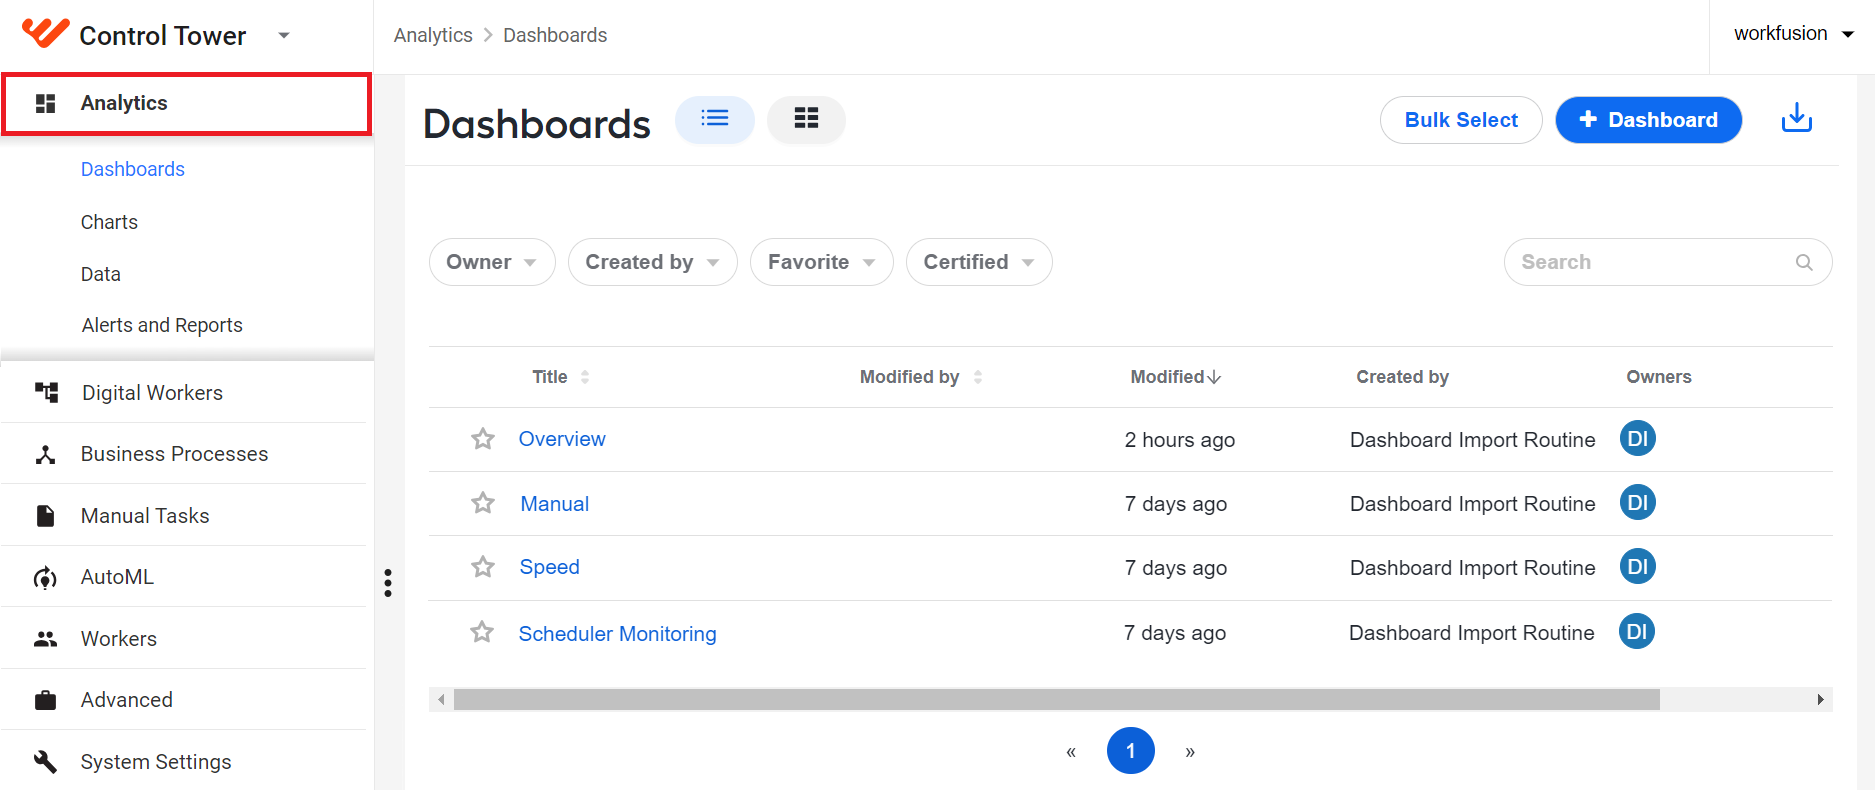
To view all your default and custom dashboards, in Control Tower, in the main menu, go to Analytics and click Dashboards.
Create dashboard
To create a custom dashboard, follow the general sequence of steps:
Build a chart on top of the dataset.
Build a dashboard using one or more charts.
Create dataset
A dataset is an abstraction that points to data in your database. This data is used to create charts and, consequently, dashboards in Superset Analytics.
Superset itself doesn't have a storage layer to store your data but instead pairs with your existing SQL-speaking database or Data Store.
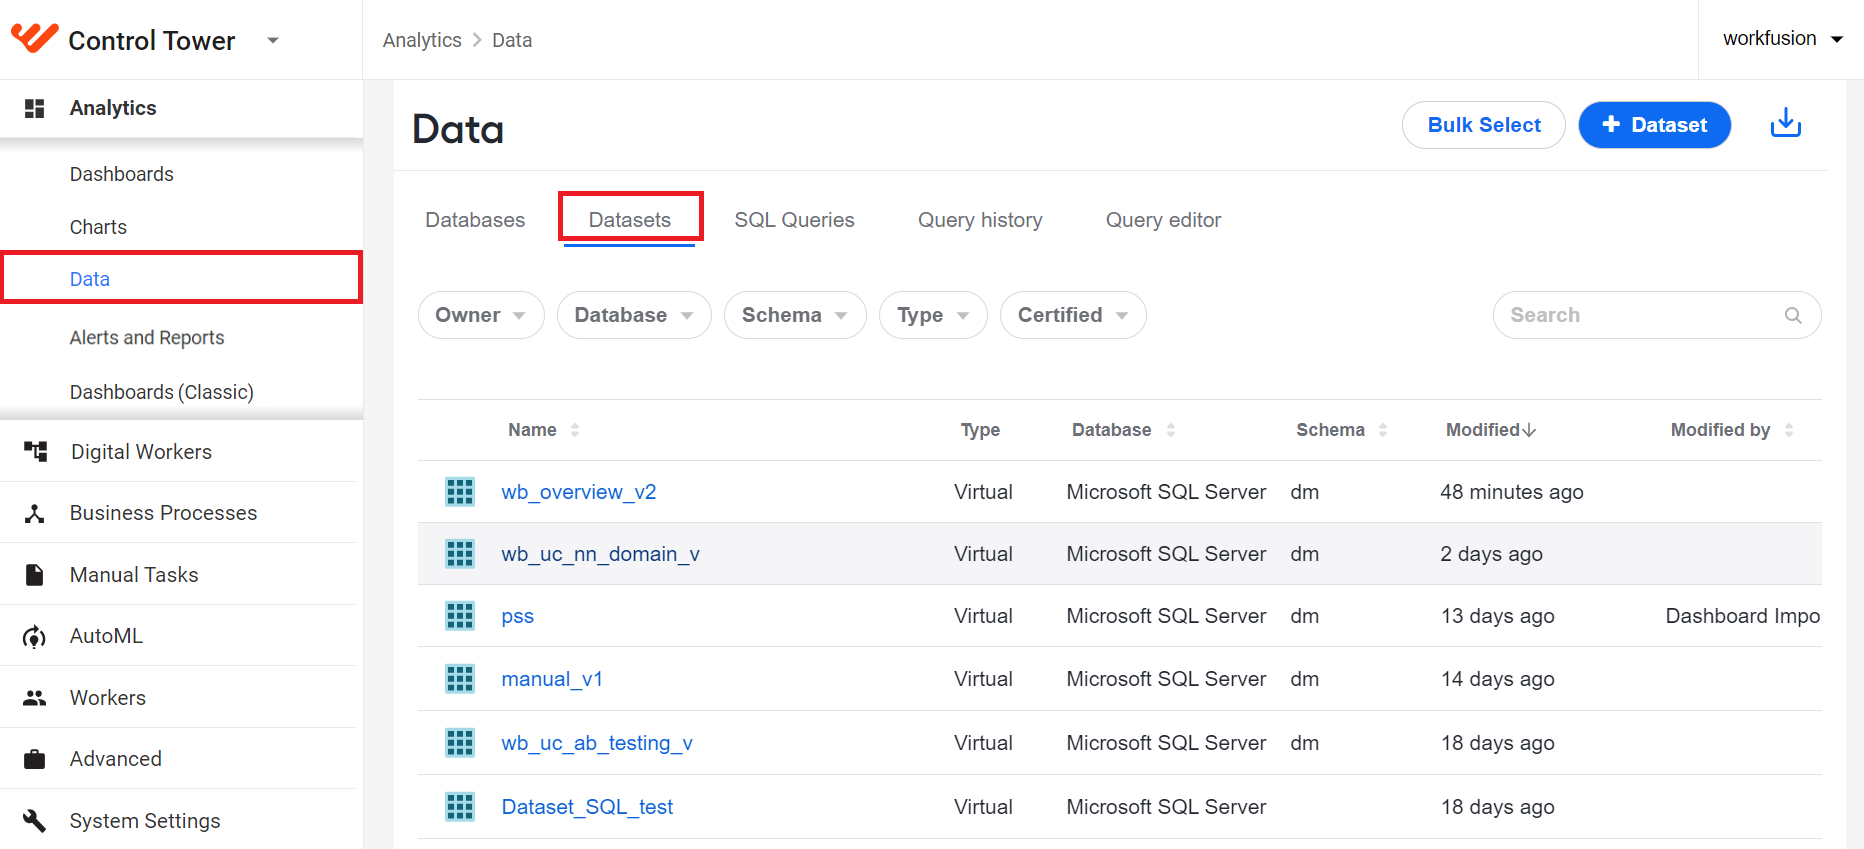
To view available datasets (if any), navigate to Analytics > Data > Datasets. Mind that the Data tab and dataset-related functionality are available only to users with the Developer or Administrator roles and appropriate permissions. For details, refer to Set roles and permissions for Superset Analytics.
There are two methods to create a dataset:
Via Data tab
To create a dataset via the Data tab, do the following:
In Control Tower, navigate to Analytics > Data > + Dataset.
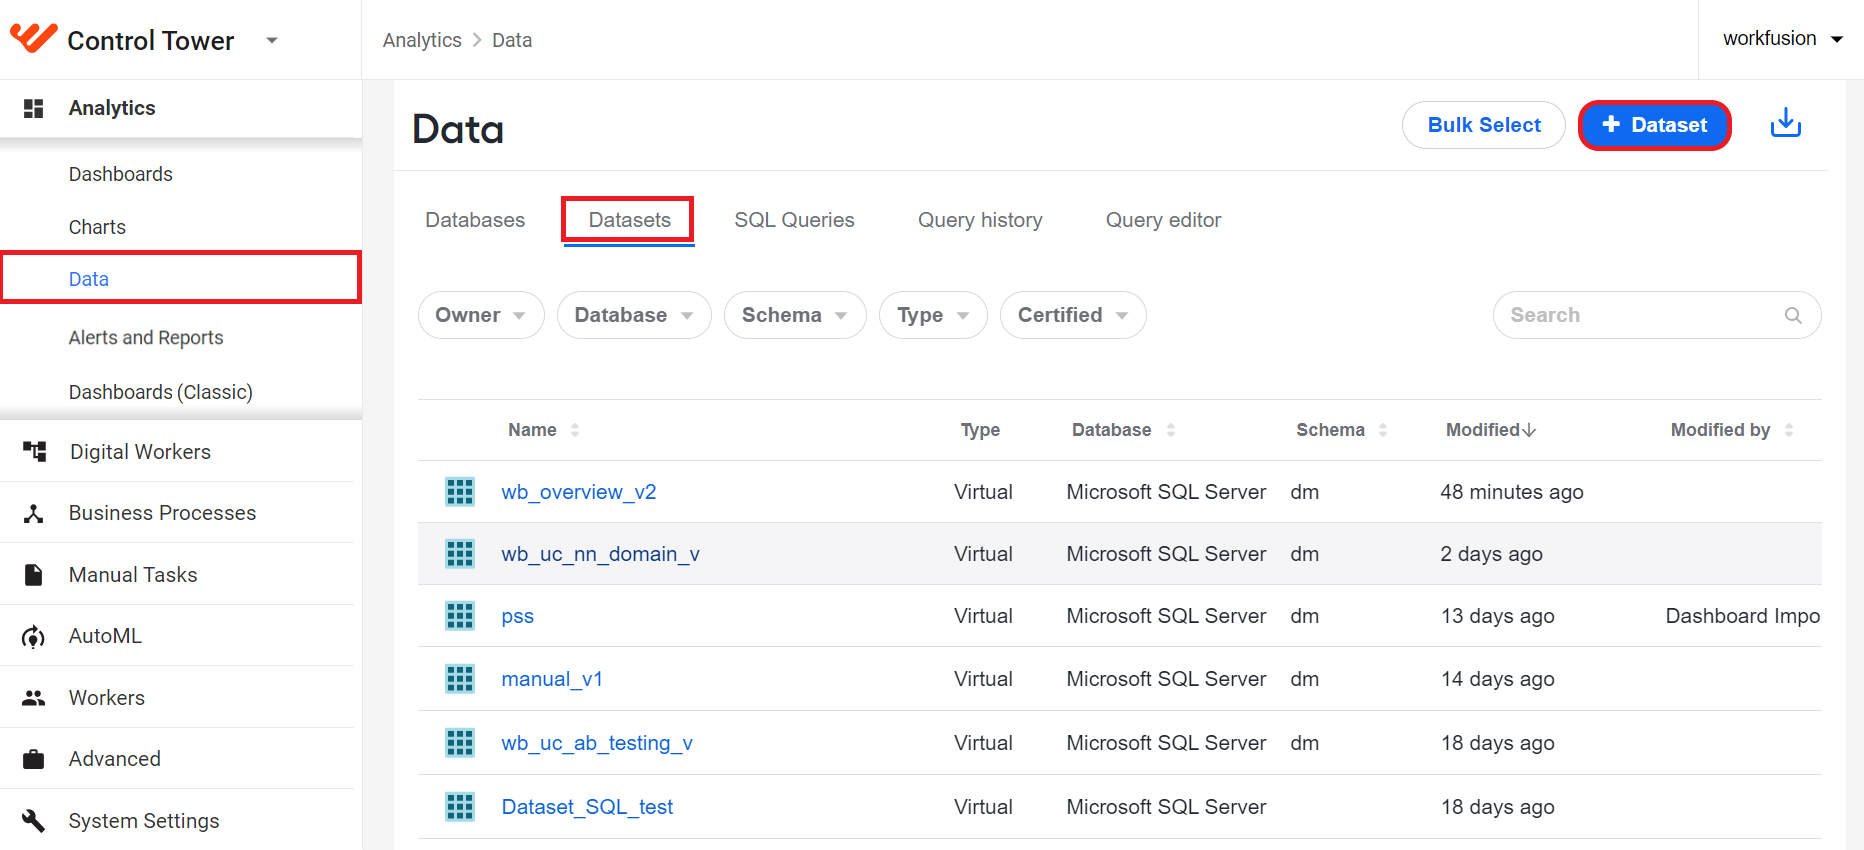
The Add dataset window appears.
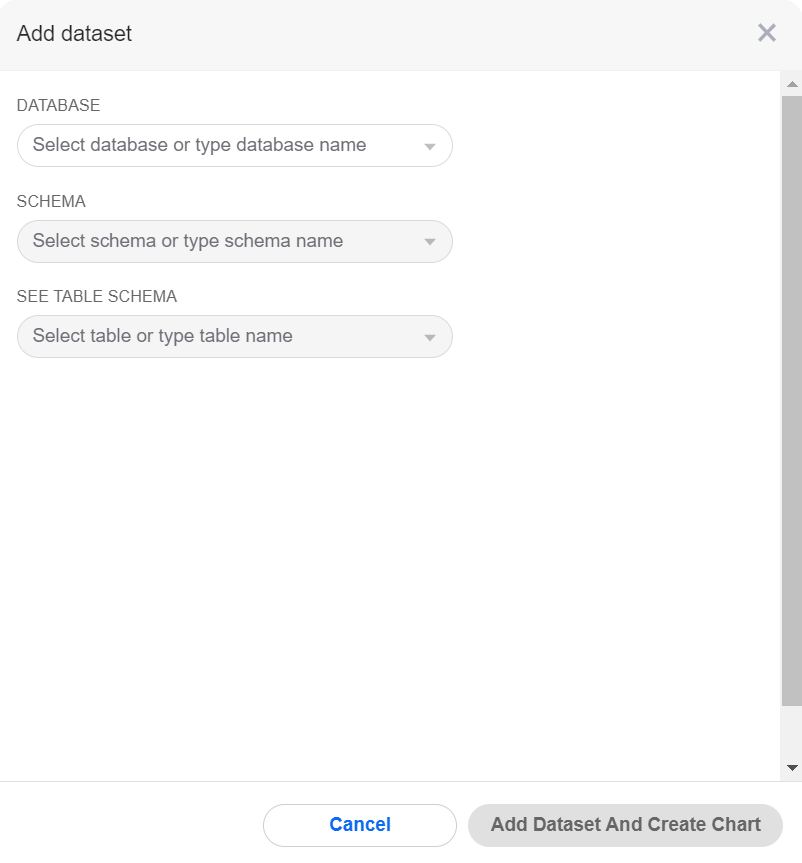
In the window, specify the following dataset properties using the dropdowns that appear:
Database (in the example below, mssql)
Schema (in the example below, dm)
See table schema (in the example below, ct_task)
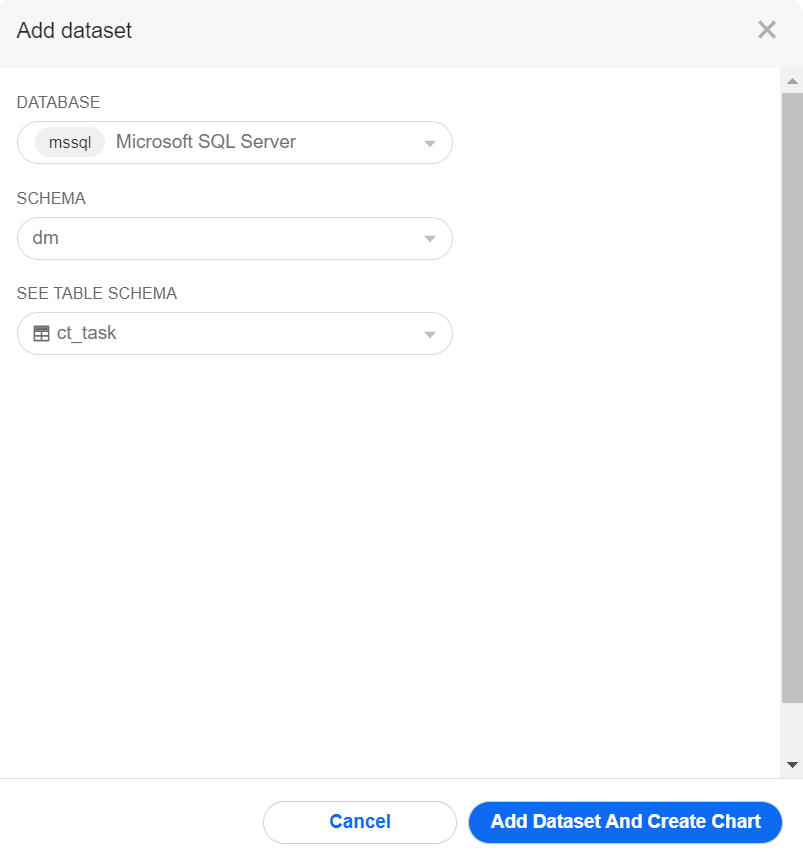
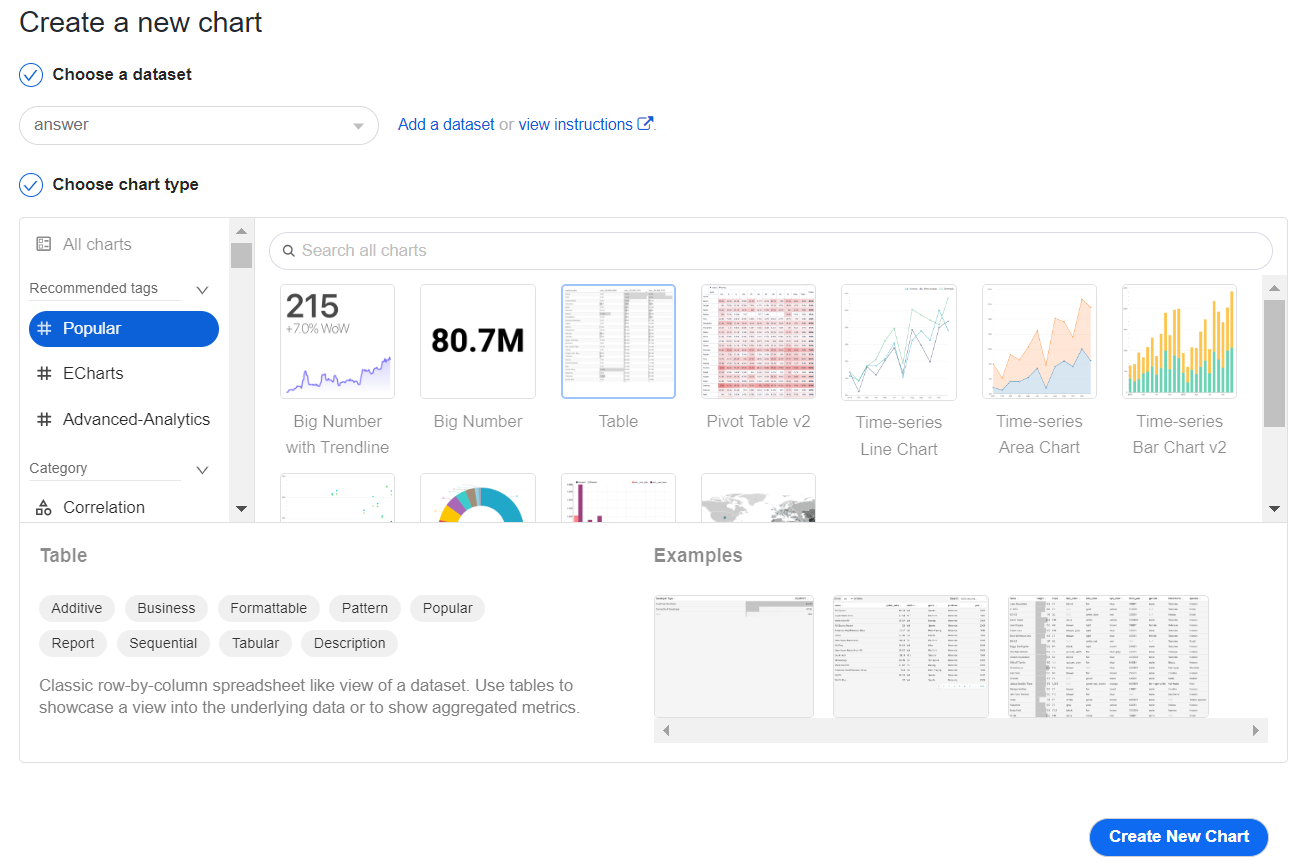
Click Add Dataset and Create Chart. Your dataset appears in the list of datasets, and you are forwarded to the Create a new chart window. You can proceed with creating a chart.
Using SQL queries
Another way to create a chart is to use SQL queries:
In Control Tower, navigate to Analytics > Data > Query Editor.
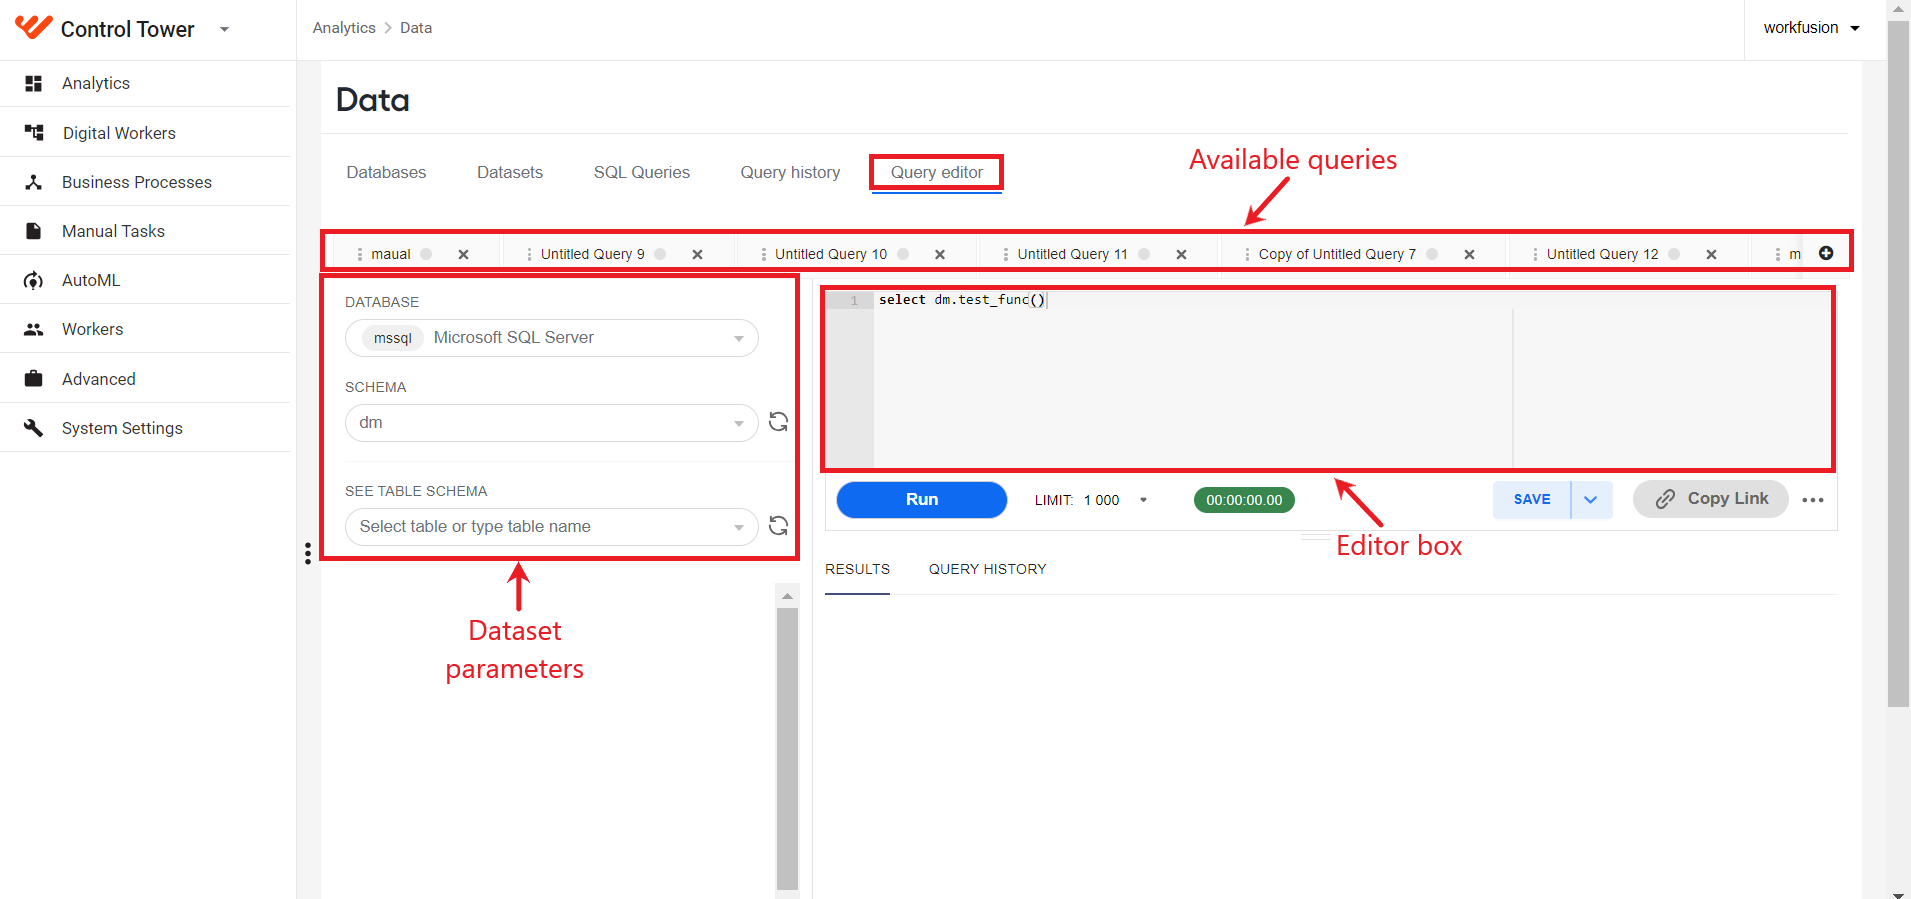
On the Query Editor page, you can either create a query from scratch or based on an existing query (if any). The range of existing queries is represented as a row of tabs above the editor box and the dataset parameter panel.
Set the dataset parameters by filling in the following fields (if needed):
- DATABASE
- SCHEMA
- SEE TABLE SCHEMA
In the editor box, write your query.
Click Run to test the query. The output of the query run appears on the RESULTS panel.
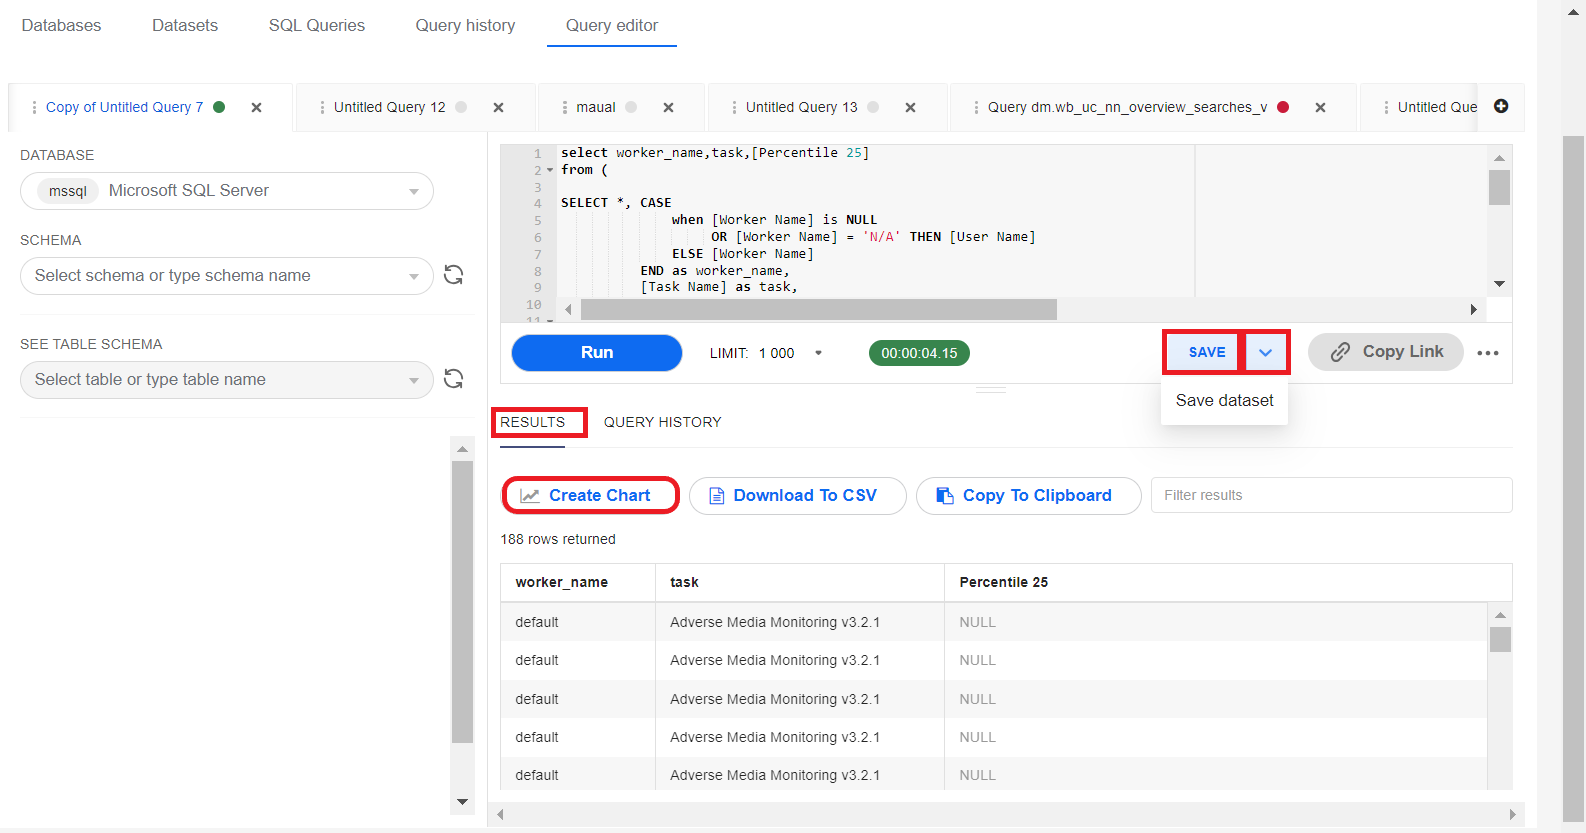
If you are satisfied with the output, you can proceed in one of the following ways:
Create a chart with the dataset you obtained using the query. To do that, click Create chart button and proceed as described in the Create charts section.
Save the query: click Save, and the query appears in the list on the SQL Queries tab.
Save the query as a dataset: click the arrow next to Save and select Save dataset. The respective dataset appears in the list on the Datasets tab.
Create chart
With the Superset functionality, you can create various chart types according to your business needs: tables, bar charts, pie charts, and so on. To create a chart, follow the steps below:
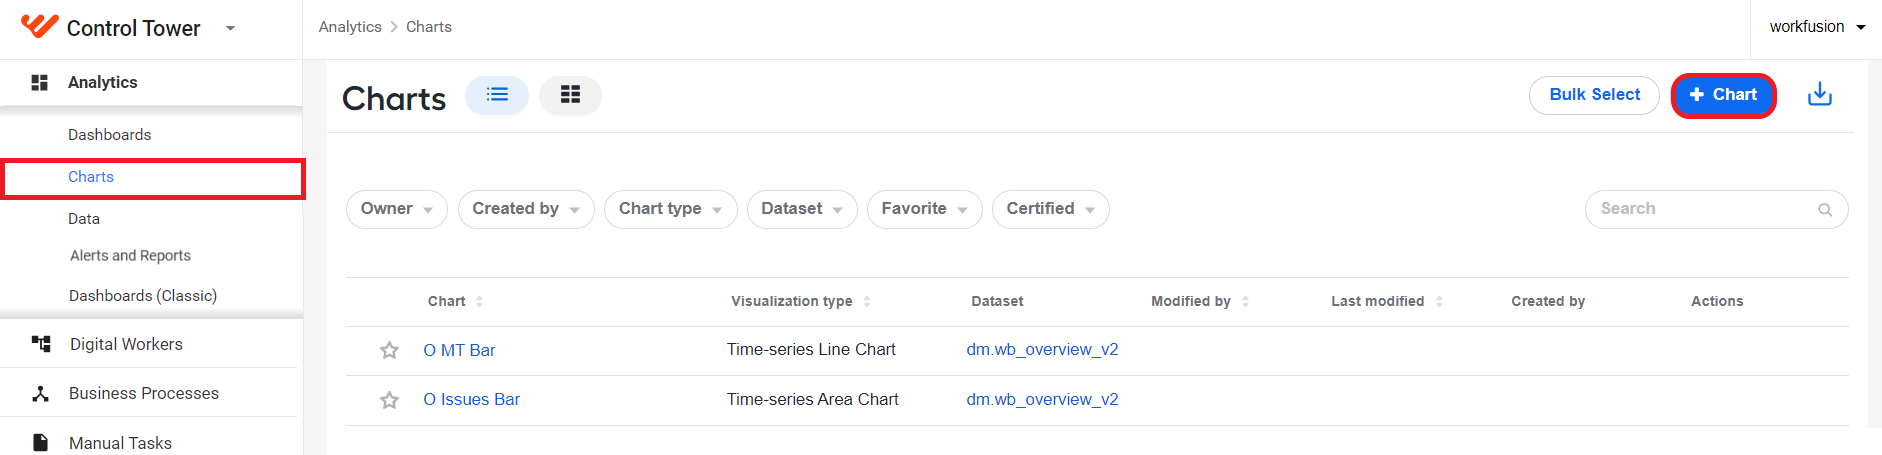
In Control Tower, navigate to Analytics > Charts > + Chart.
 warning
If you don't see the Charts or other tabs, ask your administrators to enable respective permissions for your user or group.
On the Create a new chart screen, specify the parameters for your new dashboard:
In the Choose a dataset box, choose a dataset to use in your chart, for example, the one you created in the previous step.
In the Choose chart type box, choose a required chart from the list, for example, Table.
Click Create New Chart.
On the displayed screen, set up required parameters and click Create Chart. The resulting visualization appears in the empty space on the right.
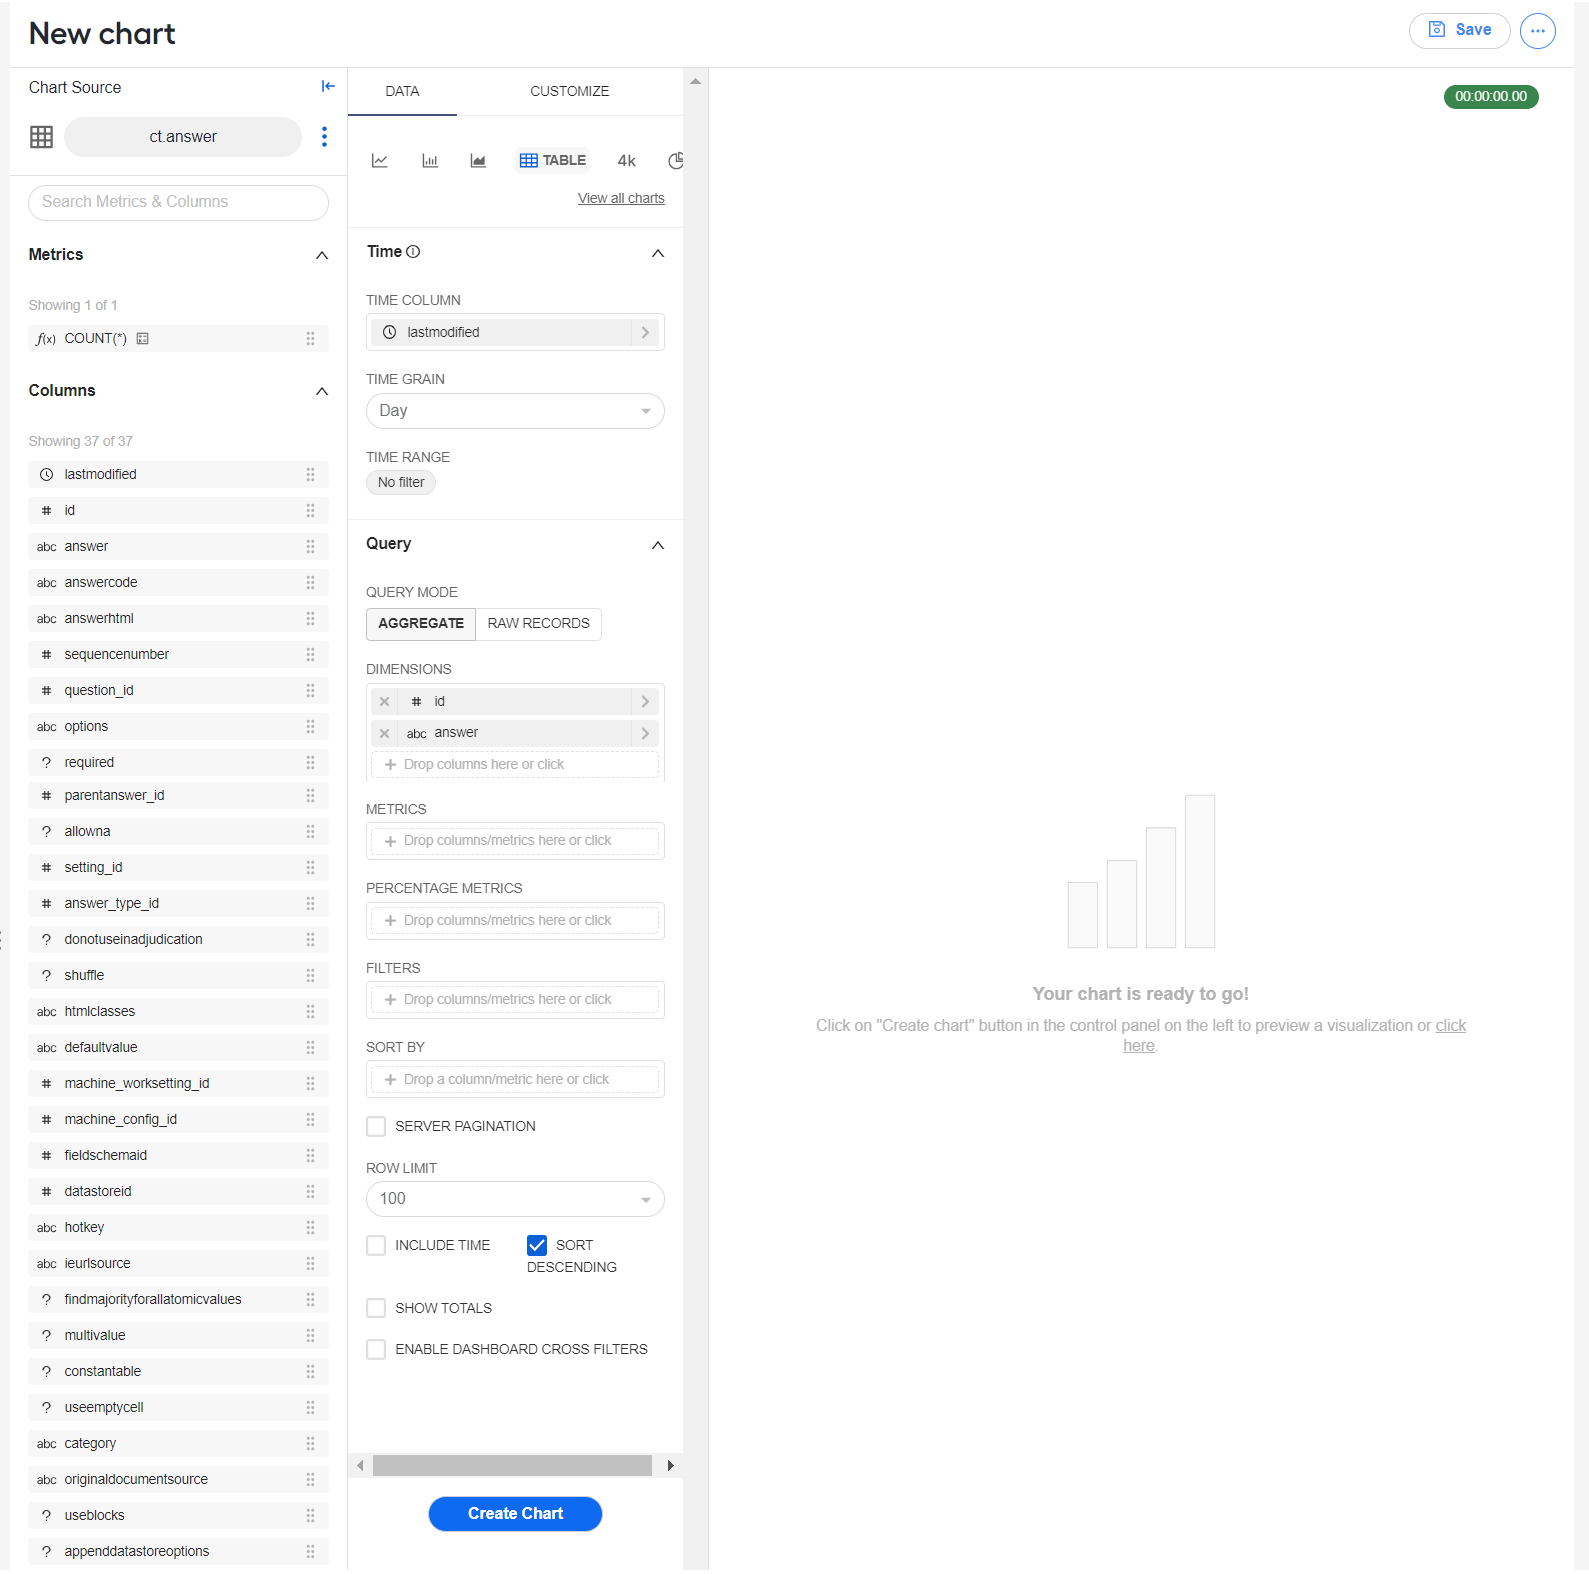
For chart configuration examples, refer to the Superset documentation.
noteYou can write the metrics using common SQL expressions. Also, with your SQL engineers' assistance, you can create complex SQL logic, for example, to integrate multiple tables and join all their datasets.
You can directly connect to the database and run the queries without a database editor.
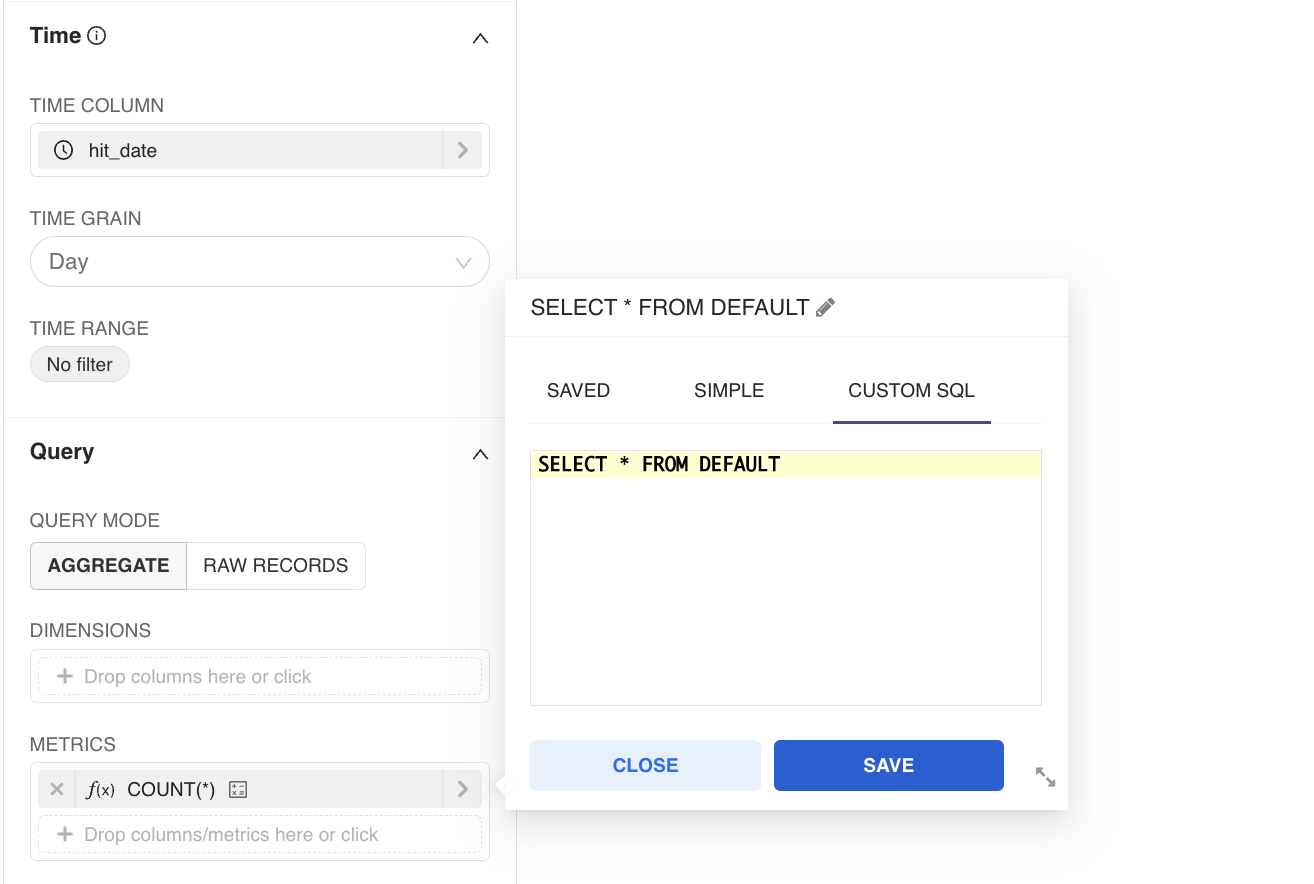
To save the resulting chart, click the Save button in the top right corner of the New chart page:
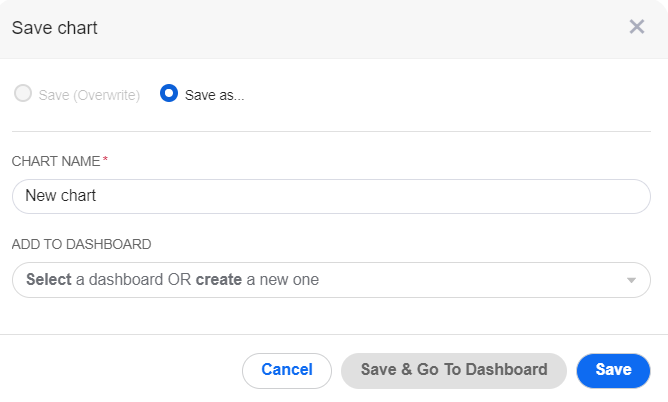
On the Save chart screen, in the Add to dashboard box, select the dashboard where you want the chart to appear.
Click Save or Save & Go To Dashboard to open your updated dashboard.
Build dashboard
To build a dashboard, do the following:
In Control Tower, navigate to Analytics > Dashboards > + Dashboard.
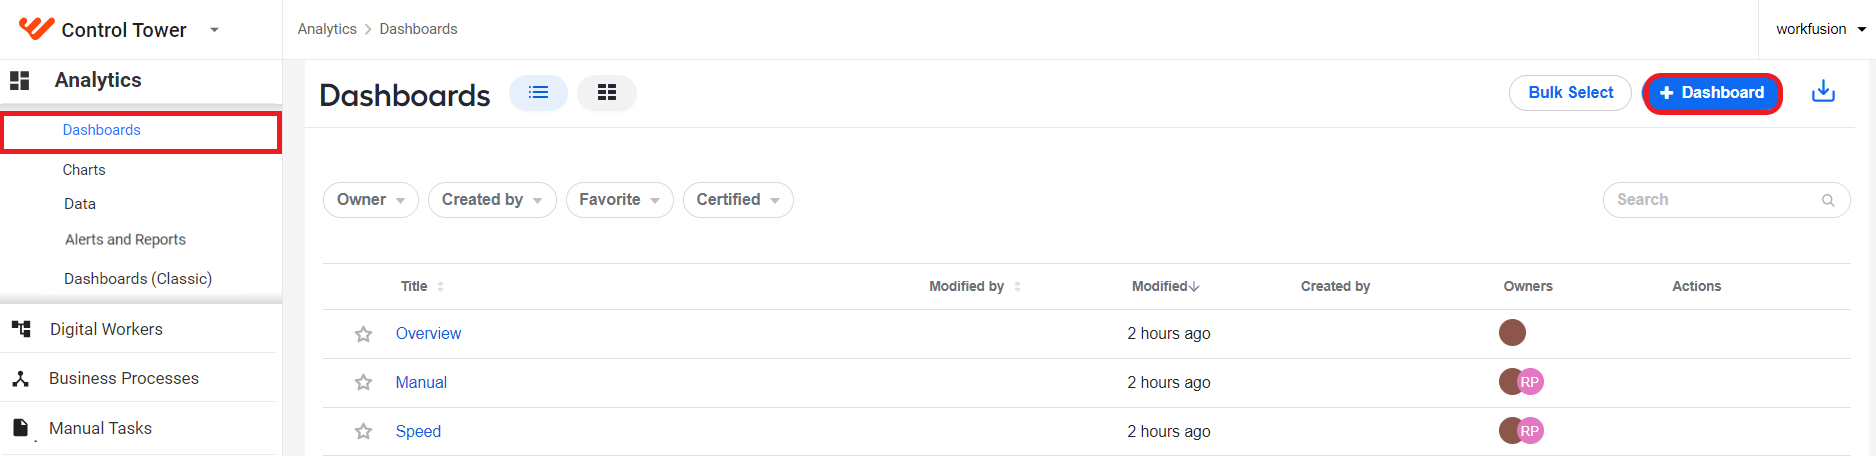
On the Dashboard screen, set the dashboard name.
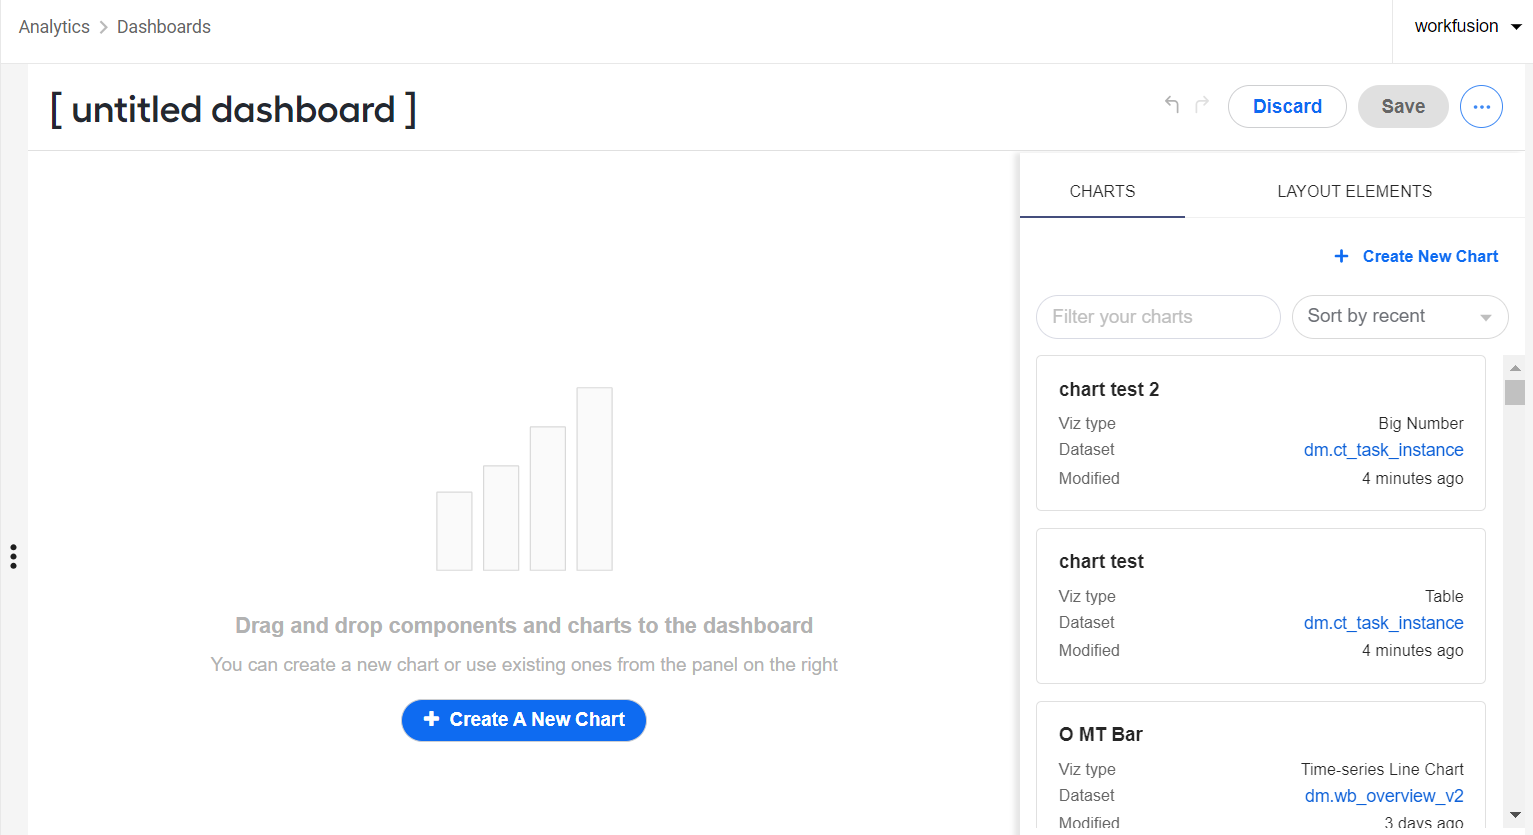
To form your dashboard, drag charts and layout elements from the tabs on the right:
- The Charts tab contains a list of all charts you have access to (i.e., charts you have created or a team member has shared ownership access). Alternatively, click Create A New Chart button and build a chart from scratch.
- The Layout Elements tab lists elements to customize your dashboards, for instance, headers, markdown code, and so on.
Click Save. The resulting dashboard is saved with the Draft status and appears in the list on the Dashboards page.
In the Draft status, the dashboard is not visible to anyone but you. To make it publicly available, click the Draft indication next to the dashboard name.

The Draft status is changed to Published, and the dashboard becomes publicly available.

You can also set any published dashboard back to the Draft status by clicking the Published indication.
If you need to update a dashboard, select it in the Dashboards list. Once the dashboard's page opens, click Edit Dashboard to switch to the Edit mode and make necessary changes.

Delete dashboard
To remove a dashboard permanently, follow the steps below:
Navigate to Dashboards, hover over a line corresponding to the dashboard you want to remove, and click the Delete button.
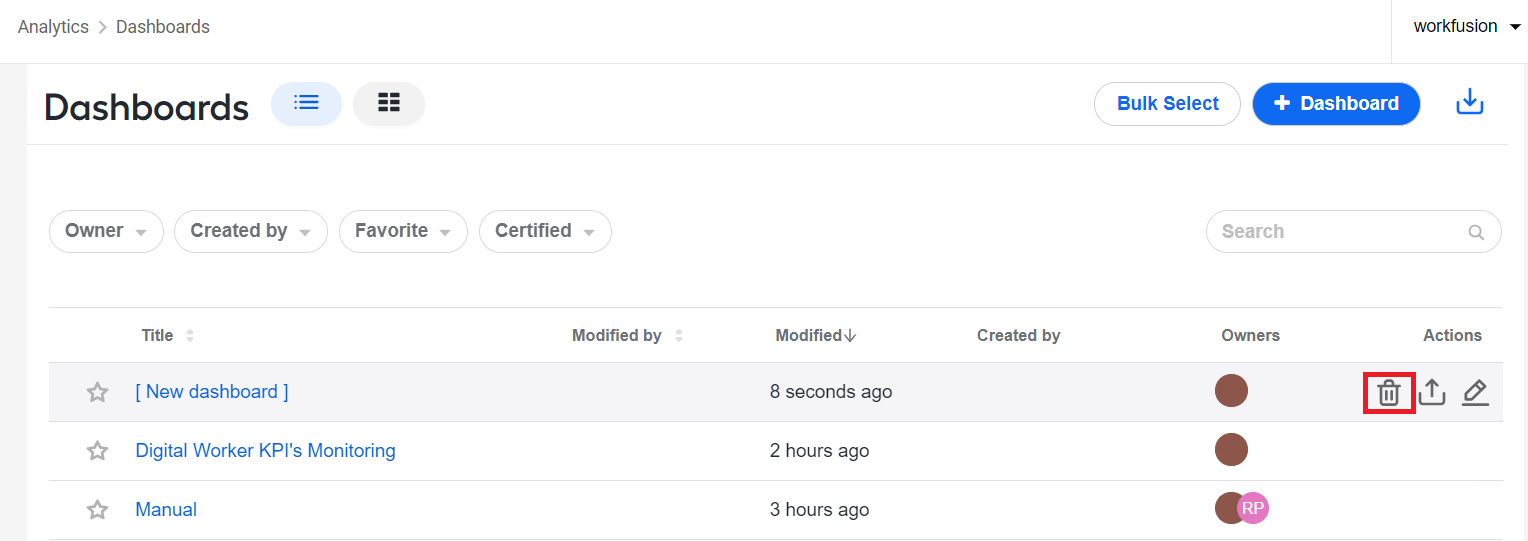
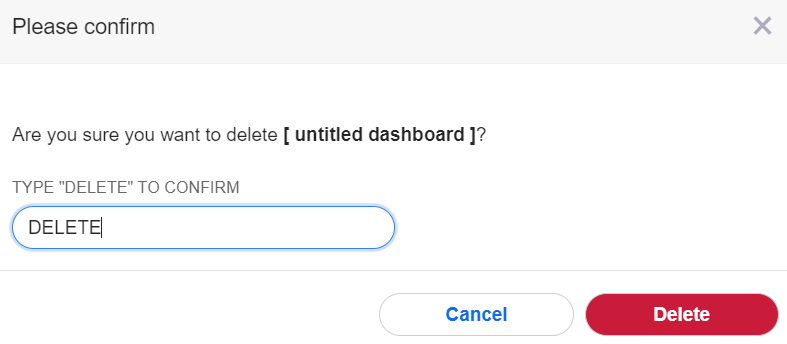
Confirm the deletion: type in DELETE and click Delete. The dashboard is removed from the list.
Configure dashboard and chart properties
To change the properties of a dashboard, follow the steps below:
Open the Dashboard properties window in one of the following ways:
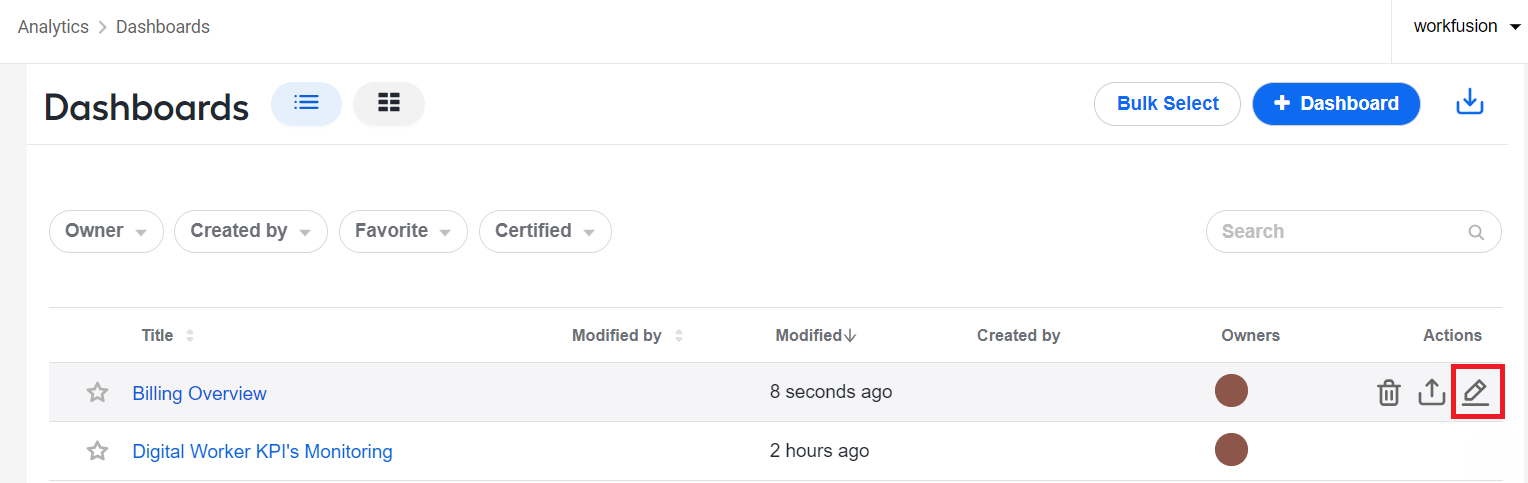
On the Dashboards list, hover over the dashboard for which you want to change properties. In the Actions column, click the Edit button.
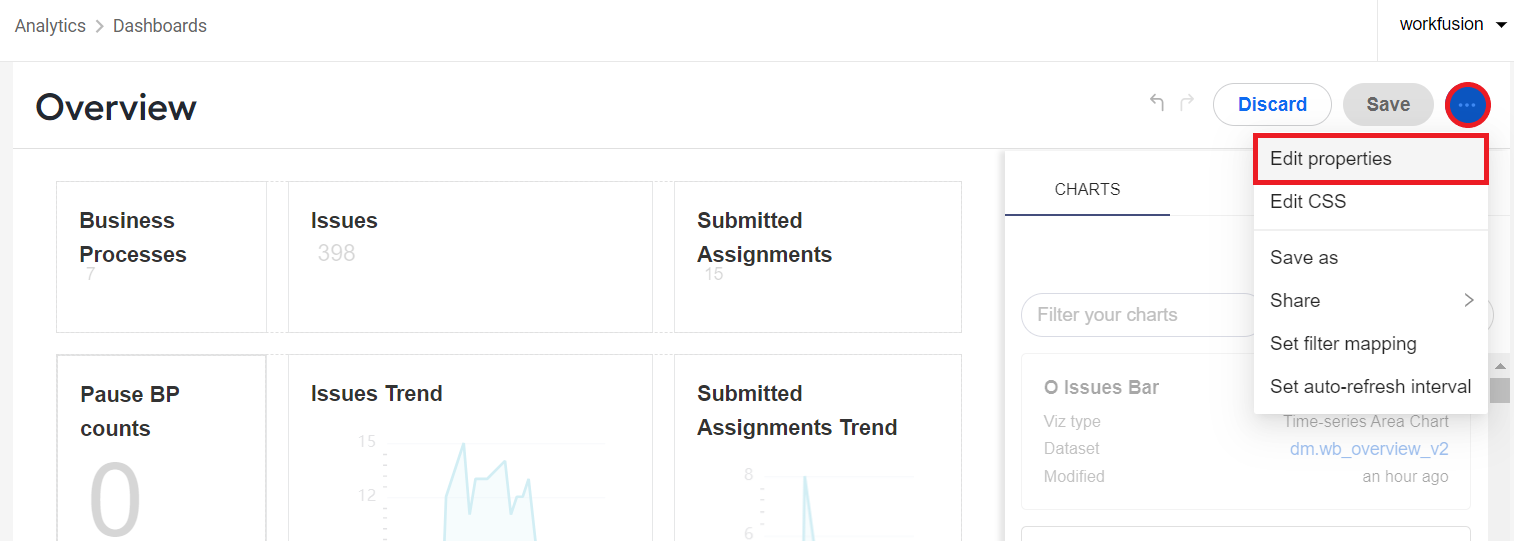
On the dashboard's page, click the Edit dashboard button to switch to the Edit mode. Then, open the Actions menu and select Edit properties.
In the Dashboard properties window, make changes as appropriate and click Save.
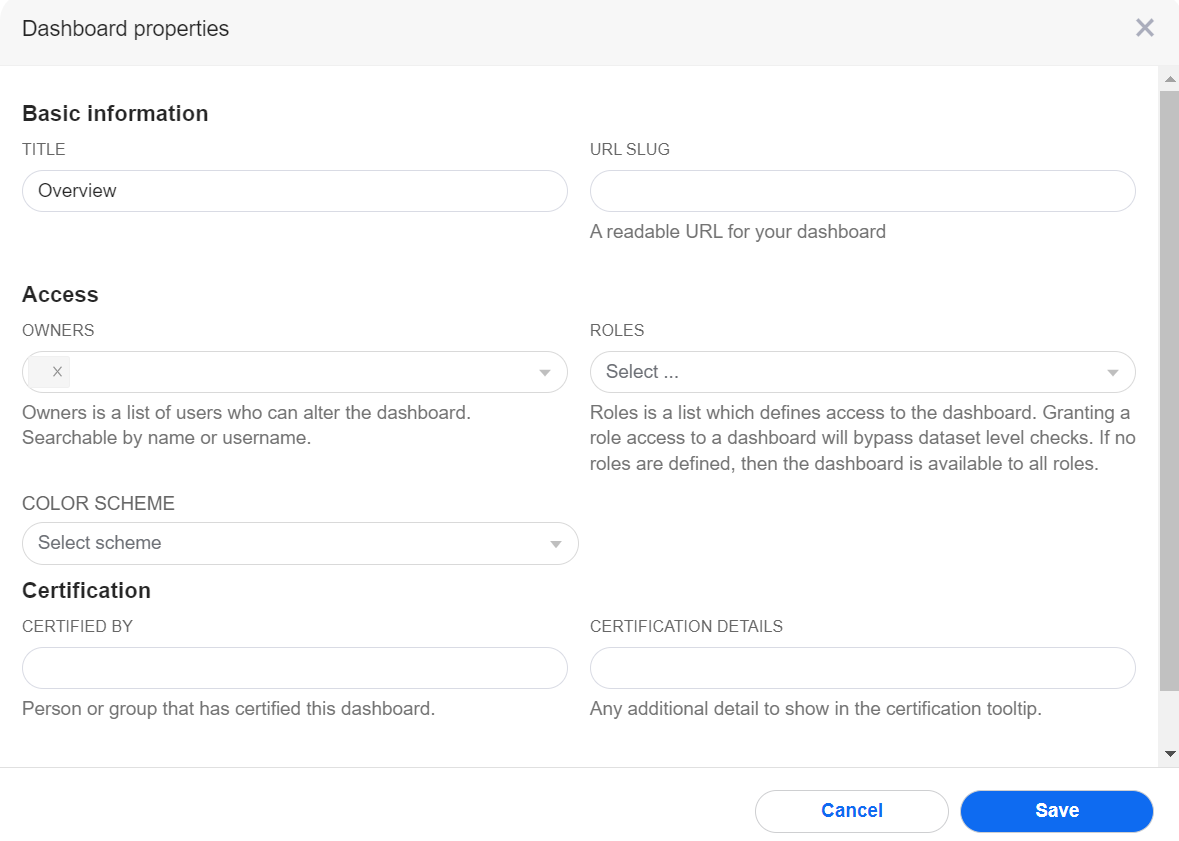
If you are making changes to the dashboard properties in the Edit mode, the Save button is replaced by Apply.
To edit the properties of a chart, follow the steps below:
Go to Charts and click the chart for which you want to change properties.
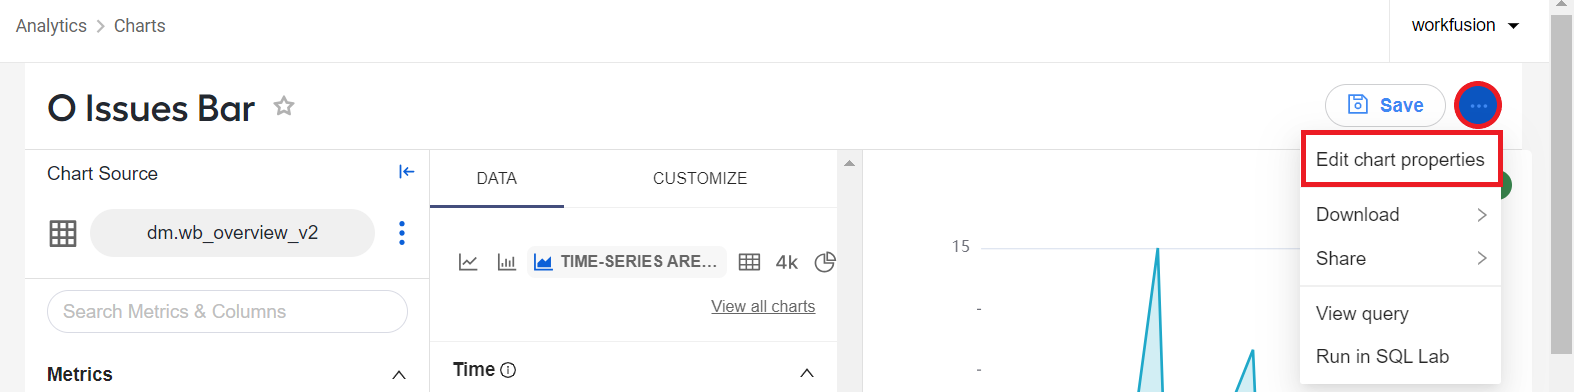
On the chart's page, open the Actions menu and select Edit chart properties.
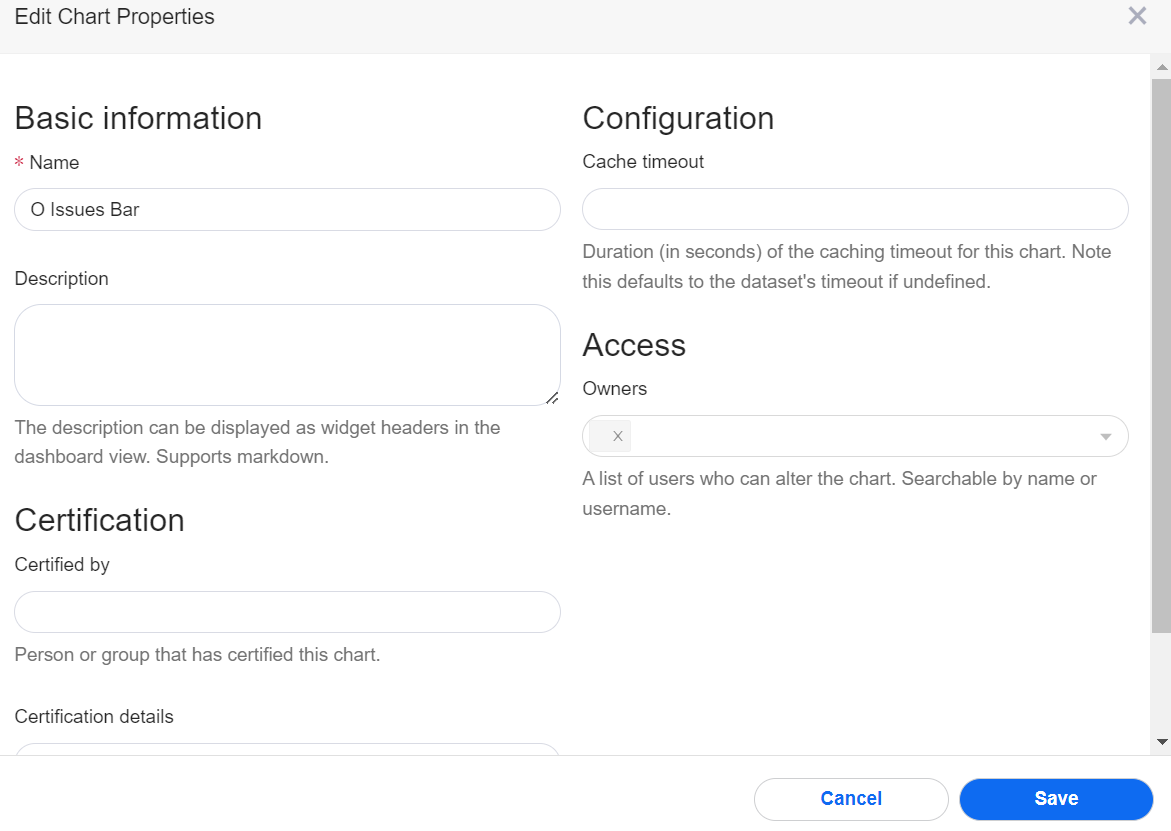
In the Edit chart properties window, make required changes and click Save.
Share dashboards and charts
You can share dashboards and charts with any users who have appropriate permissions to access dashboards. Users with read-only permissions can only view shared dashboards and charts, and users with edit permissions can view and edit them.
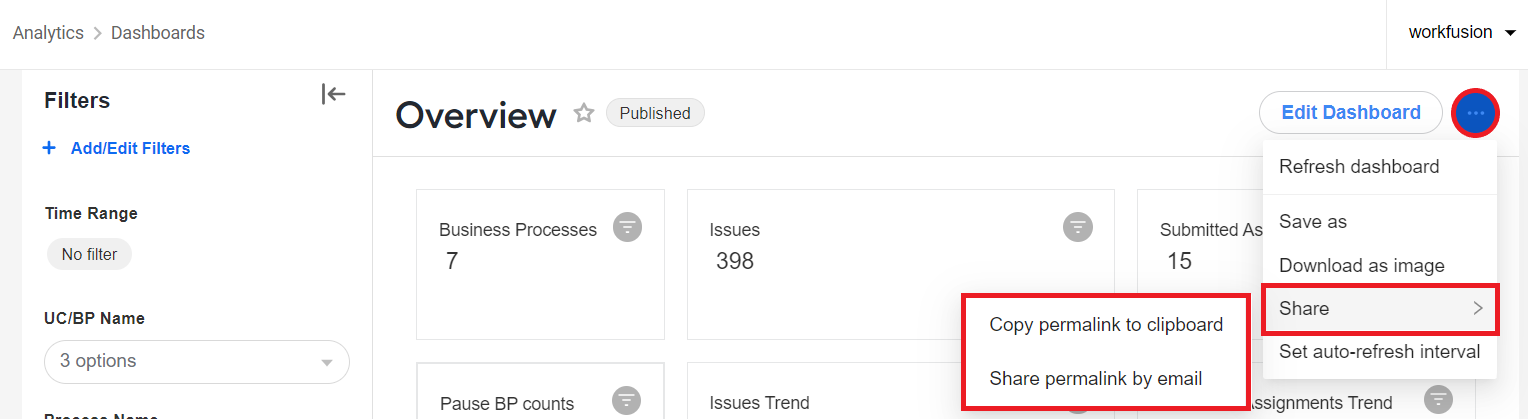
To share a dashboard, open the dashboard you want to share and, in the Actions menu, click Share and select a method to share the dashboard.
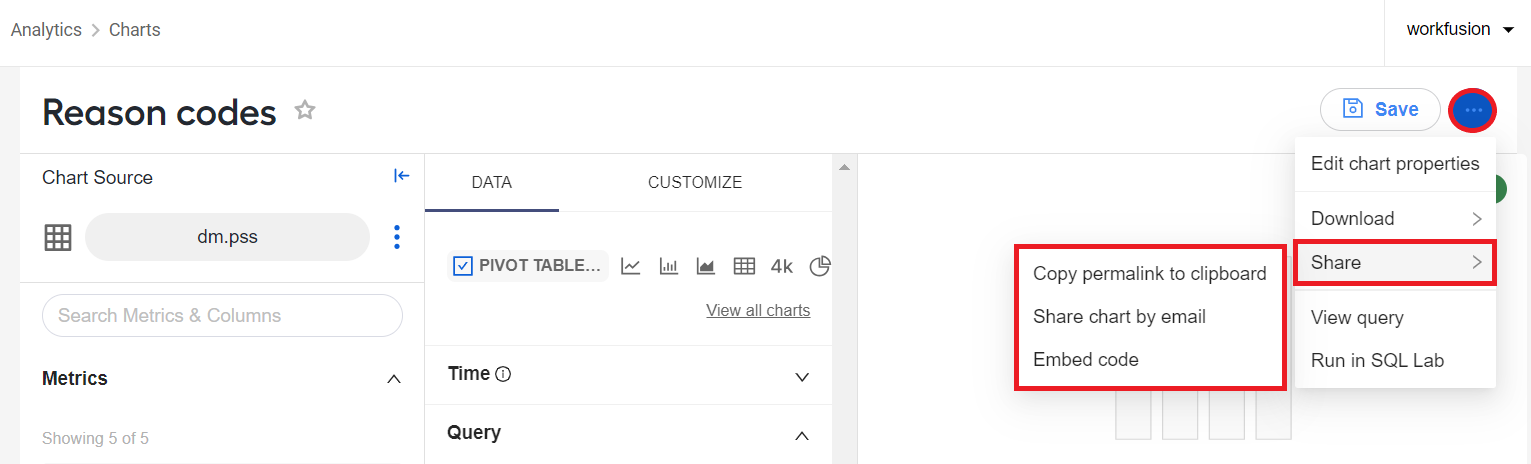
To share a chart, open the chart you want to share and, in the Actions menu, click Share and select a method to share the chart.
Migrate
Superset allows migrating dashboards, charts, and datasets across different environments. For example, after creating a dashboard and checking it on a test instance, if everything goes well, you can use the functionality to import the working dashboard into the production environment.
Only users with the Admin permissions can export and import dashboards and other Superset assets.
Import datasets
To import a dataset, follow the steps below:
Navigate to Data > Datasets.
Click the Import button.
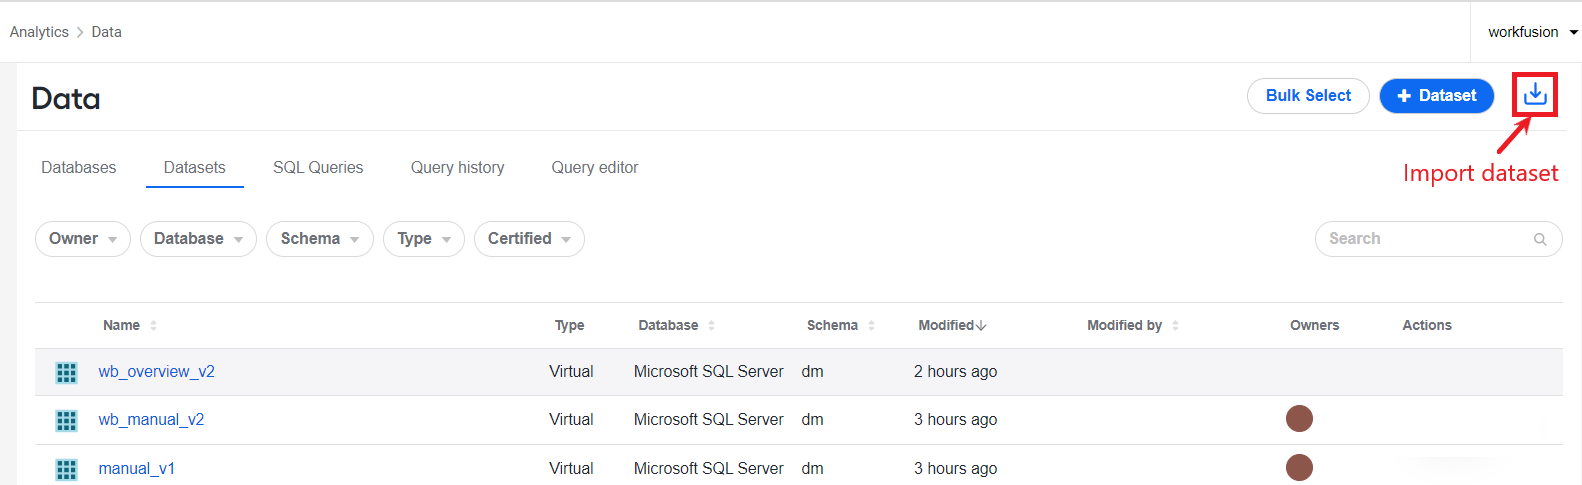
Choose a dataset file to import and click Import.

Export and import charts
You can migrate Superset charts across your environments (for example, from a DEV to a PROD instance) as JSON or CSV files.
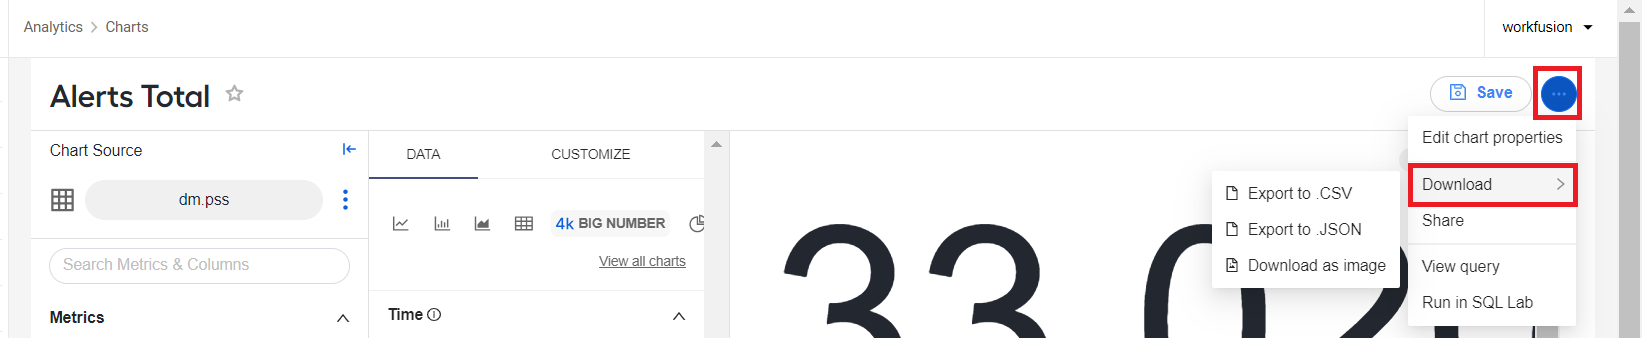
To export a chart, navigate to Charts and click the required chart in the list to open the chart's editing page. In the top left corner, click the Actions menu button > Download and select an exporting format. The chart is saved in the selected format on your computer.
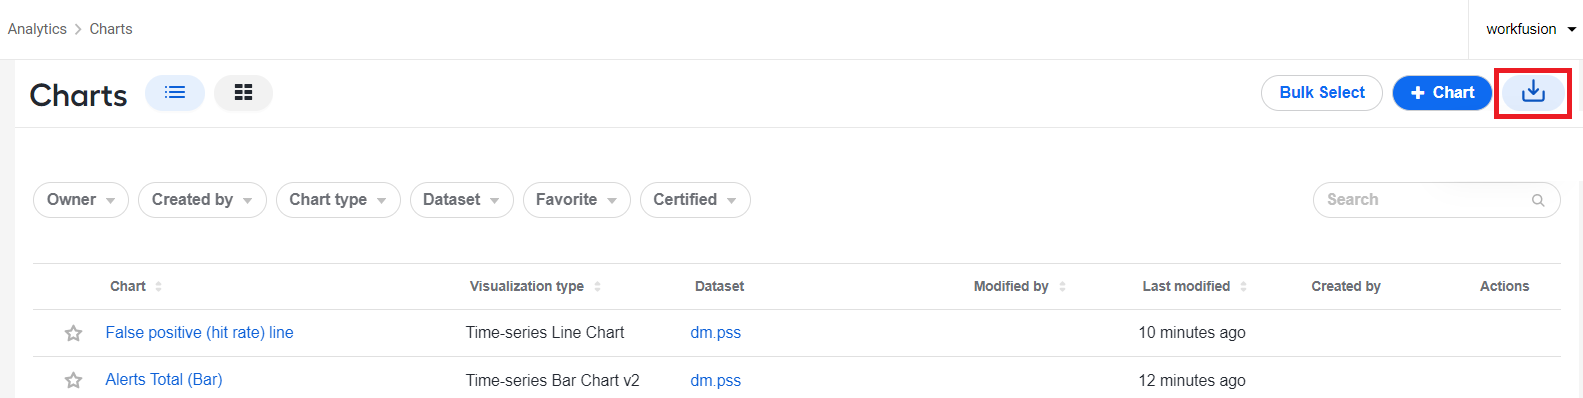
To import a chart, navigate to Analytics > Charts and click the Import button. In the displayed popup, select a file saved on your computer and click Upload.
Migrate dashboards
To export a dashboard, do the following:
Navigate to Analytics > Dashboards, and select a dashboard to export.
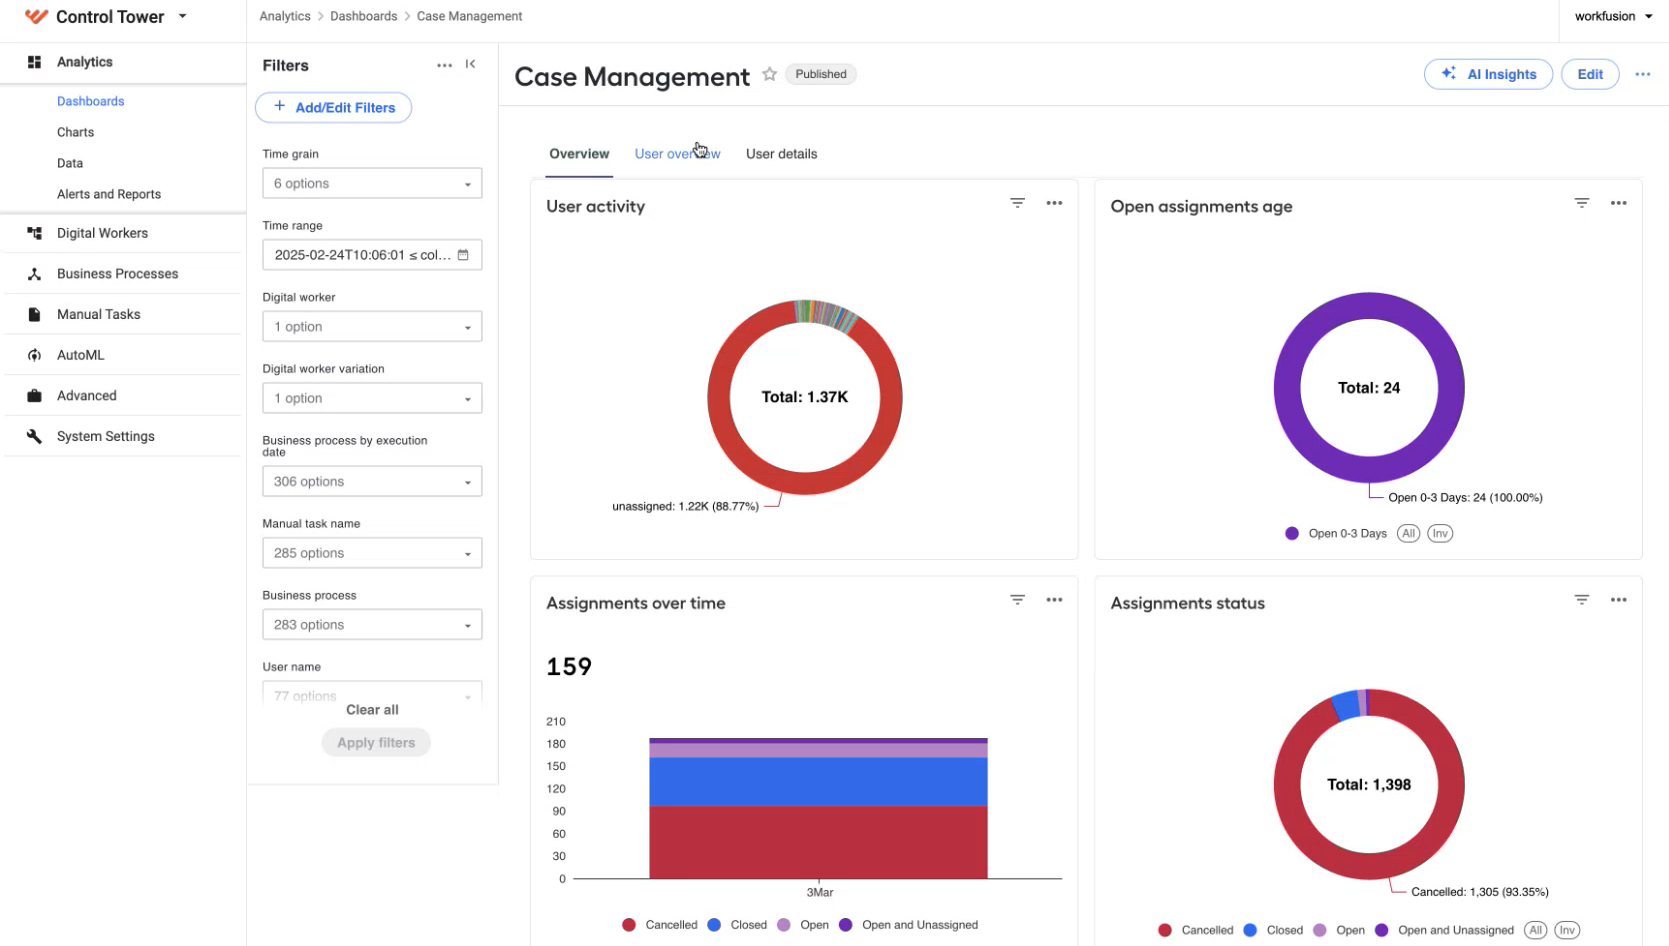
In the Actions column, click the Export button. The dashboard is saved as a JSON file to your computer. The exported dashboard will contain corresponding datasets and associated charts.
To select several dashboards for export, do the following:
On the Dashboards page, click Bulk select.
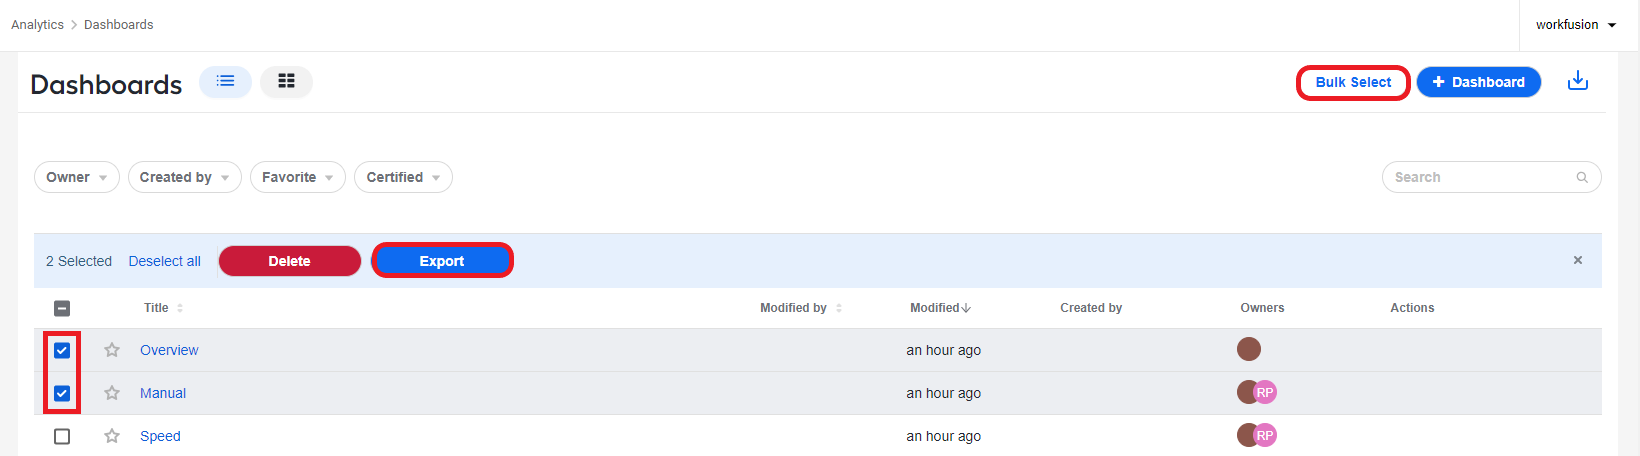
Choose the required dashboards and click Export. The dashboards are saved as JSON files on your computer.
To import a dashboard, do the following:
In the target environment, on the Dashboards page, click Import.
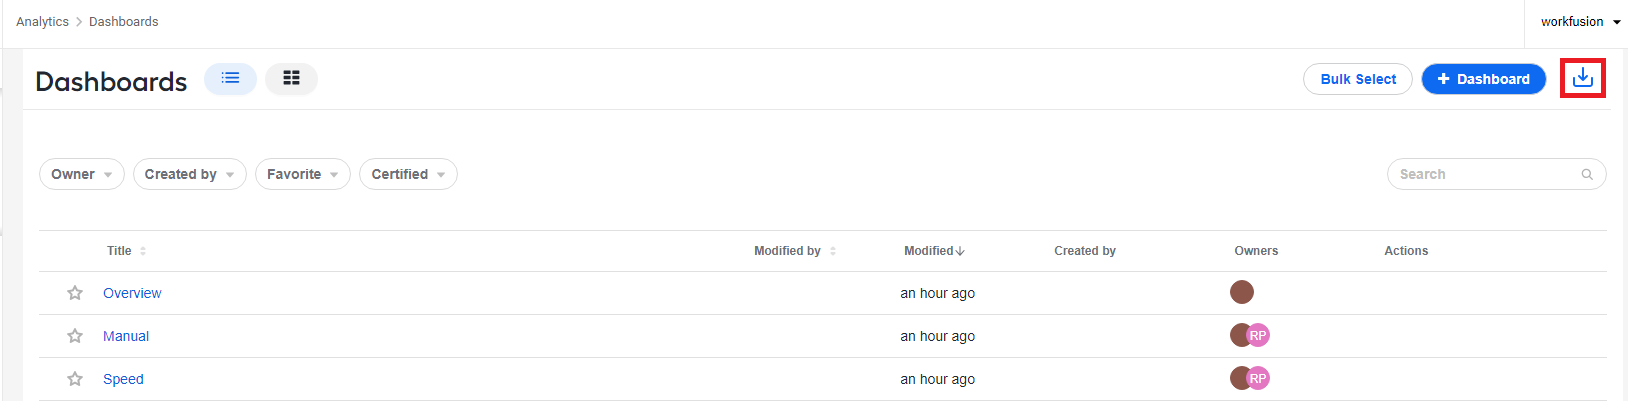
On the Import dashboard window, click Select file, then select the saved dashboard JSON on your computer.

Click Import.
You can only import one dashboard at a time.