Learn about analytics in WorkFusion
To monitor process metrics, Work.AI offers Superset-based Analytics installed together with the Product. To start working with it, you only need to configure access for users. It does not require any additional third-party licenses and provides the following capabilities:
Visualize and monitor process metrics with a set of out-of-the-box (OOTB) dashboards
Create custom dashboards and various chart types, for instance, heatmaps
Create and manage database connections for feeding analytical data
Create and manage analytics datasets
Create and manage reports and alerts
Access Superset-based Analytics
To access the Superset Analytics capabilities, log into Control Tower and open the Analytics menu.
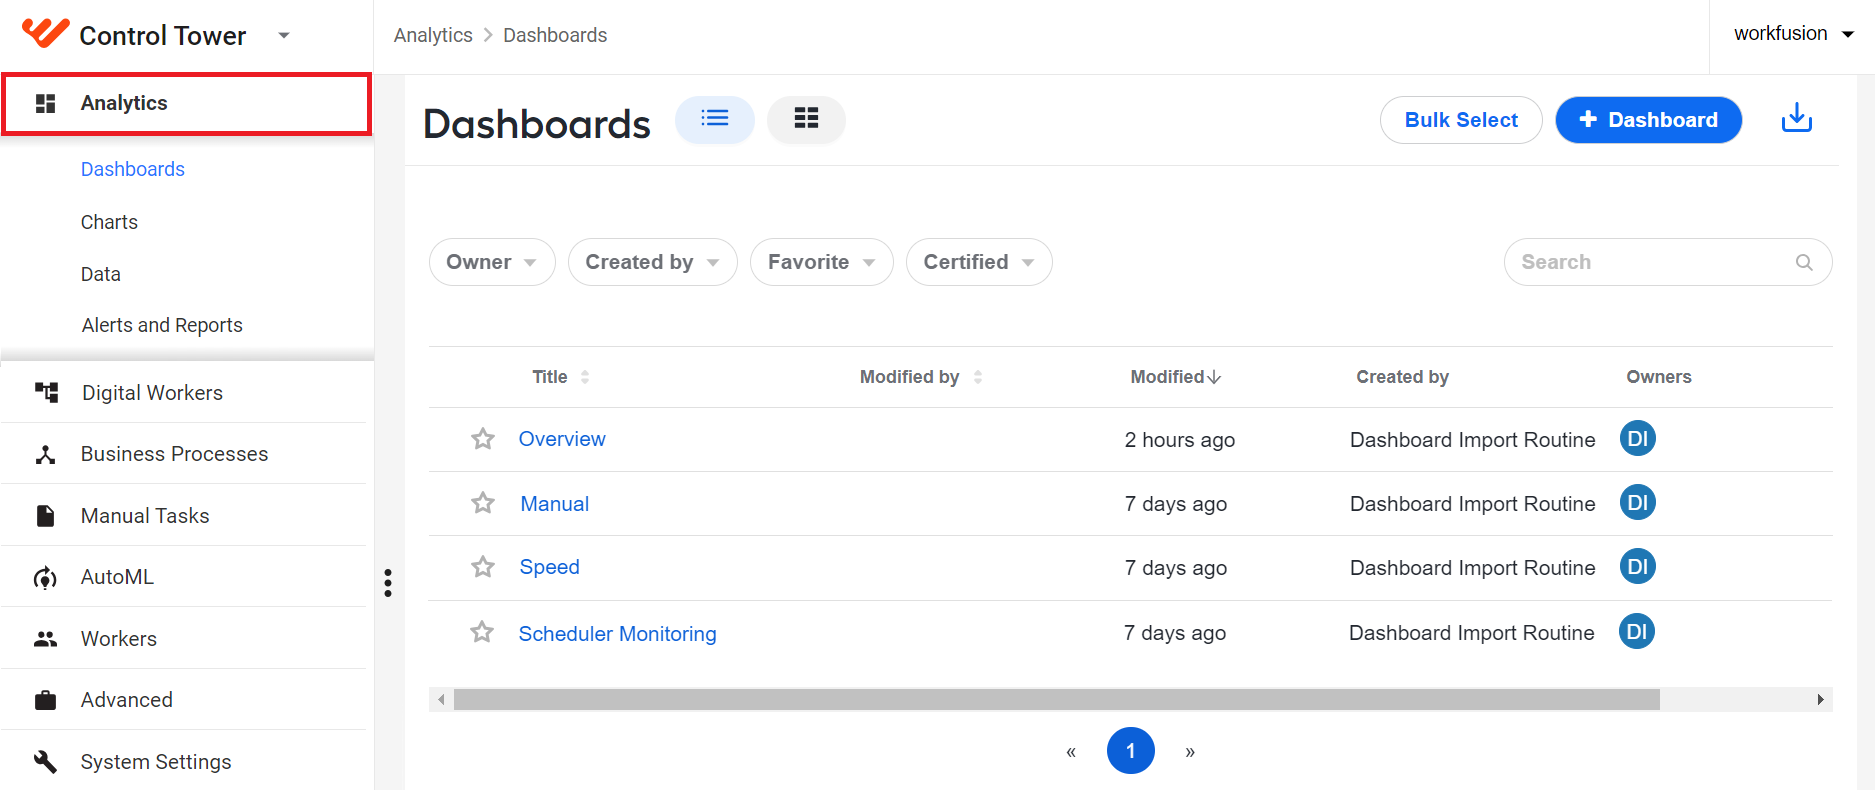
If any of the Analytics menu items (Dashboards, Charts, Data, Reports & Alerts) are unavailable on your instance, check whether your role and permissions allow accessing them.
Out of the box, WorkFusion gives you access to the following Superset-based dashboards:
To cater for your business needs, you can also create custom dashboards from scratch or by copying and altering the OOTB ones. For details, refer to Create custom dashboards.
Aggregate data with ETL procedures
WorkFusion Analytics uses an ETL procedure (etl_#sp_process) to aggregate the dm layer data. To set the aggregation to run automatically, our product offers an out-of-the-box ETL Scheduler.
By default, the Scheduler is set to run the etl_#sp_process ETL procedure every 15 minutes. To create your own ETL procedure under the dm schema and schedule it via Control Tower, follow the steps below:
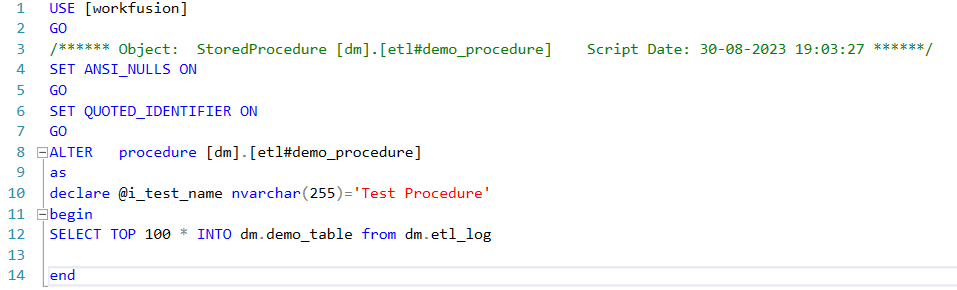
Create a procedure that starts with etl# (for example, etl#demo_procedure). This is the naming convention to help identify the procedures under the dm schema from those meant for the ct one.
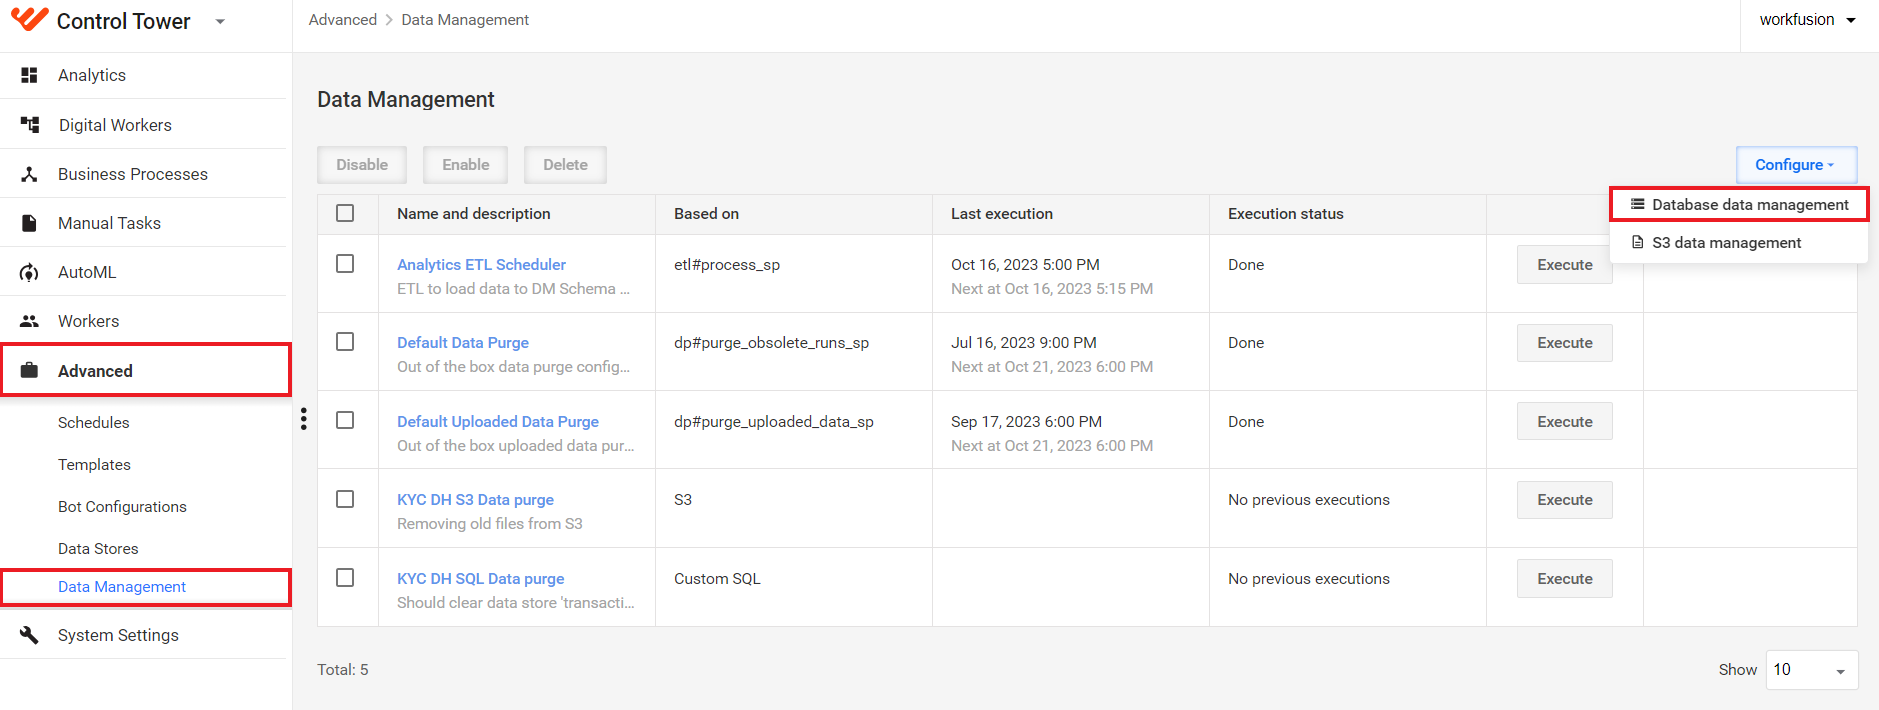
Go to Advanced > Data Management, click Configure, and select Database data management.
In the Database data management configuration window, specify the name and description.
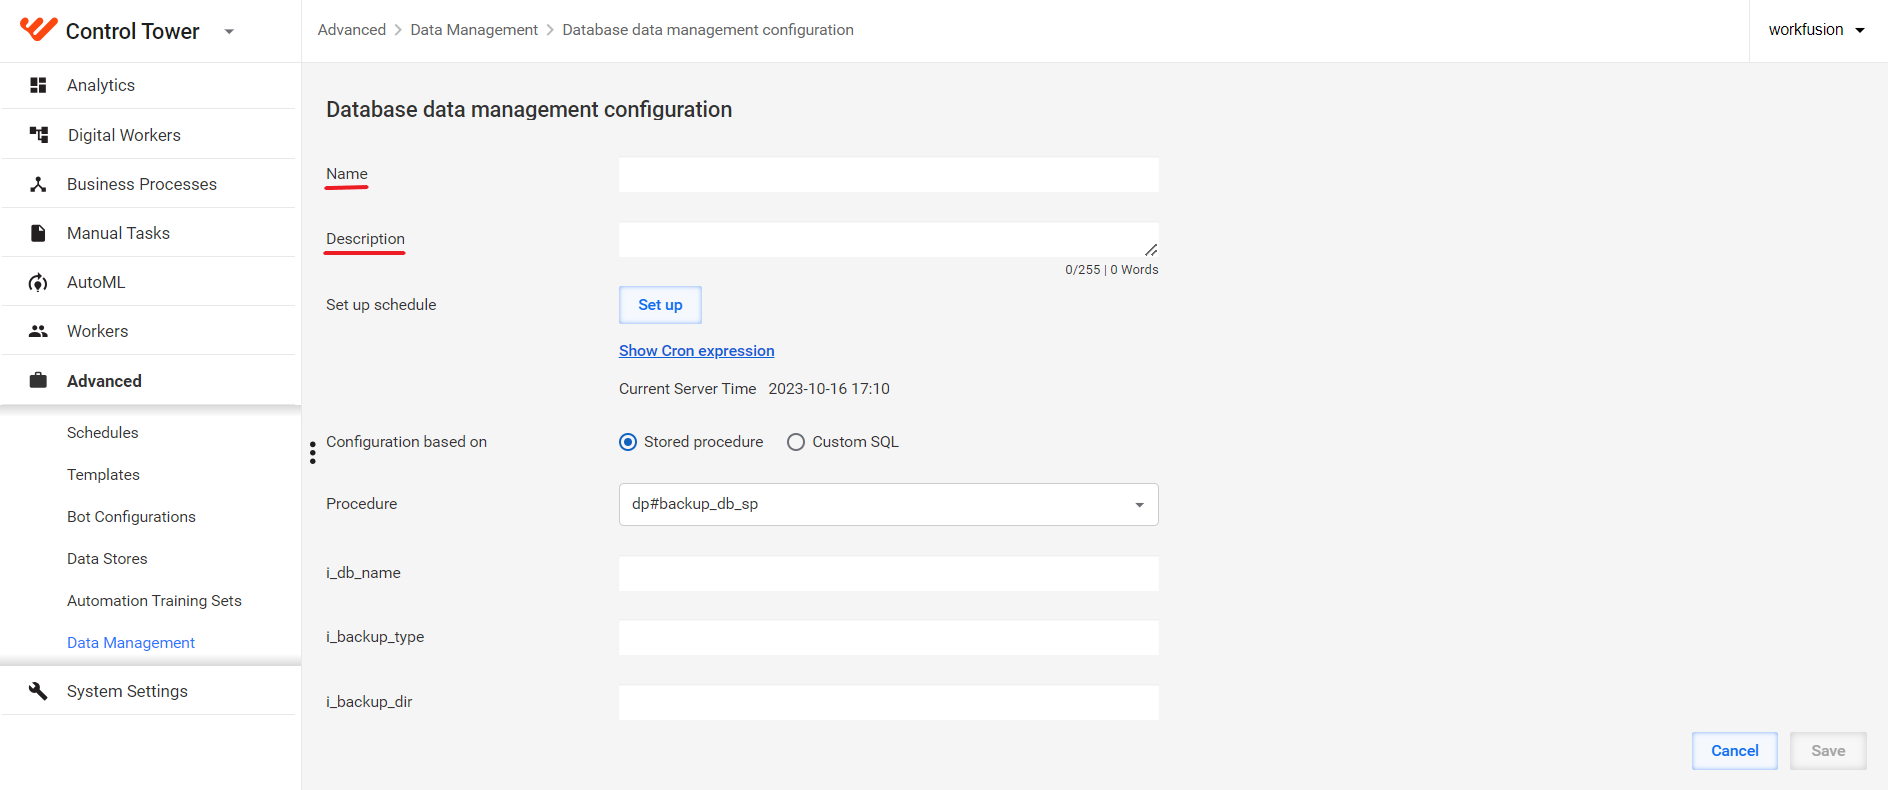
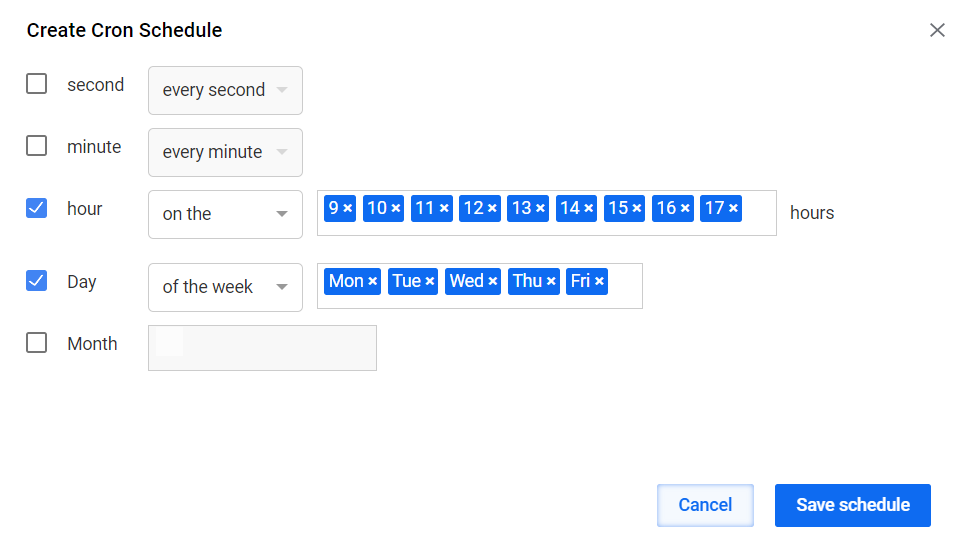
To schedule the procedure execution, click the Set up button. Once the setup is over, click Save schedule.
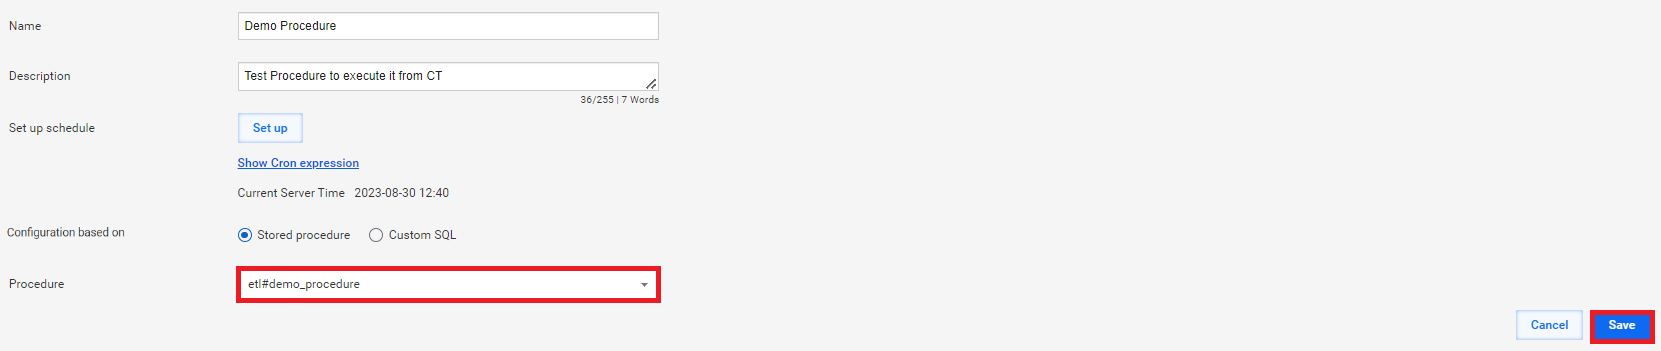
In the Procedure drop-down box, select the name of the procedure created in Step 1 and specify its parameters. Then, click Save.
Go back to the Data Management page, select the checkbox next to the newly created configuration, and click Enable.
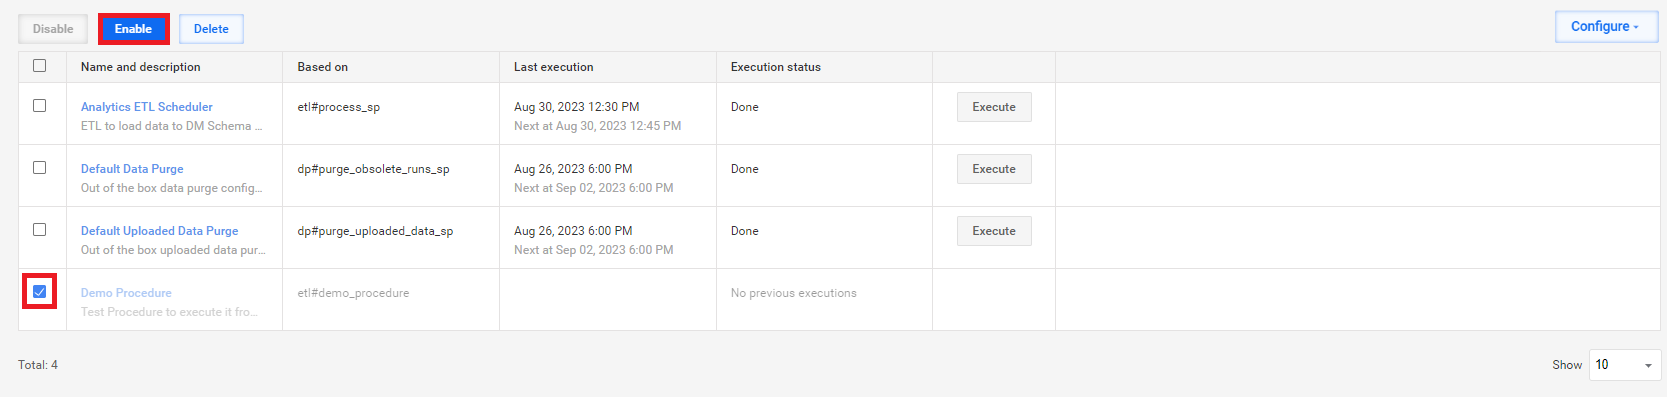
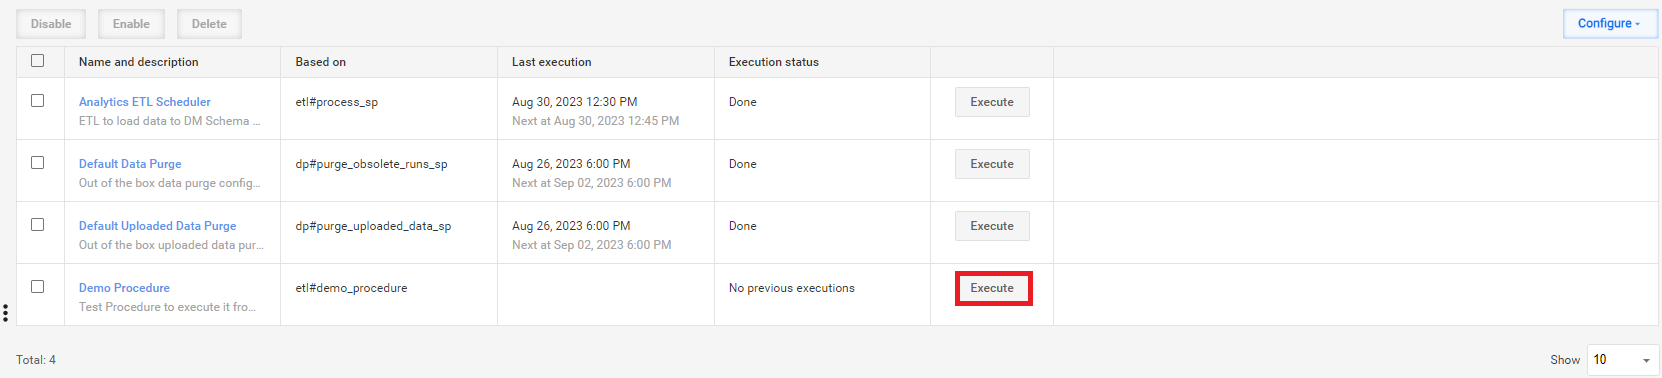
For the first time, to test whether the procedure is working, click Execute to launch it manually.
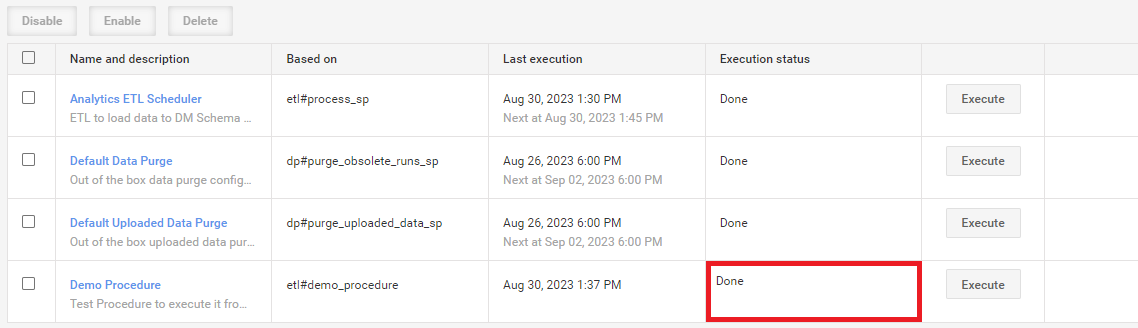
If the procedure is executed successfully, the Execution status column has the Done status.
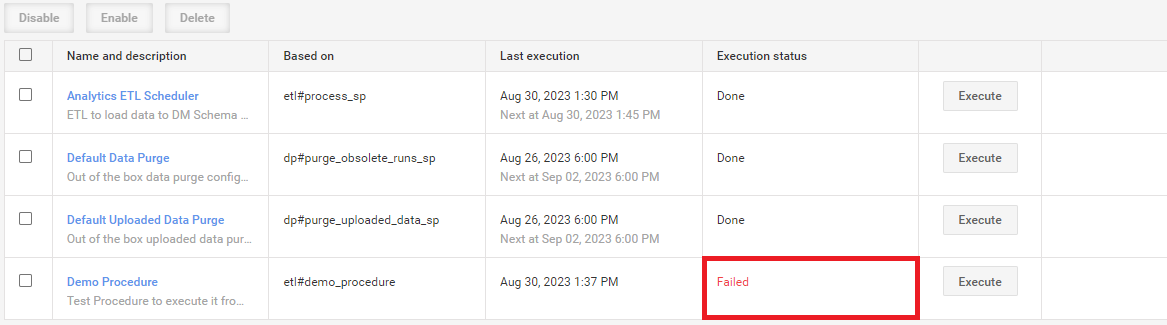
If any errors occur during the execution, the status is Failed.
Filter dashboard data
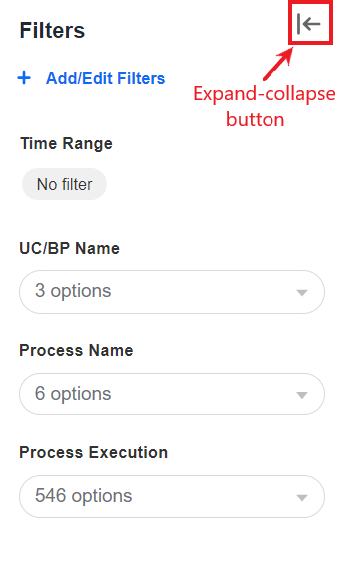
To filter data on OOTB dashboards, use the Filters panel to the left of dashboard views. You can show or hide the panel by clicking the expand-collapse button.
Set filters
OOTB dashboards feature a set of the following default filters:
Time Range
Available for the following OOTB dashboards: Overview, Manual, Speed, Scheduler Monitoring
The filter limits the display of process execution data to a specific period. To set the filter, follow the steps below:
Click the button below the filter name (in the default state, No filter).
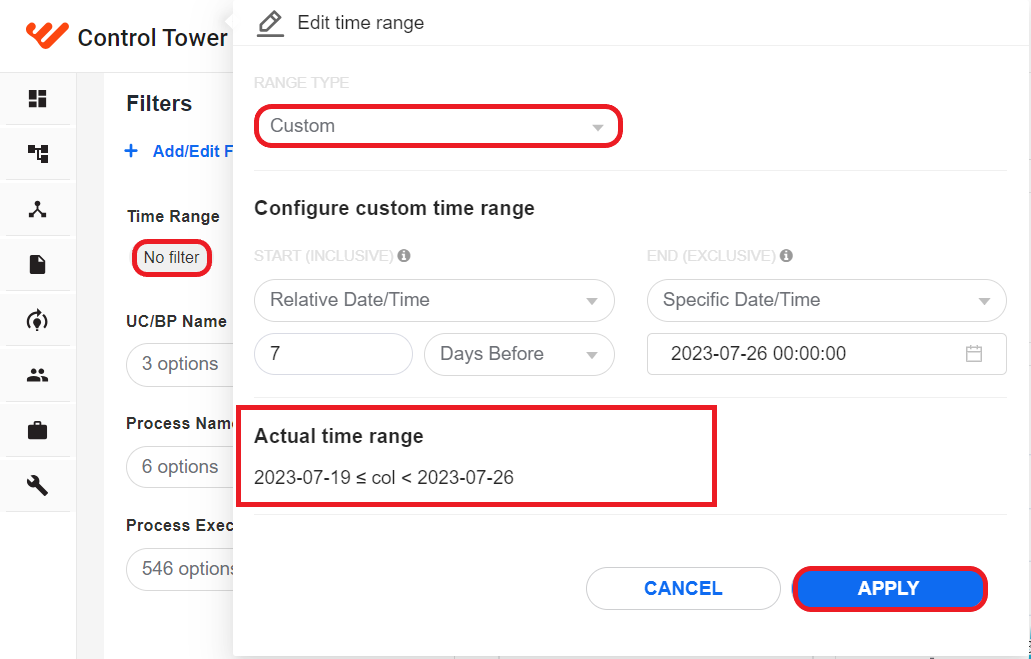
In the Edit time range window, select a time range type and configure required settings. The settings can differ, depending on the selected range type.
The Actual time range section will display the resulting time range.
Click Apply to update the filter settings. The filtering time range becomes visible on the button in the Filters panel.

Time Grain
Available for the following OOTB dashboards: Manual only
The filter allows you to customize the representation of the time-dependent data within the specified time range across all views. The grain you set is the time interval corresponding to a single point in a view.
To set the filter, select any value from the drop-down options.

UC/BP Name
Available for the following OOTB dashboards: Overview, Manual, Speed
The filter limits the displayed data to a specific group of Business Processes: related to a particular AI Agent or its skill or not related to those (from the Other group).
To set the filter, choose any option from the drop-down box. Any choice that you make in the field also affects the number of available options for the Process Name and Process Execution filters.

Process Name
Available for the following OOTB dashboards: Overview, Manual, Speed
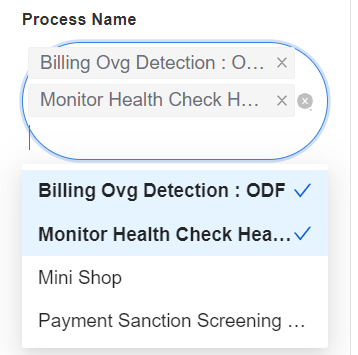
The filter limits the displayed data to one or more specific Business Processes available under the group you selected in the UC/BP Name filter. To set the filter, click the drop-down box and choose one or more options.
Business Process name
Available for the following OOTB dashboards: Scheduler monitoring only
The filter limits the displayed data to one or more Business Processes with a preset schedule. To set the filter, click the drop-down box and choose one or more options.

Process Execution
Available for the following OOTB dashboards: Overview, Manual, Speed
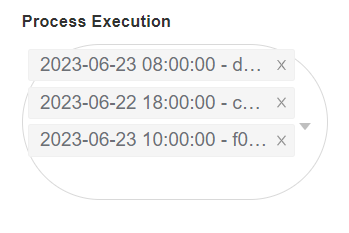
The filter limits the displayed data to one or more Business Process runs available for the group you selected in the UC/BP Name filter.
To set the filter, click the drop-down box and choose one or more options.
Task Name
Available for the following OOTB dashboards: Manual only
The filter allows restricting the data display on the dashboard to a single task selected by the name in the dropdown.
To set the filter, click the drop-down box and choose one or more options.

Detailed by
Available for the following OOTB dashboards: Speed only
The filter allows detailing the data representation in the views based on selected criteria. To set the filter, click the drop-down box and choose an option.

Target Table
Available for the following OOTB dashboards: Scheduler monitoring only
The filter restricts the data display to one or more dm schema database tables covered by ETL Scheduler. To set the filter, click the drop-down box and choose one or more options.

Business Process Status
Available for the following OOTB dashboards: Scheduler monitoring only
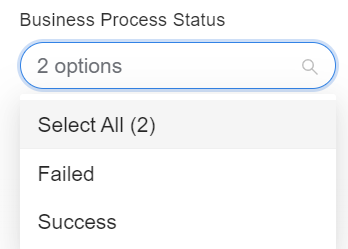
The filter limits the displayed data to scheduled Business Processes with a specific status: Failed, Success, or both. To set the filter, click the drop-down box and choose an option.
Apply preset filters
To apply preset filters, click Apply Filters on the Filters panel.
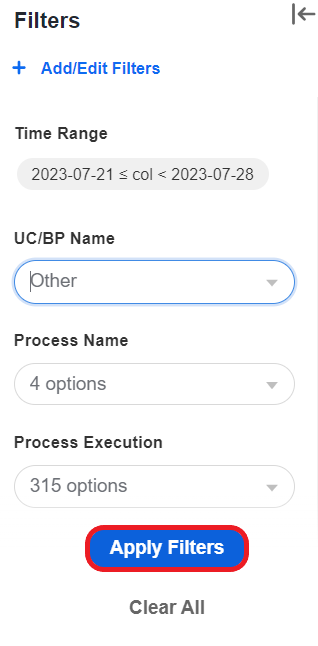
The views on the right will change and display data in accordance with filtering criteria. In the corner of each view, you can see indications with the quantity of applied filters.
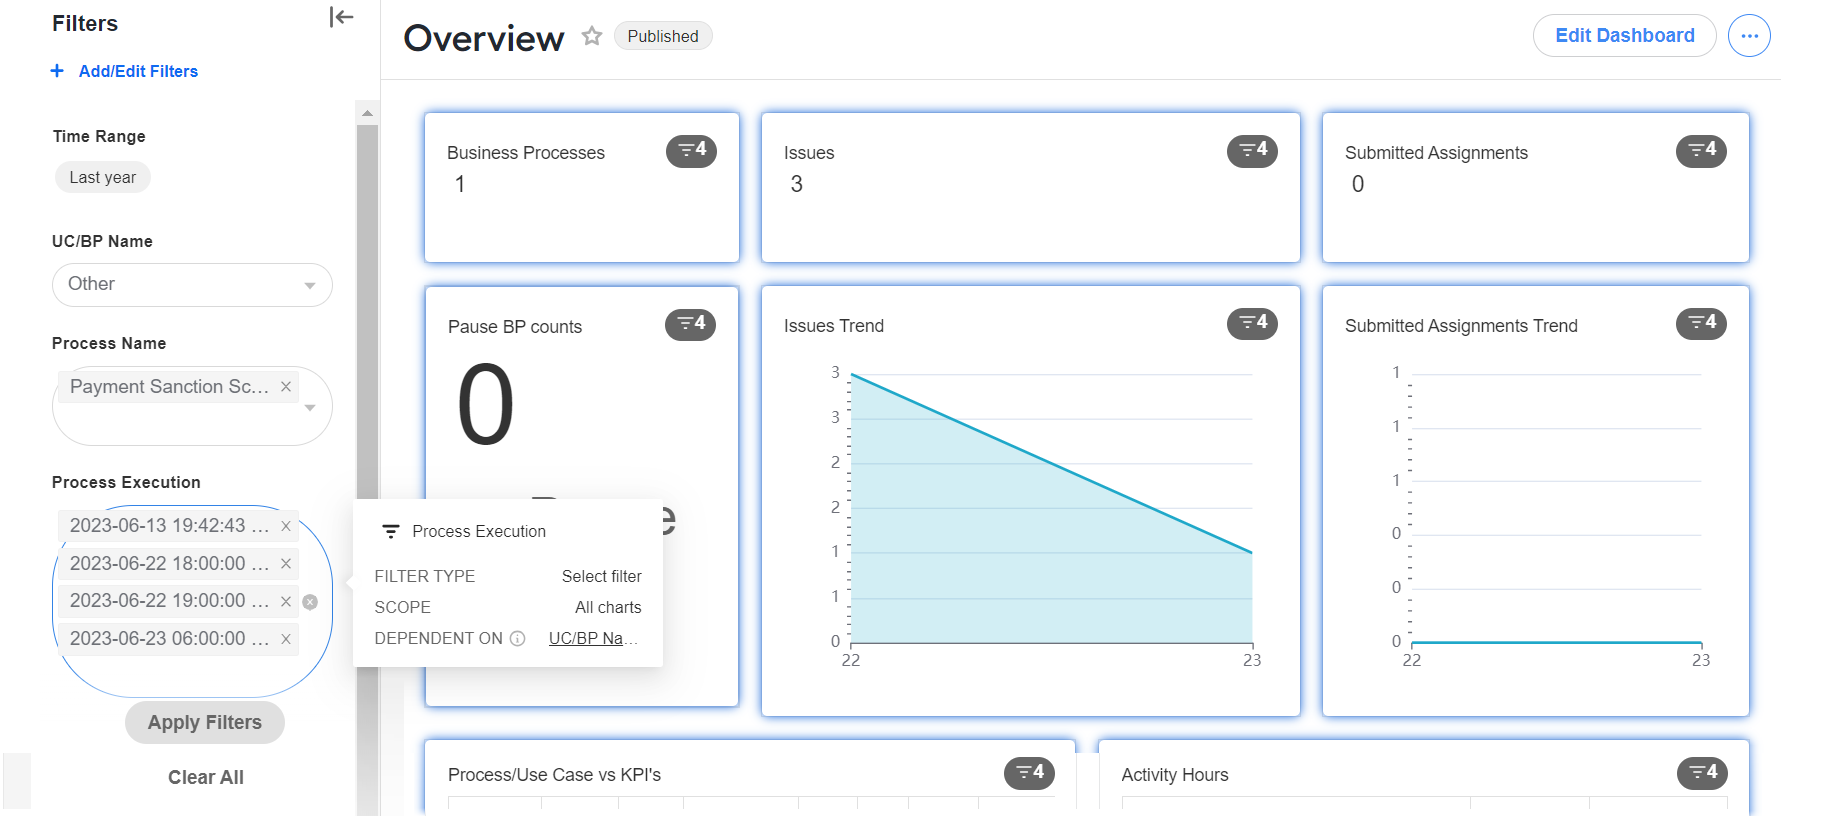
You can also hover over the filter settings in the Filters panel and see their type, scope, and dependencies.
To cancel any applied filtering, click the Clear All button.
Edit filters
To edit a filter on a dashboard page, follow the steps below:
At the top of the Filters panel, click + Add/Edit Filters.

In the displayed window, select a filter you want to edit. You can change the following:
On the Settings page: filter configuration options that can vary from one filter to another.
On the Scoping page: what dashboard views are affected by applying the filter.
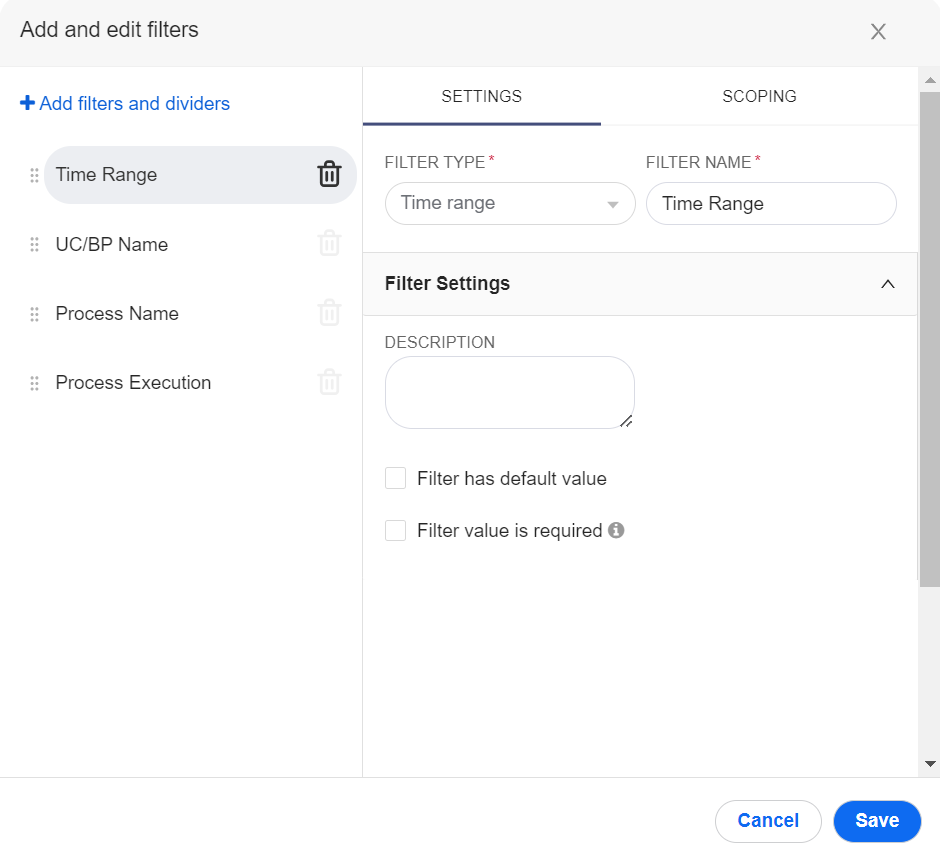
Click Save to update the filter.
Add or remove filters
In addition to the existing default filters, you can set up custom ones. To do that, follow the steps below:
At the top of the Filters panel, click + Add/Edit Filters.
In the displayed window, click Add filters and dividers. A new untitled filter is added to the list.
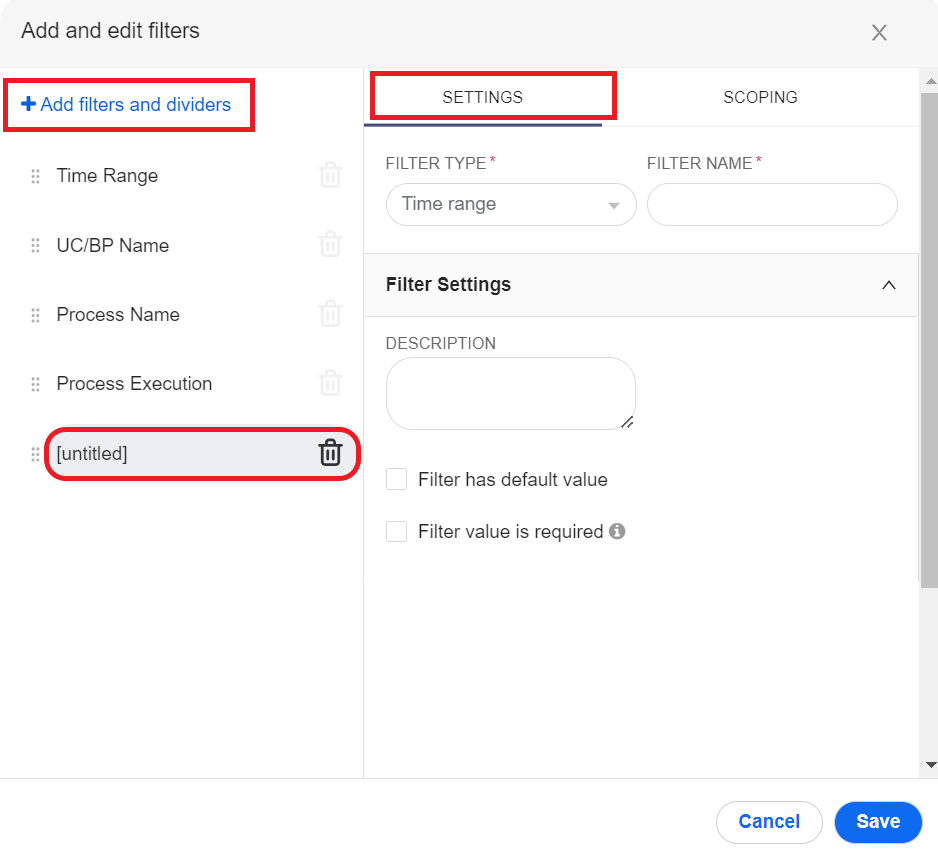
On the SETTINGS tab, set a name for the filter, select its type, and configure other settings. The configuration options can differ, depending on the selected filter type.
On the SCOPING tab, specify the dashboard views to be affected by applying the filter. By default, any new filter is applied to all views.
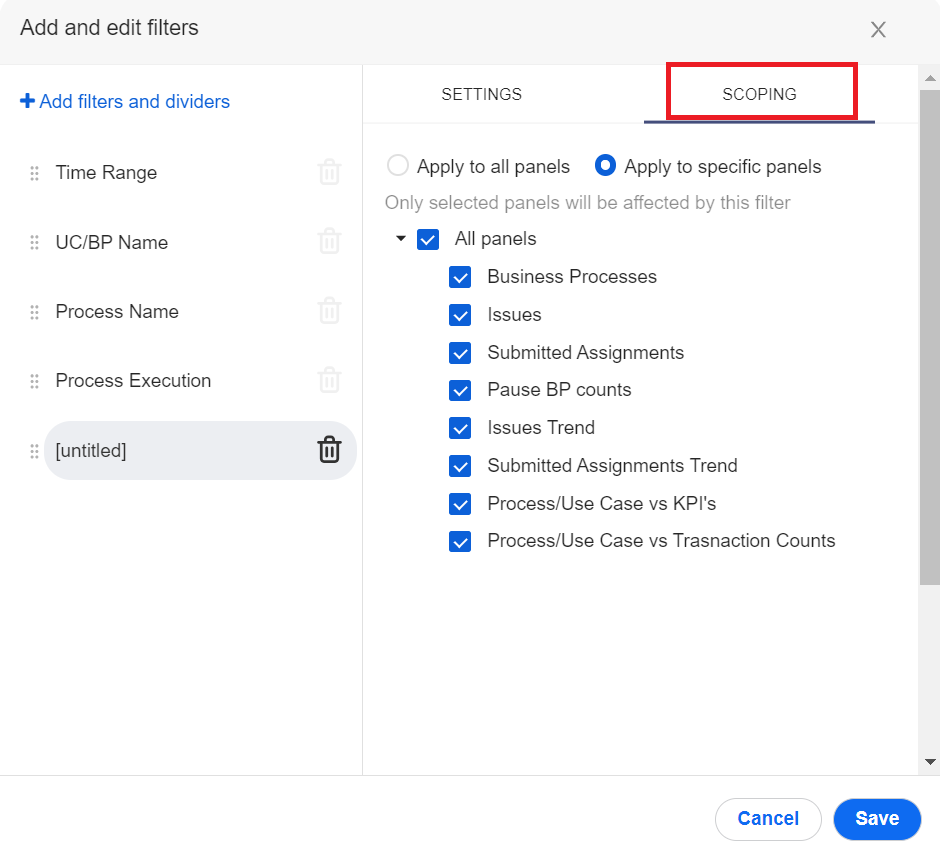
Click the Save button. The new filter appears on the Filters panel.
To remove a filter, follow the steps:
At the top of the Filters panel, click + Add/Edit Filters.
In the displayed window, hover over the filter you want to delete and click the Delete button.
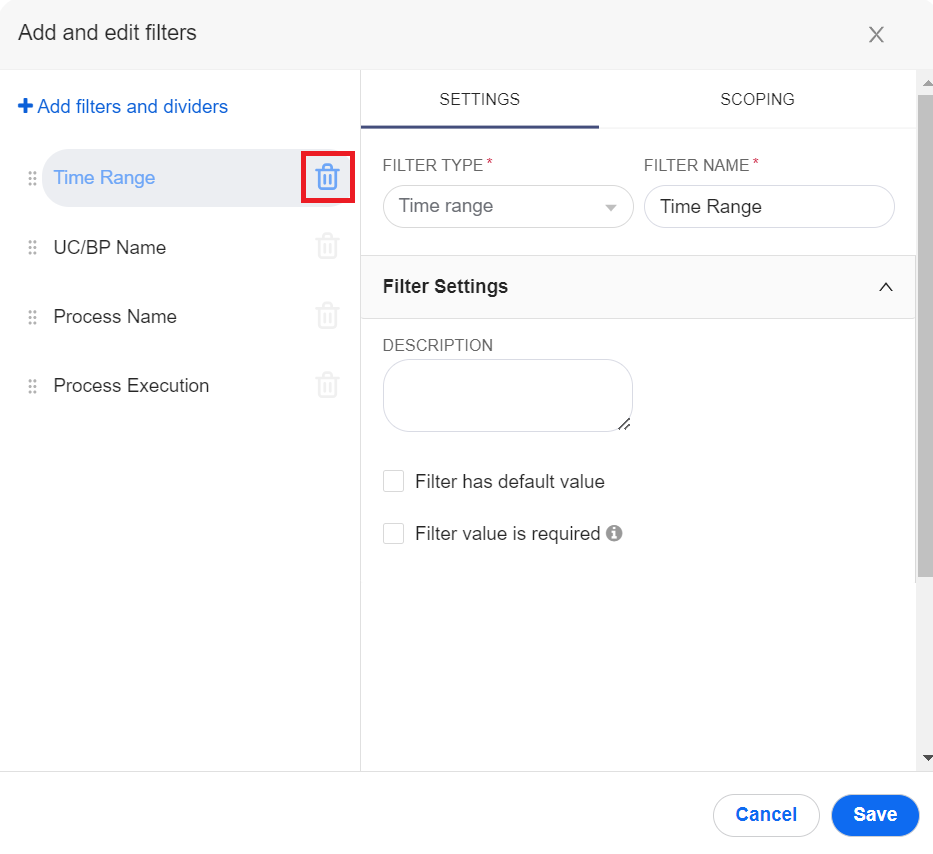
Click the Save button. The new filter is removed from the Filters panel.
Monitor analytics interactions in Kibana
Kibana features a set of logs capturing the following:
User interactions with WorkFusion Analytics
Data from user interactions
API calls to the analytics component and their results
To access the logs, follow the steps below:
Log into Control Tower and, in the top left application menu, choose Platform monitor.

In Kibana, in the Application logs section, find the Superset header and click it.
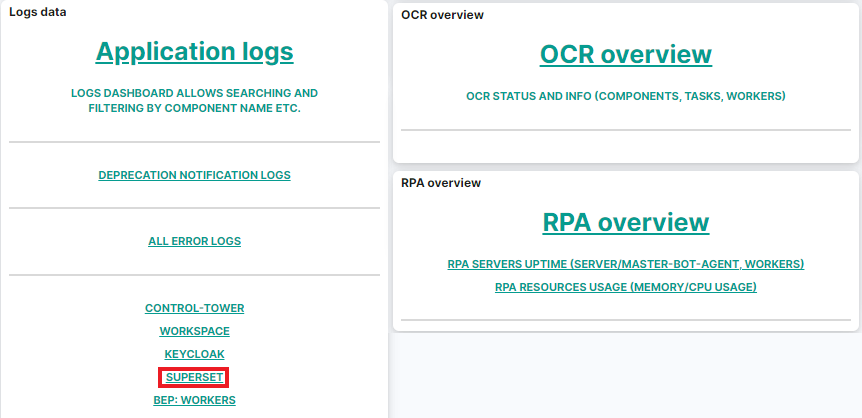
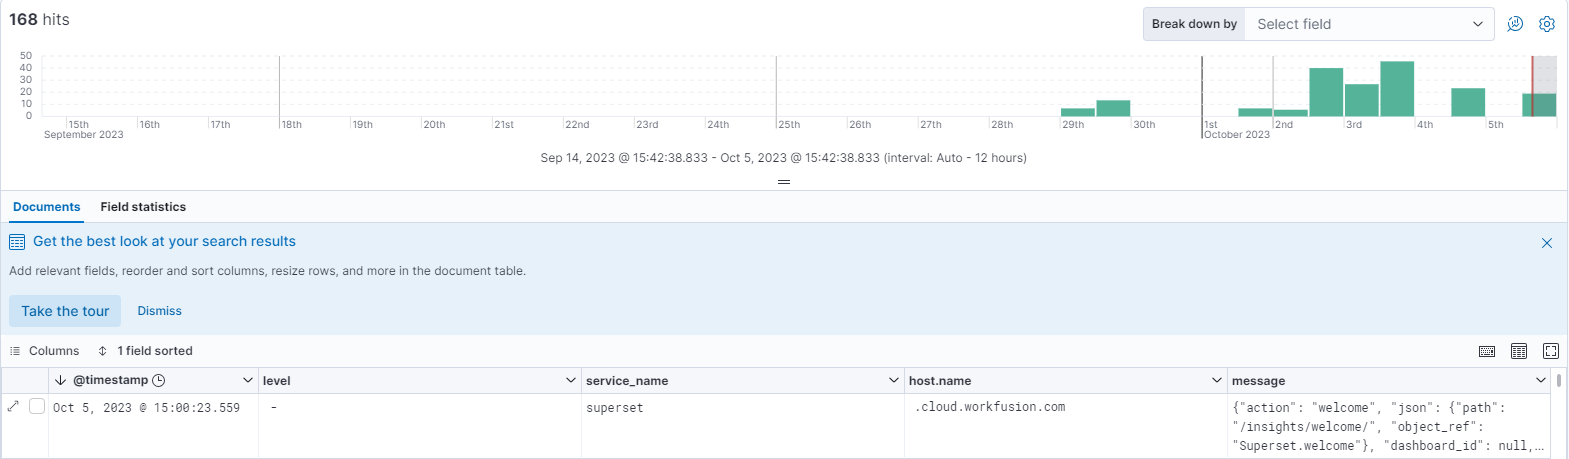
On the displayed page, you see the interaction data as shown below: