Set up alerts and reports
To assist you in real-time process monitoring, analyzing data, and presenting it effectively, WorkFusion Analytics offers the following tools:
Reports to craft various interactive performance and process data visualizations to match your business needs.
Alerts to automatically monitor critical automation-related data and KPIs and respond promptly to their changes.
To use the alerting and reporting functionality, comply with the following requirements:
Your administrator must enable the feature at installation. For details, see Enable alerts and reports.
Make sure you have the Alerts and Reports permission enabled for your role on the Role Management page in Control Tower. Mind that the permission is only available when you enabled the Alerts and Reports feature at installation. For details on enabling the permission, read Manage Control Tower roles and permissions.
Make sure the SMTP server is configured correctly to provide proper communication with WorkFusion analytics. For instruction, read Manage realm settings | Configure SMTP server.
To access the tools, log in to Control Tower and navigate to Analytics > Alerts and Reports.
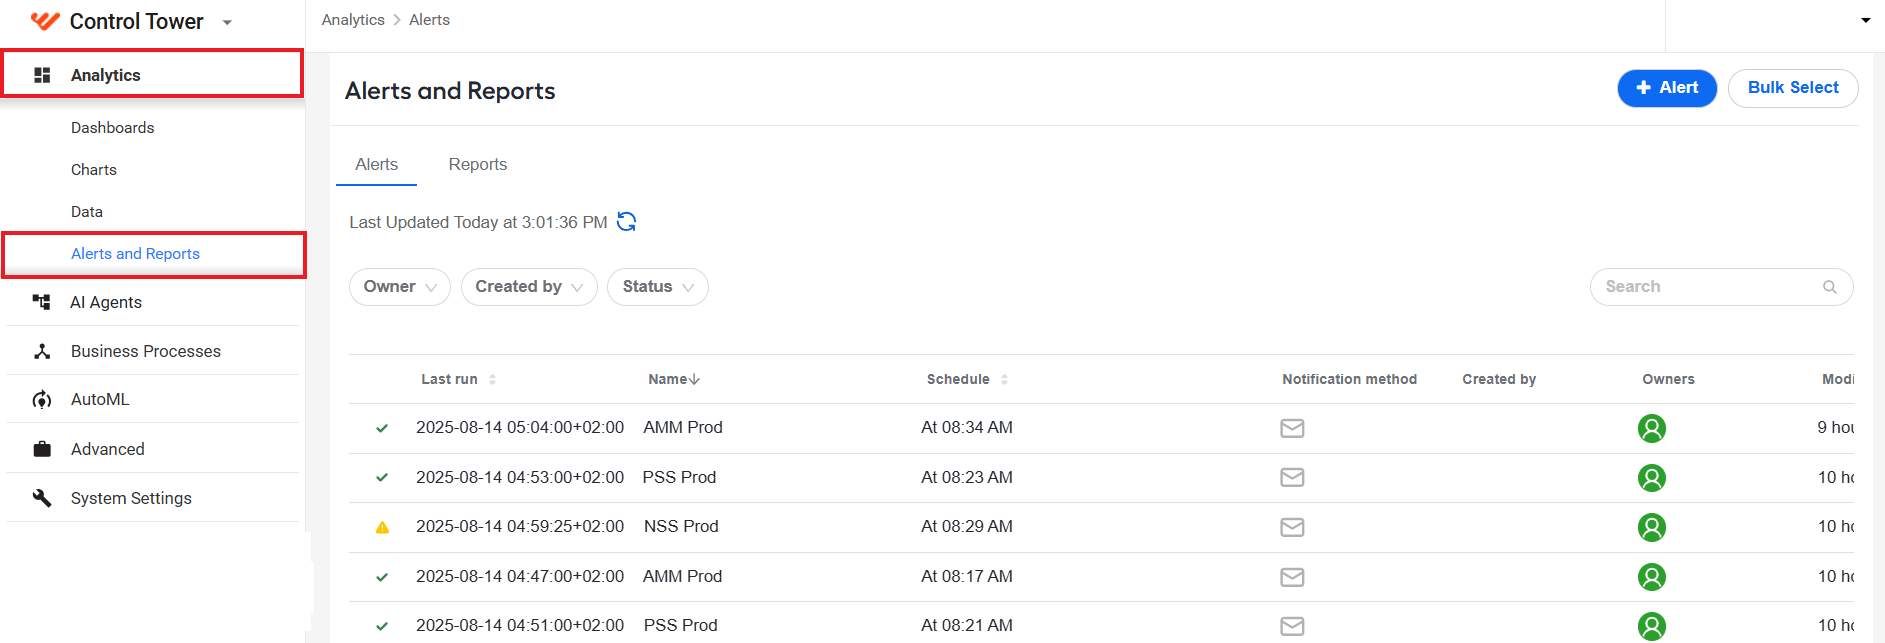
The Alerts and Reports functionality can come in handy to investigate, for instance, the following use cases:
How effective your automation rate is, and what are the trends on a monthly, weekly, or daily basis.
How efficient your team is in terms of resolving cases with a human-in-the-loop bucket.
How efficient your Business Processes (BP) are.
How much time is saved by automating your BPs with WorkFusion.
Whether you need to upgrade your licenses based on OCR usage or the number of transactions within the contract limit.
Enable alerts and reports
To enable alerts and reports, perform the following actions at installation:
In the
config_overide.ymlfile, add the following variables:analytics_alerts_enabled: true <If true, Alerts and Reports are enabled>
analytics_alerts_smtp_host: localhost <SMTP host name>
analytics_alerts_smtp_port: 587 <SMTP PORT>
analytics_alerts_smtp_starttls: false <This should be true when ttls configured on smtp>
analytics_alerts_smtp_ssl_server_auth: false <When using an SMTP server with a valid certificate>
analytics_alerts_smtp_ssl: false
analytics_alerts_smtp_username: '' <Add the empty string "" if you use an unauthenticated SMTP server>
analytics_alerts_smtp_password: '' <Add the empty string "" if you use an unauthenticated SMTP server>
analytics_alerts_smtp_mail_from: donot-reply@workfusion.com <The mail name it should send from>Run the following command:
./install.sh configure workfusion -e @config_overrides.yml
The IP address of your instance must be whitelisted on the SMTP server.
Manage alerts
From the Alerts tab, you can configure how WorkFusion should keep you updated on changes in essential metrics. You can receive the updates to your email box and view them without logging in to Control Tower.
To set up alerts, you need basic knowledge of the SQL syntax.
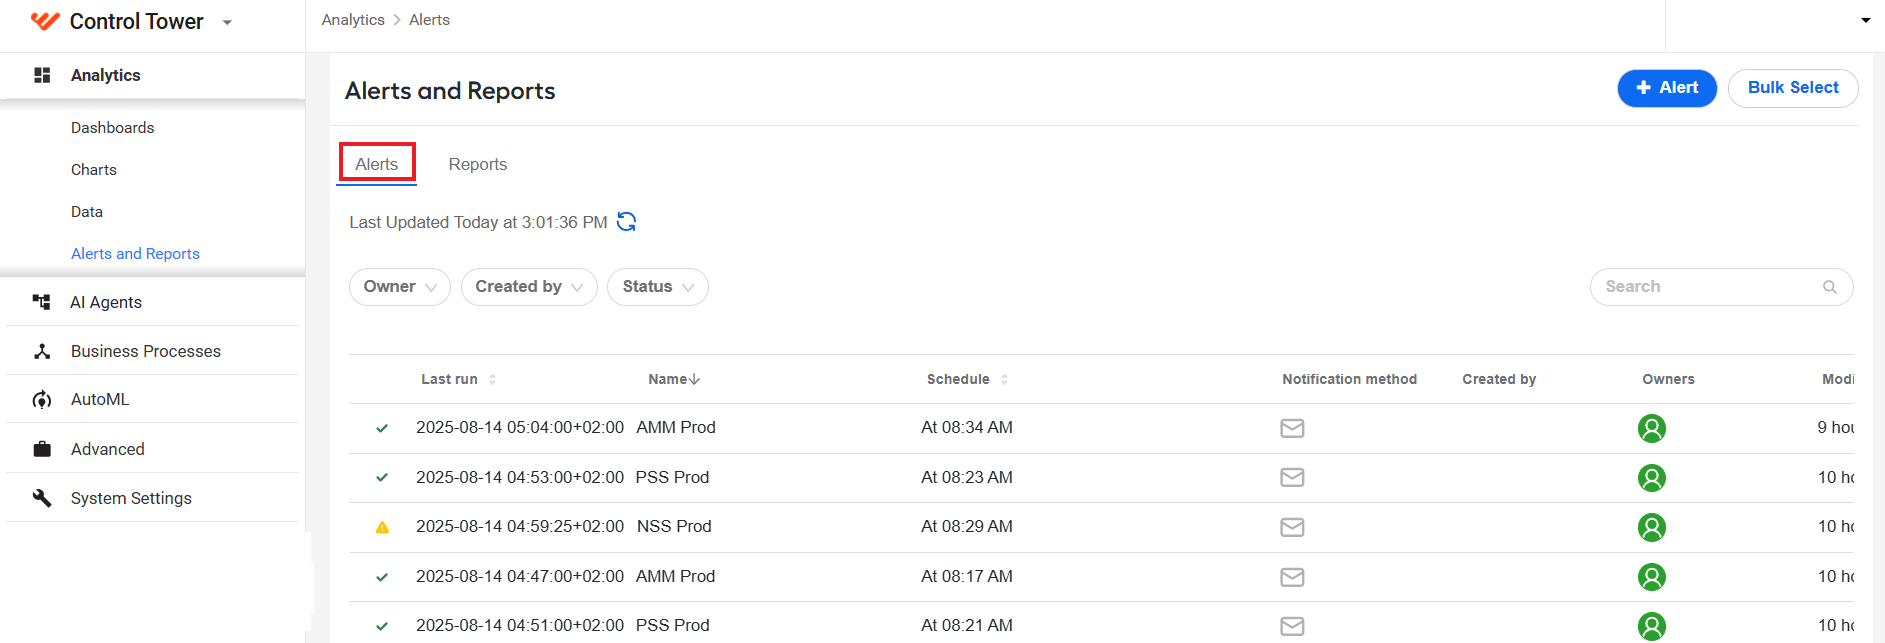
The Alerts tab contains a list of configured alerts (if any) together with related details. From here, you can also perform a number of actions:
Create alert
To create an alert, follow the steps below:
On the Alerts tab, click + Alert.
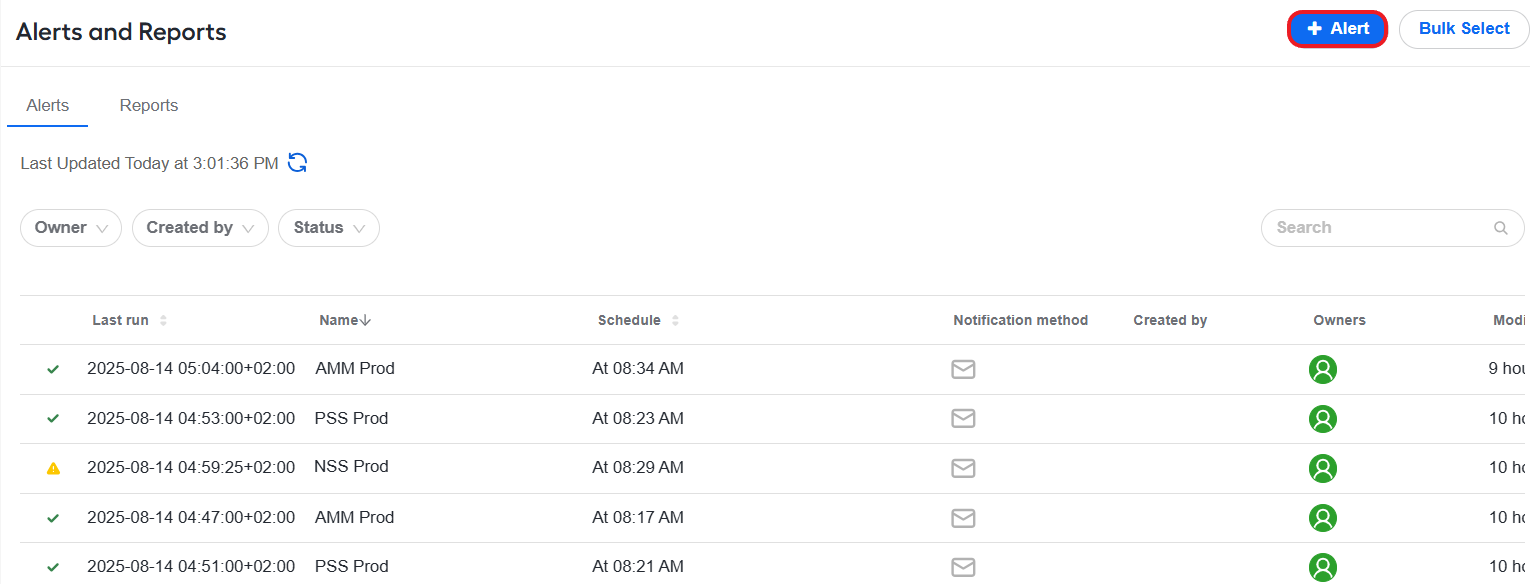
In the Add Alert dialog, specify a name for the alert, making sure you can easily identify the alert by it.
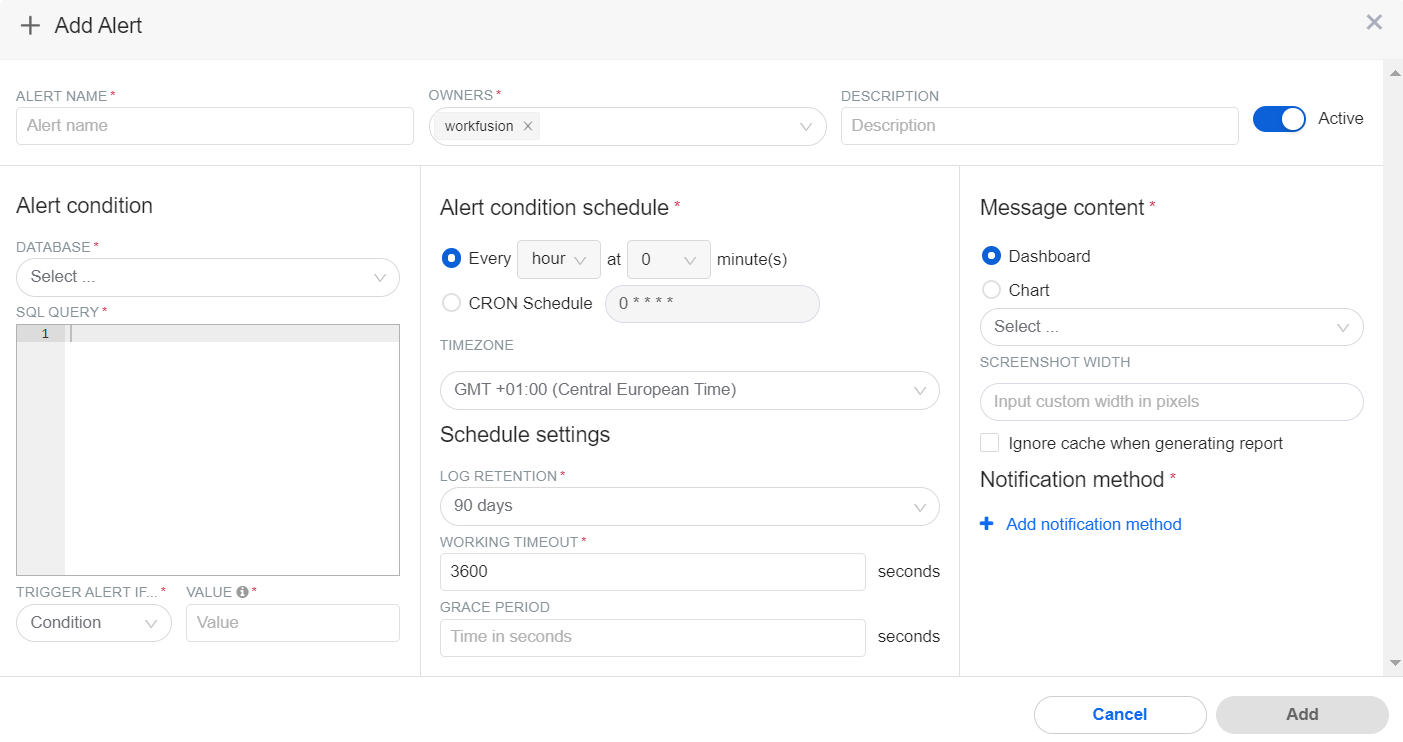
Set the alert's condition:
In the DATABASE field, choose MS SQL Server.
Add an SQL query defining the alert action.
Set values in the TRIGGER ALERT IF... and VALUE fields to define the alert's triggering condition.
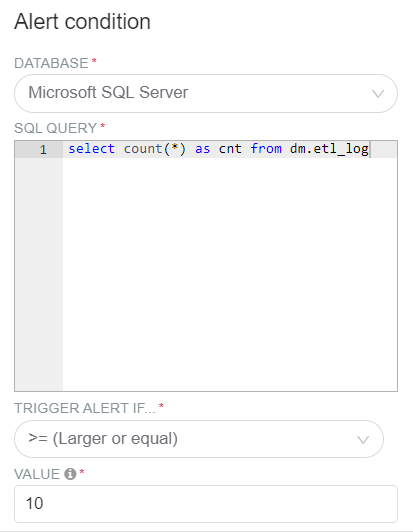
Set a schedule for checking the alert conditions against the analytics data:
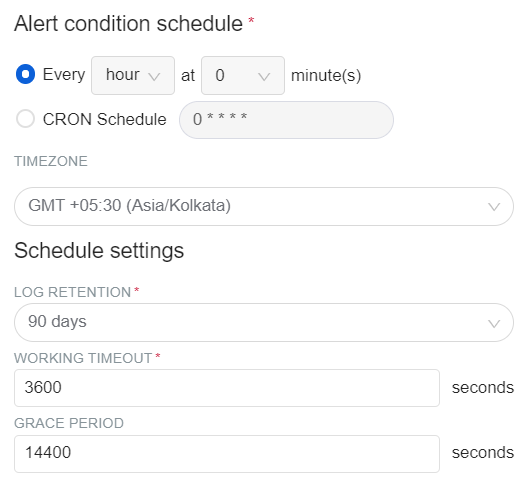
In the Alert condition schedule section, specify an interval for running alert jobs by selecting hours and minutes from respective drop-down boxes or setting a CRON schedule.
In the LOG RETENTION field, specify how long (in days) the alert is to be stored in the execution log. By default, the value is set to 90 days.
In the WORKING TIMEOUT field, specify how long (in seconds) the alert job runs before it is timed out automatically. By default, the value is set to 3,600 seconds.
In the GRACE field, specify the delay (in seconds) before triggering the alert, relative to when a previous alert was triggered. If an alert triggers within this period, its status changes to On Grace, and the alert evaluation begins when the period is over. By default, the value is set to 14,400 seconds.
In the Message content section, configure the following settings:
Select the Dashboard or Chart radio button to choose at which level the alert content will be retrieved. Below the radio buttons, select a specific dashboard or chart.
noteThe Chart option is only available for users with the Administrator role.
Click Add notification method, select Email, and add one or more email addresses where the generated alerts are to be sent.
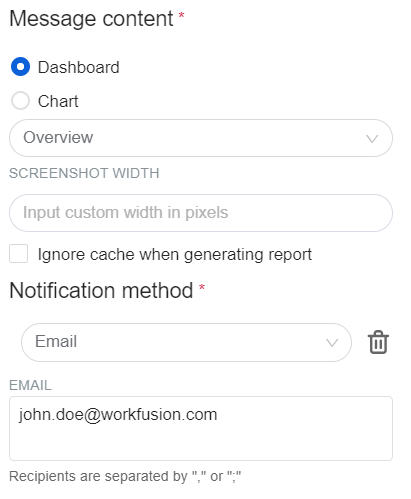
Click the Save button. The created alert appears on the Reports list in the active state (by default).
Activate or deactivate alert
After creating an alert, make sure it is in the active state. Otherwise, no alerts are generated or delivered by the chosen notification method.
You have two options to activate or deactivate an alert:
On the Alerts page, find the Active column and, on the line corresponding to the alert you want to activate or make inactive, switch on or off the activation toggle.
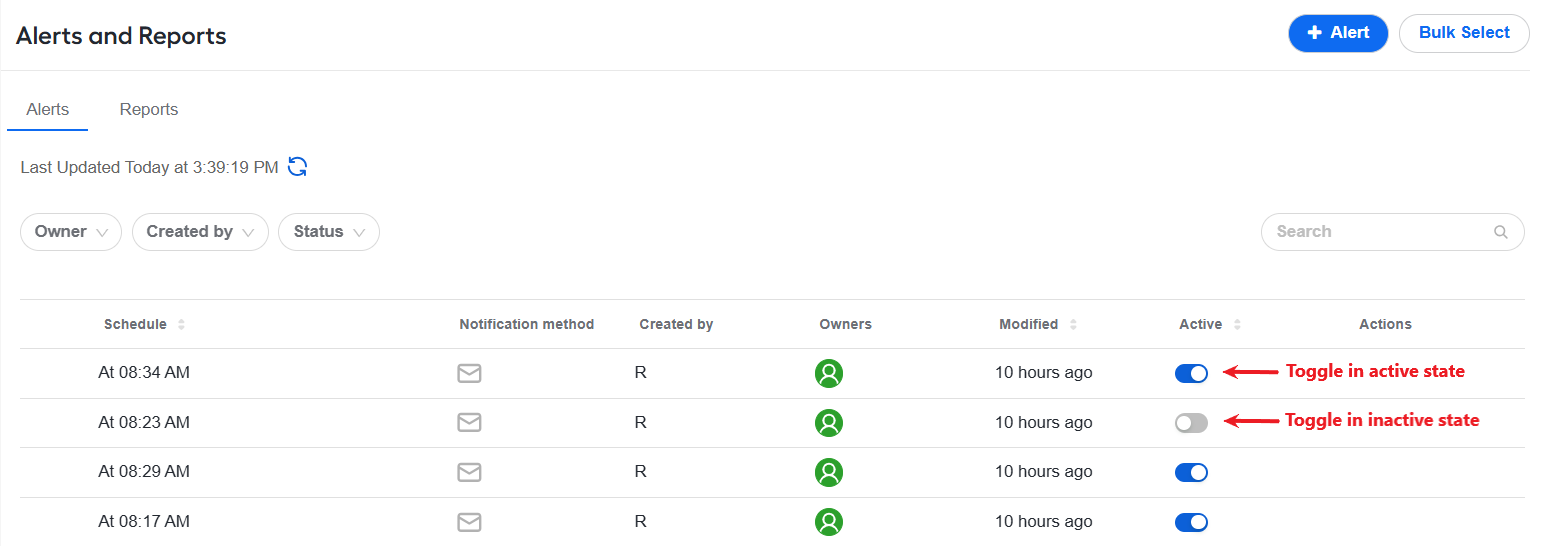
In the Add Alert dialog, switch on or off the Active toggle.
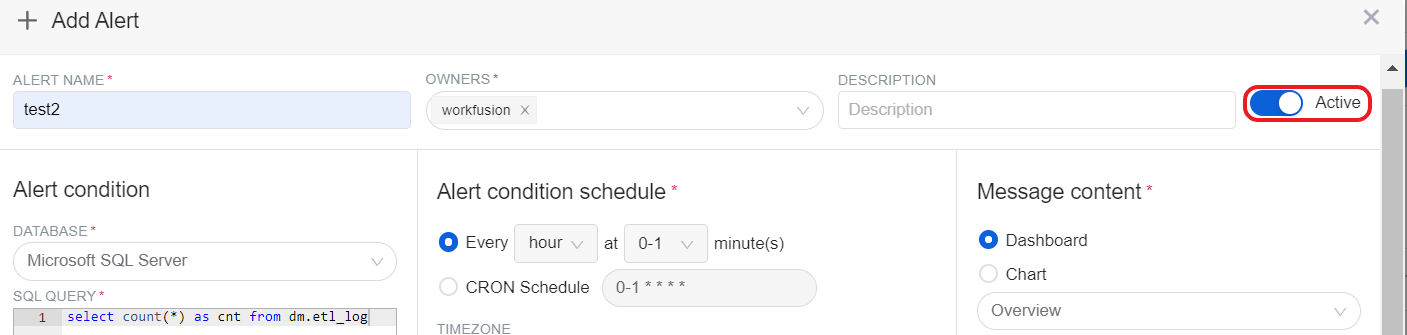
Once you activate an alert, WorkFusion starts checking the alert condition against the analytics data and sending alerts to you according to the preset schedule.
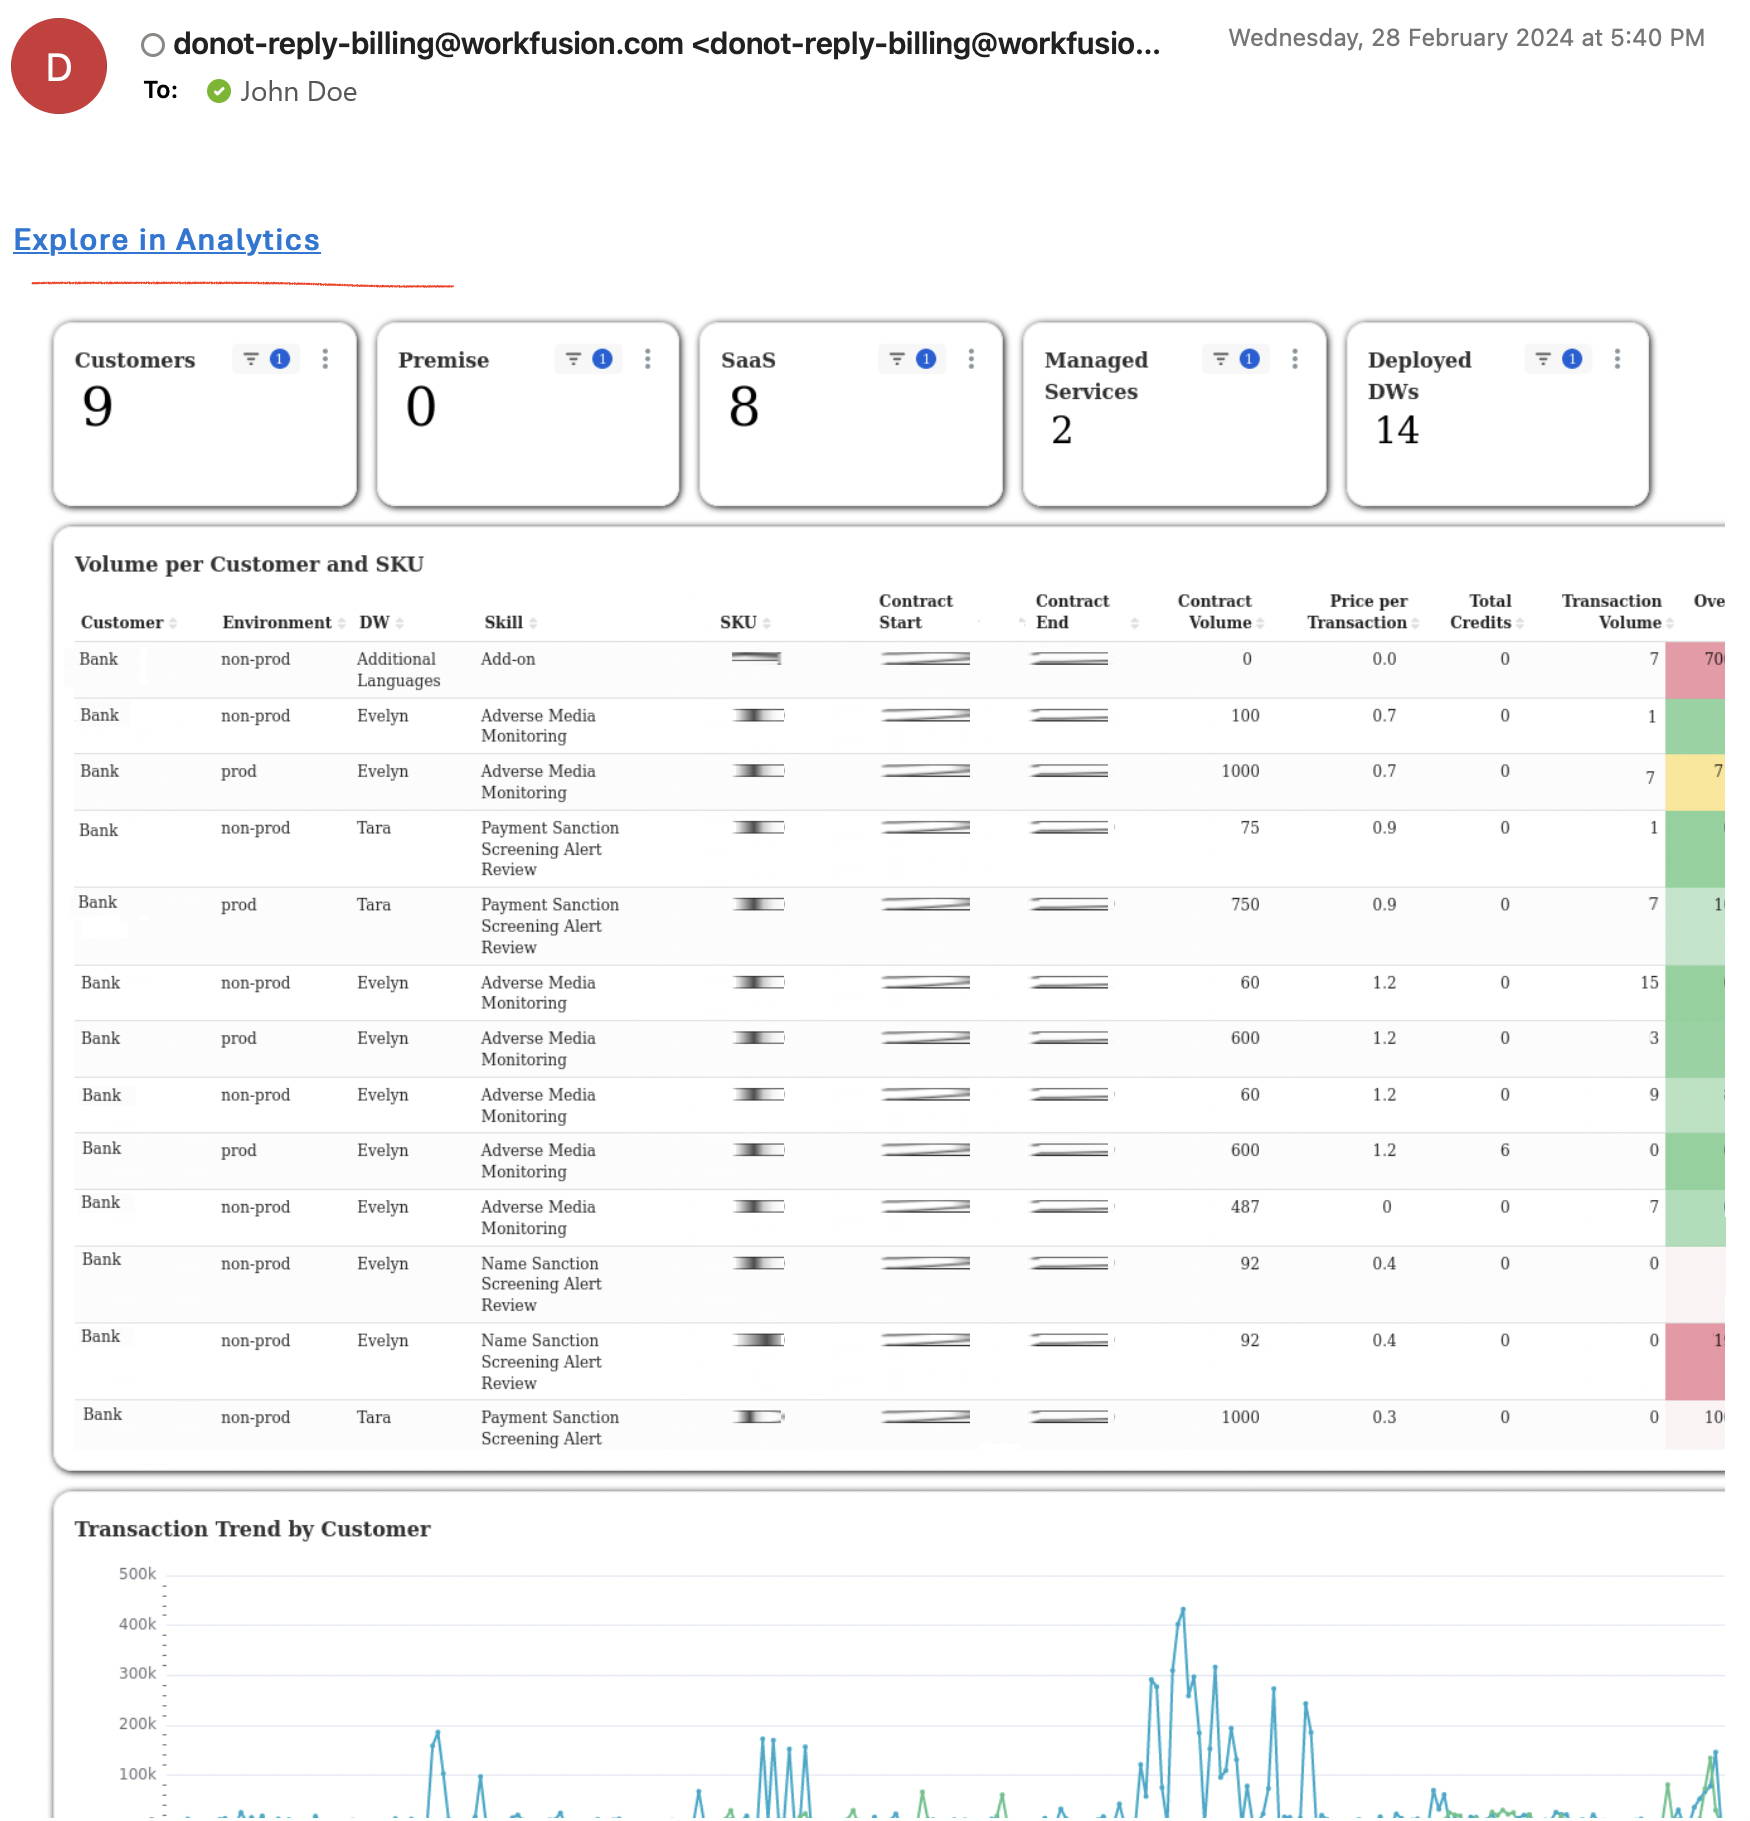
Below is a sample email alert:
View alert execution log
The execution log contains alert-specific data, such as when alert jobs are scheduled and executed, each execution duration, and error messages, if any.
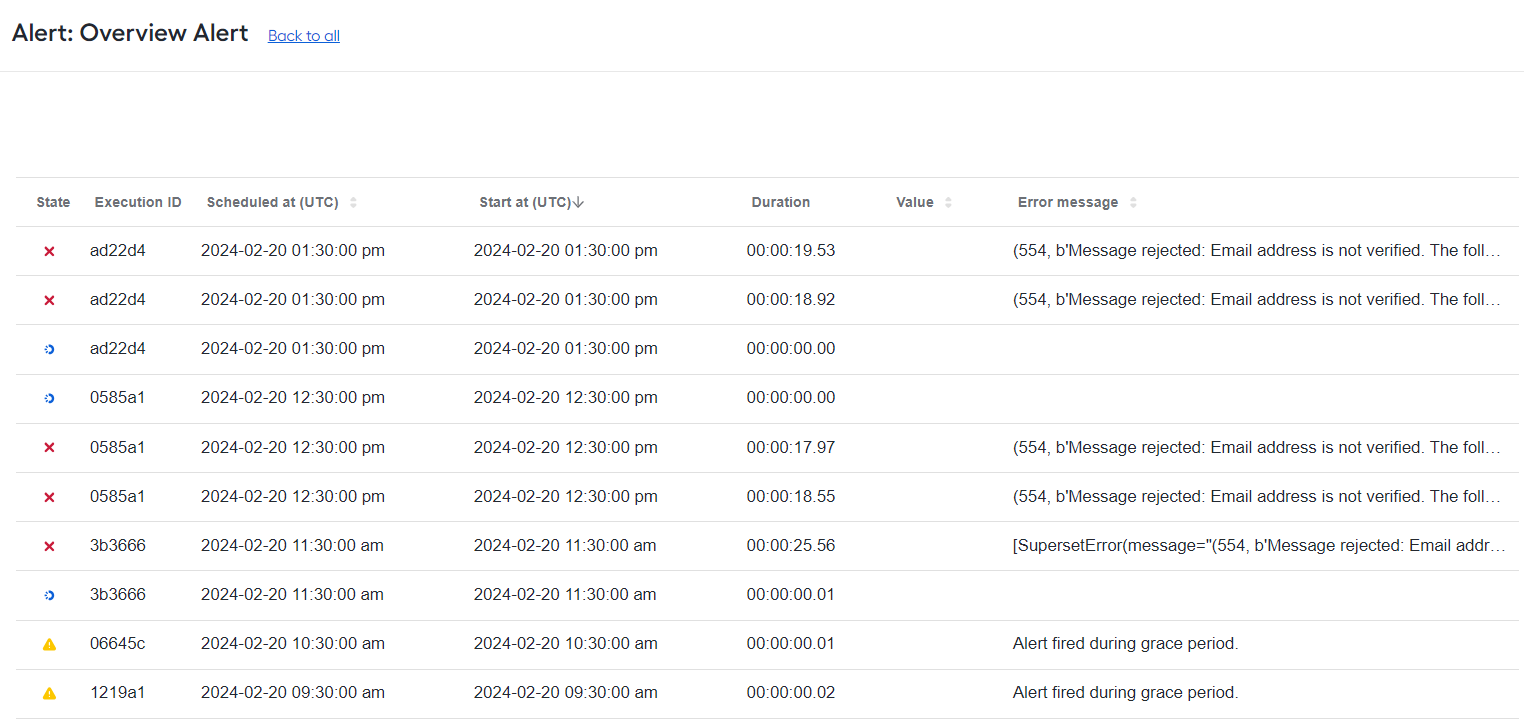
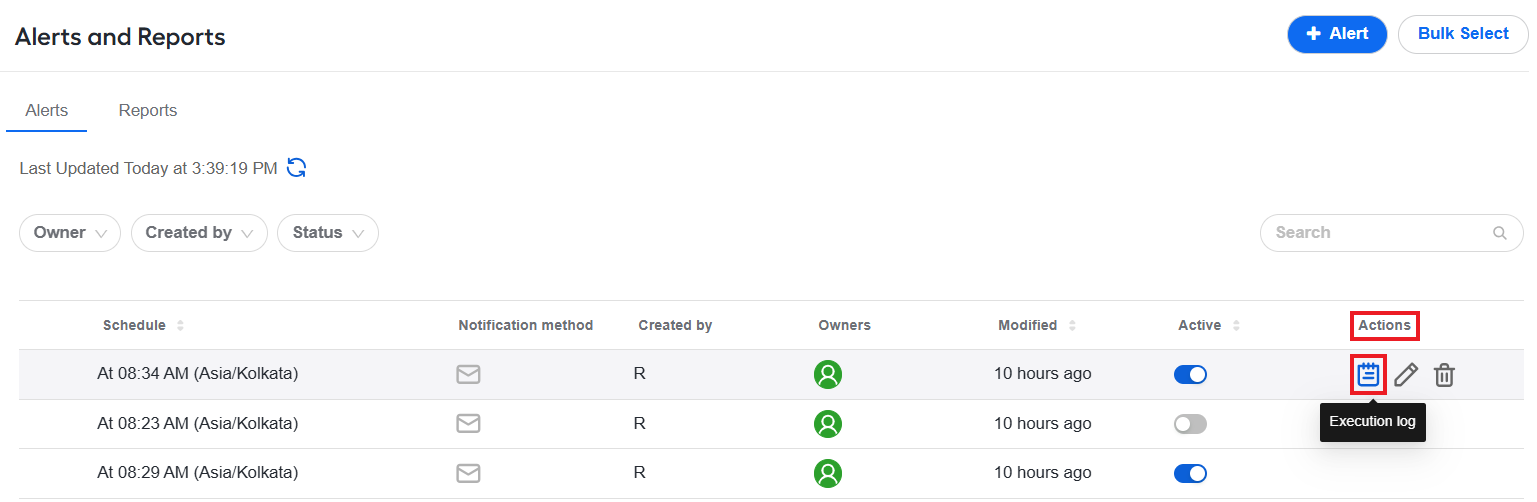
To view the execution log for a specific alert, find the Actions column on the Alerts list. Hover over the line corresponding to the alert where you want to see the execution log and click the Execution log button.
Alert statuses
The table below lists possible alert status indications and their meanings.
| Indication | Status | Details |
|---|---|---|
| Blue circle | Alert running | The alert is actively running or logged as running. |
| Yellow triangle |
| The specified threshold value is exceeded, which caused the alert to trigger. Depending on the defined grace period, you can also get the Alert fired during grace period notification. |
| Red cross | Alert failed | It was not possible to execute the alert job. |
| Green checkmark | Nothing triggered | The alert job was executed successfully, and the threshold value was not exceeded. |
Log messages
The table below lists the messages you can find in the execution log and their detailed interpretations.
| Message | Description |
|---|---|
| Schedule is still working, refusing to re-compute | The alert evaluation is launched, but its last state is Working, so it is not possible to continue. It prevents concurrent execution: if a previous alert query takes more time to complete than the actual cron cycle, queries can start building up. |
| Schedule reached a working timeout | The alert evaluation is launched, and its last state is Alert running, but it's working for more time than the working timeout value. The Alert running status is changed to Nothing triggered. |
| Alert fired during grace period | The alert evaluation is launched, and its last state is Alert Triggered. If the state happens within the grace period, the evalution is not continued, and you get this message. |
| Alert query returned more than one row | The alert SQL query must return 1 row only. |
| Alert query returned more than one column | The alert SQL query must return 1 column only. |
| Alert query returned a non-number value | The alert configuration validates with the numerical comparison, but the SQL returns a non-numerical value (for example, a string). |
All other messages are associated with errors from invalid SQL queries.
Delete alert
To delete a single alert, find the Actions column on the Alerts list. Hover over the line corresponding to the alert you want to delete and click the Delete button.
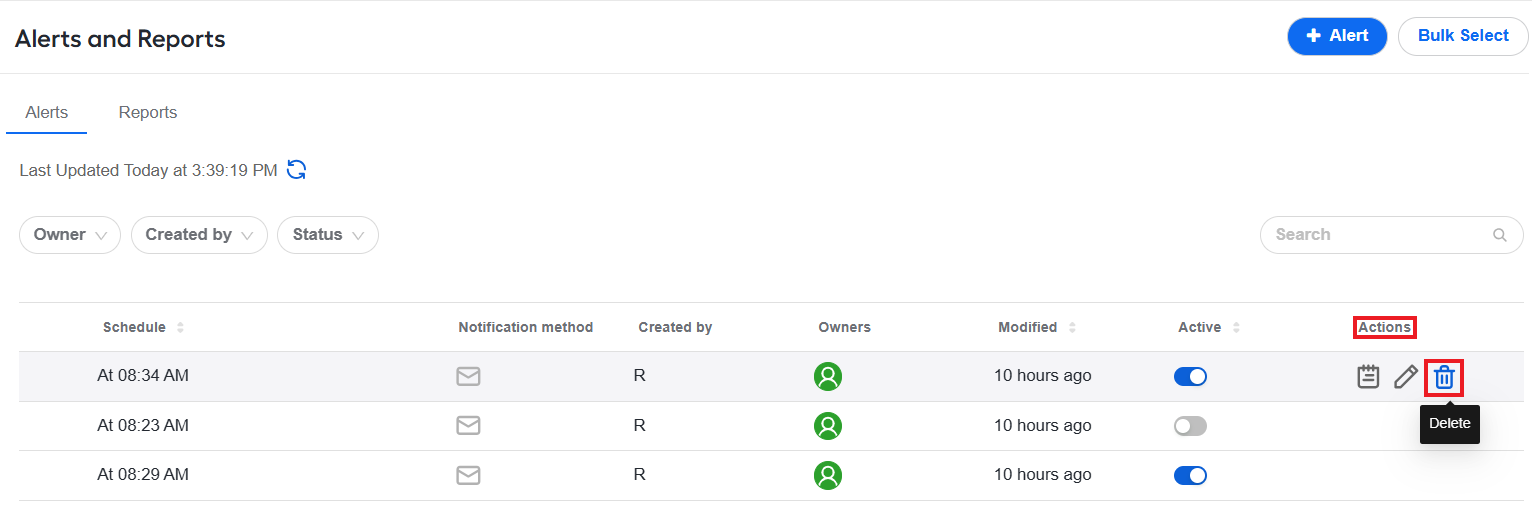
To delete multiple alerts, follow the steps below:
On the Alerts page, click the Bulk Select button.
Select the checkboxes for one or more alerts you want to delete. If you want to delete all existing alerts, select the checkbox next to the column headers, as shown in the figure below.
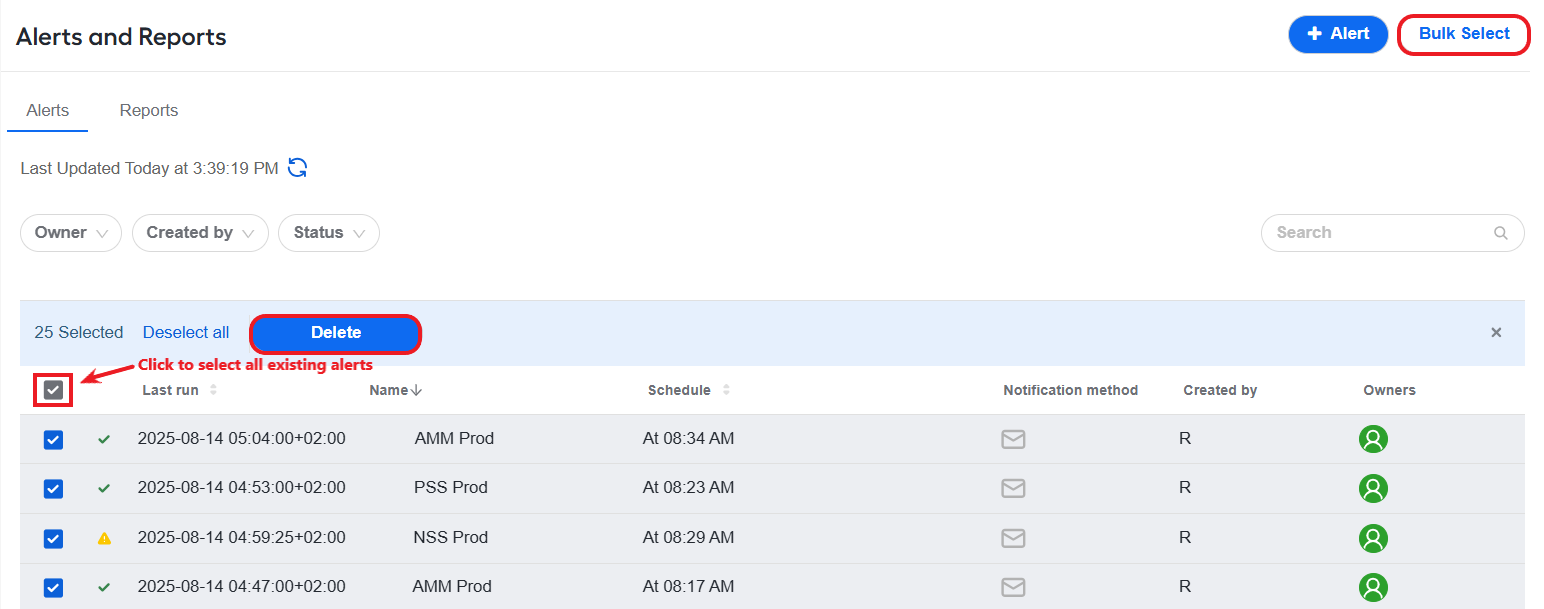
Click the Delete button and confirm the deletion. The selected alerts are removed permanently from the list, and you no longer get information associated with them.
Edit alert settings
To edit an alert's configuration, follow the steps below:
On the Alerts tab, find the Actions column.
Hover over the line corresponding to the alert you want to edit and click the Edit button.
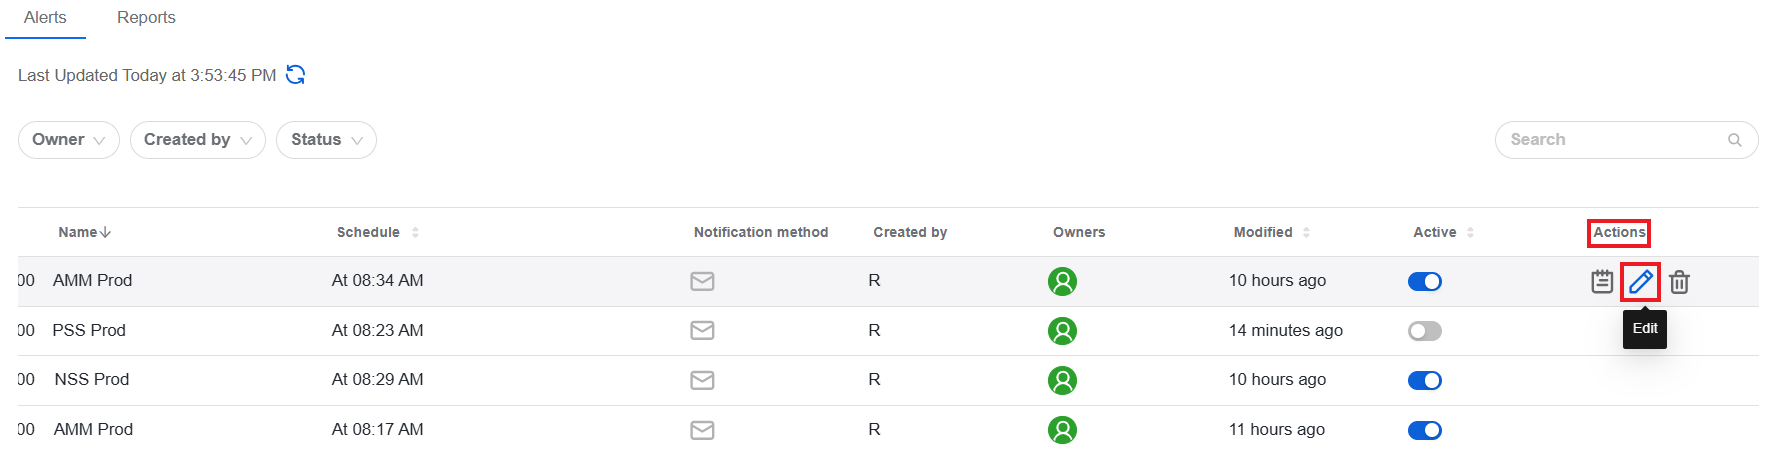
In the Edit Alert window, make required changes to the alert configuration.
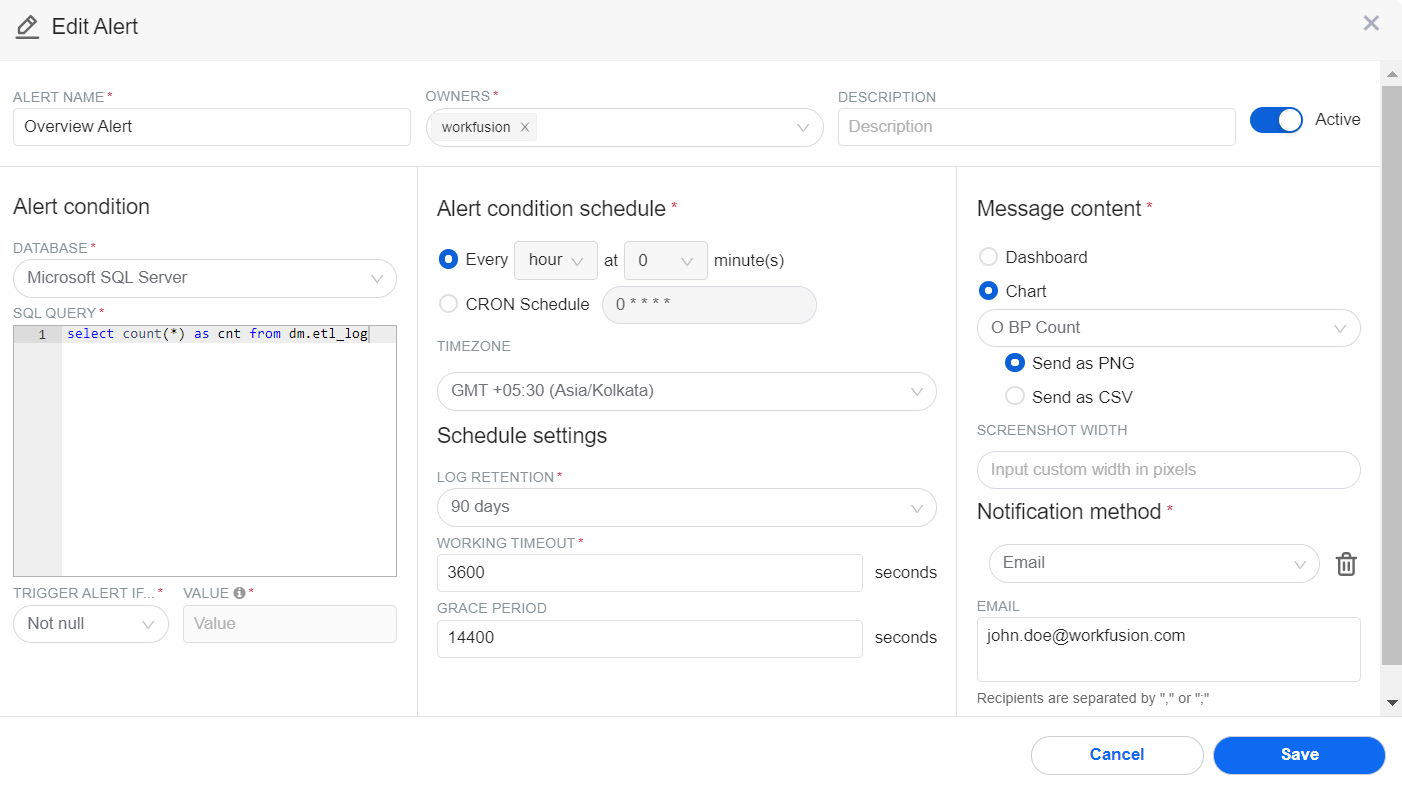
Click Save to save the changes.
Manage reports
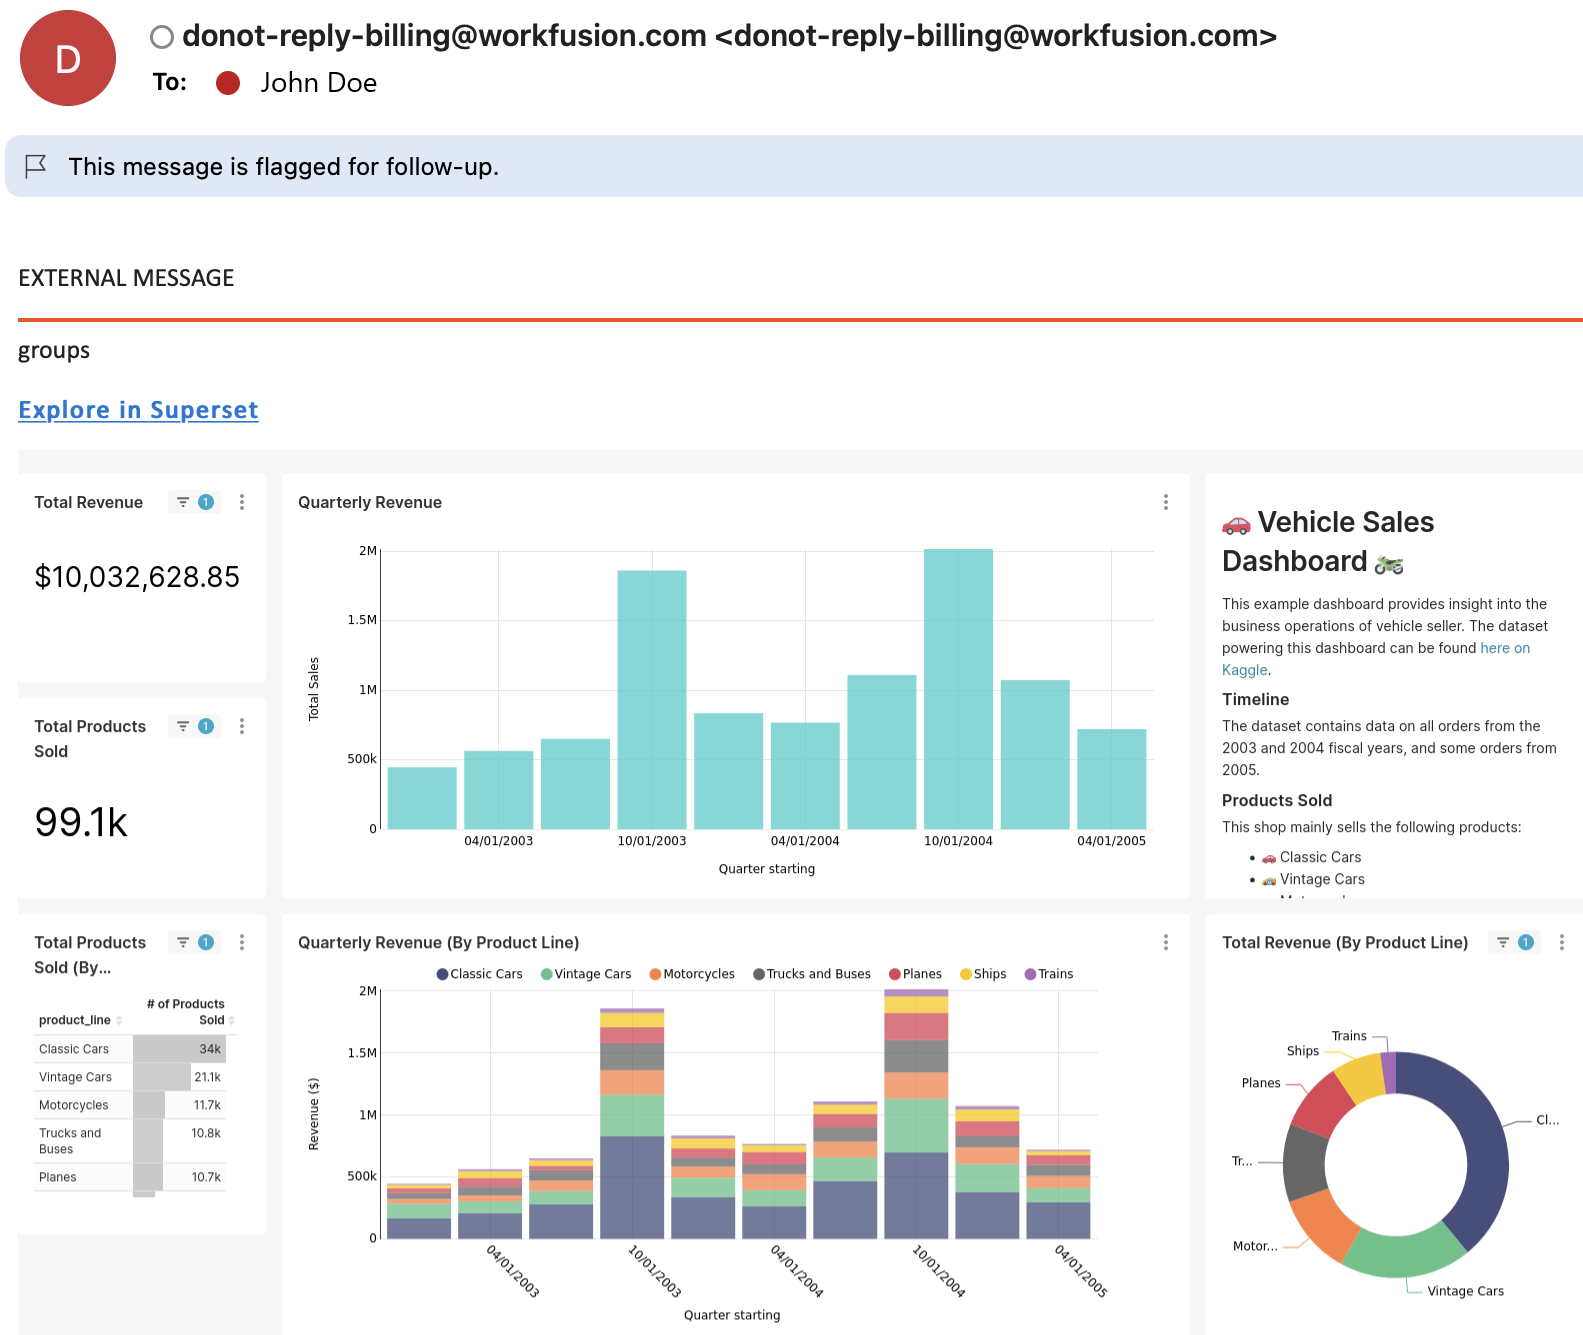
The reporting functionality allows you to get data from any available dashboards directly to your email. So, you don't actually have to open the dashboards or even log in to Control Tower.
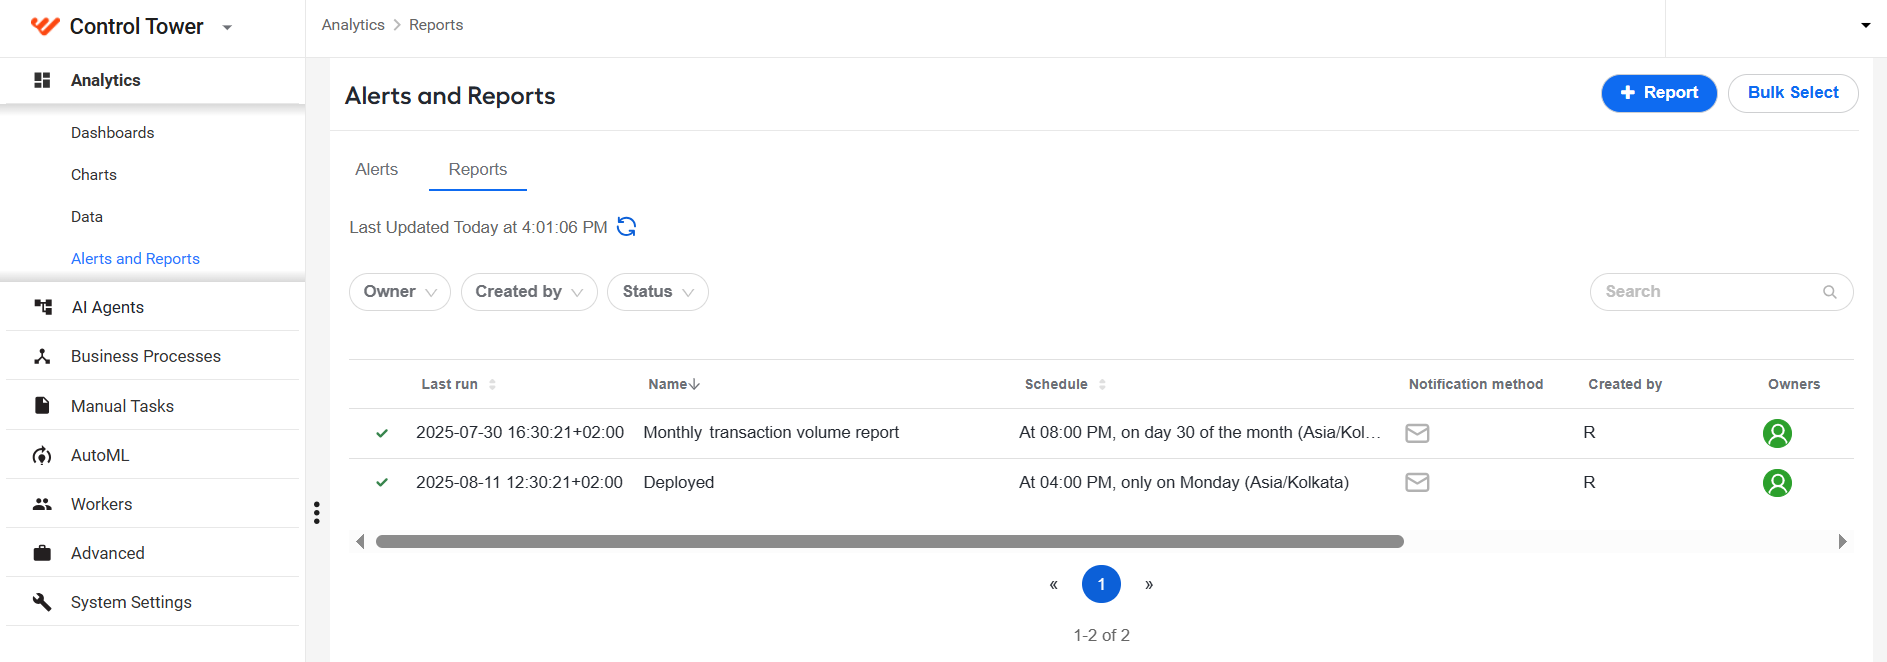
The Reports tab lists all available reports (if any) together with related details. From here, you can also perform a number of actions:
Create report
To create a report, follow the steps below:
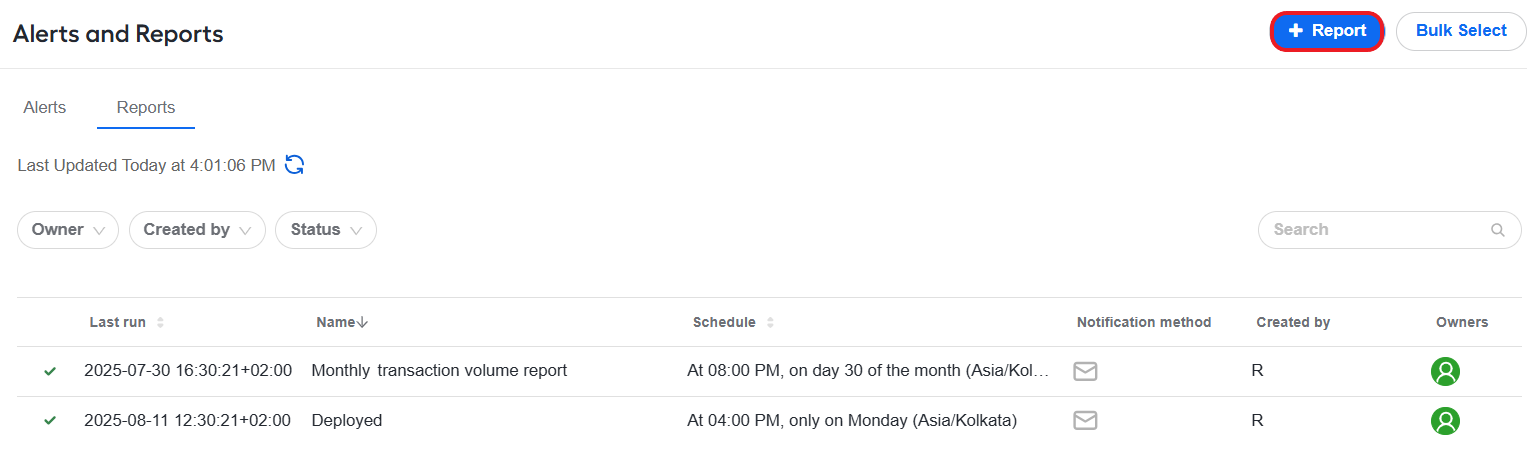
On the Reports tab, click + Report.
In the Add Report dialog, start with specifying the name, making sure you can easily identify the report by it.
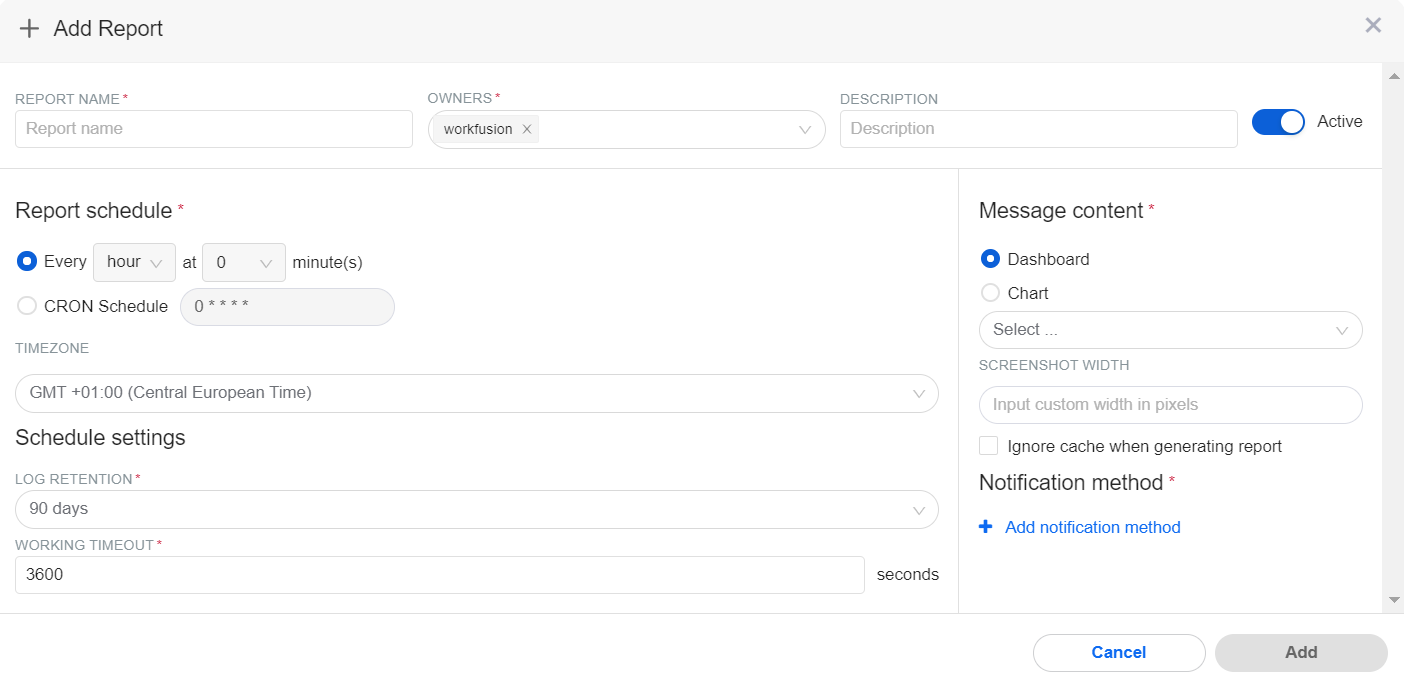
In the Message content section, select the Dashboard or Chart radio button to choose at which level the report content will be retrieved. Below the radio buttons, select a specific dashboard or chart.
noteThe Chart option is only available for users with the Administrator role.
In the Notification method section, click Add notification method, select Email, and add one or more email addresses where the generated report is to be sent.

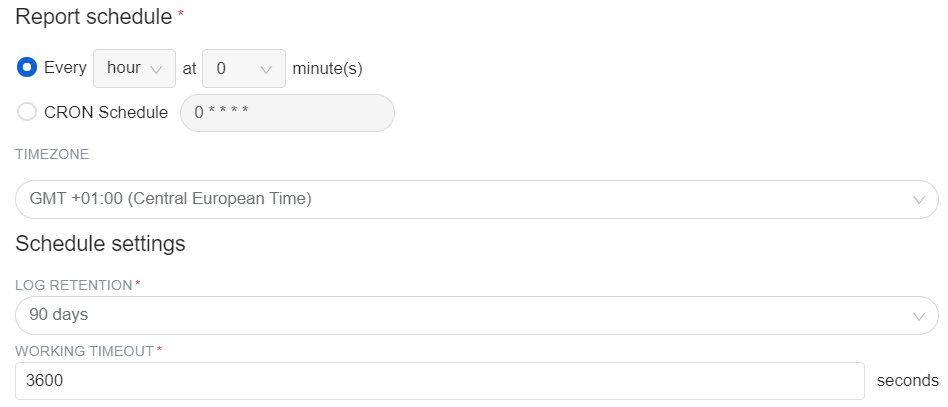
In the Report schedule section, do the following:
Specify a report generation interval by selecting hours and minutes in respective drop-down boxes or specifying a CRON schedule.
In the Timezone field, select your timezone.
In the LOG RETENTION field (required), define how long (in days) the report is stored in the execution log. By default, the value is set to 90 days.
In the WORKING TIMEOUT field (required), specify how long (in seconds) the report job runs before it is timed out automatically. By default, the value is set to 3,600 seconds.
Click the Add button. The created report appears on the Reports list in the active state (by default).
Activate or deactivate report
After creating a report, make sure it is in the active state. Otherwise, no reports are generated or delivered by the chosen notification method.
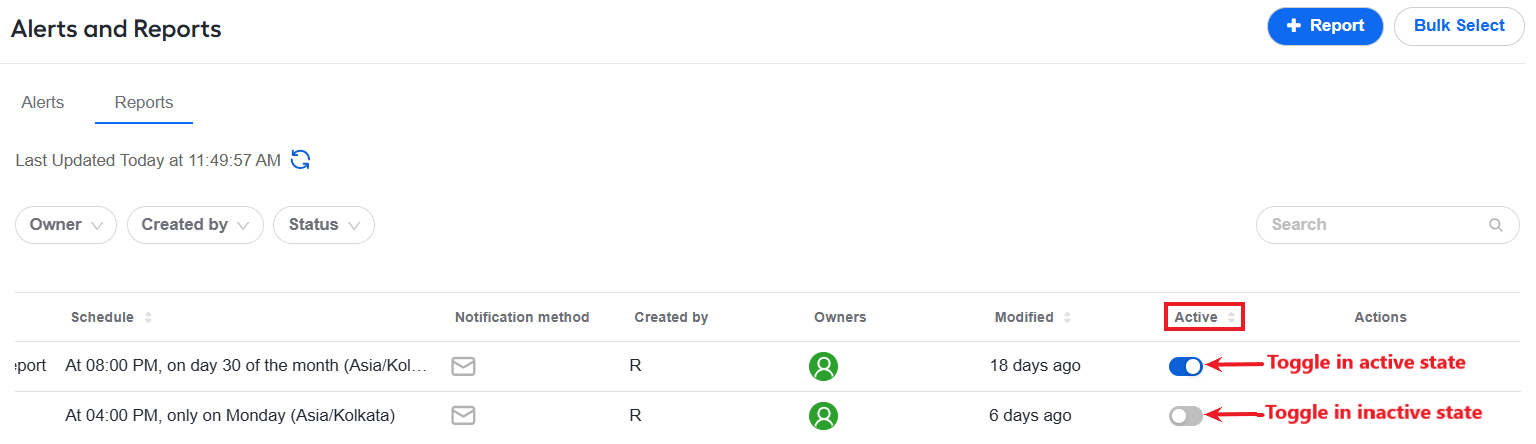
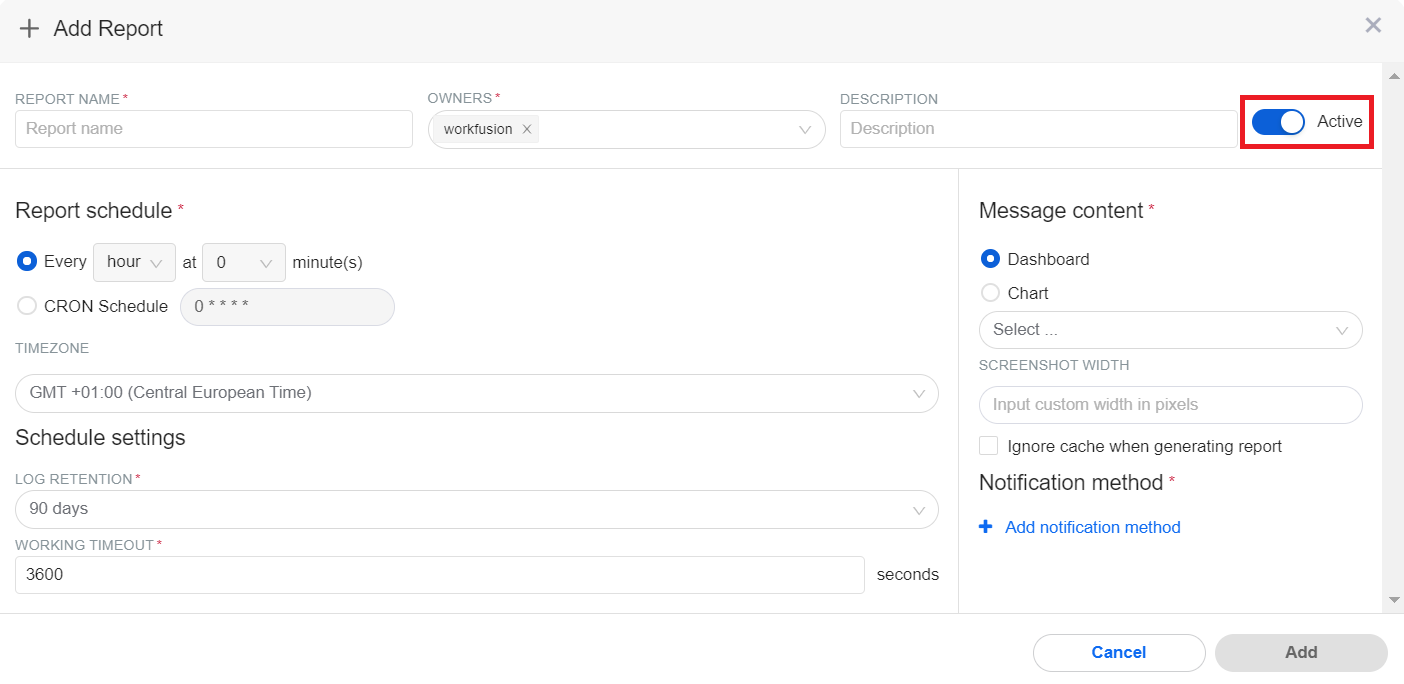
You have two options to activate or deactivate a report:
On the Reports page, find the Active column and, on the line corresponding to the report you want to activate or make inactive, switch on or off the activation toggle.
In the Add Report dialog, switch on or off the Active toggle.
Once you activate a report, WorkFusion Analytics starts generating reports and sending them to you according to the preset schedule.
Below is a sample email report:
View report execution log
The execution log contains report-specific data, such as the schedule, execution duration, and error messages, if any.
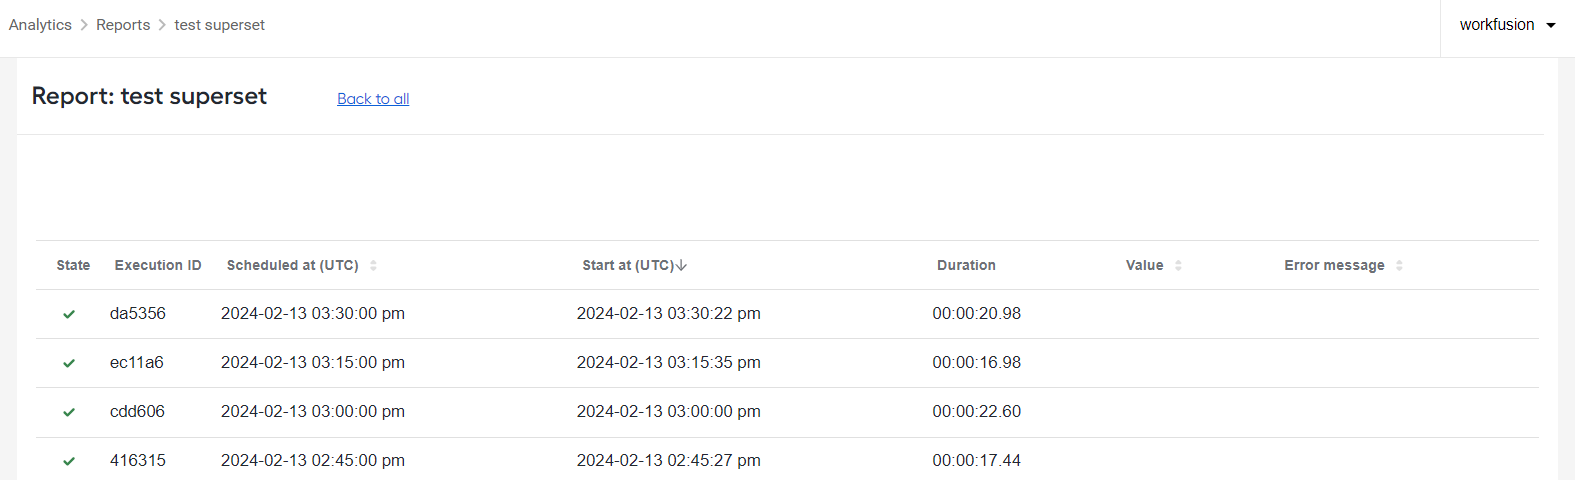
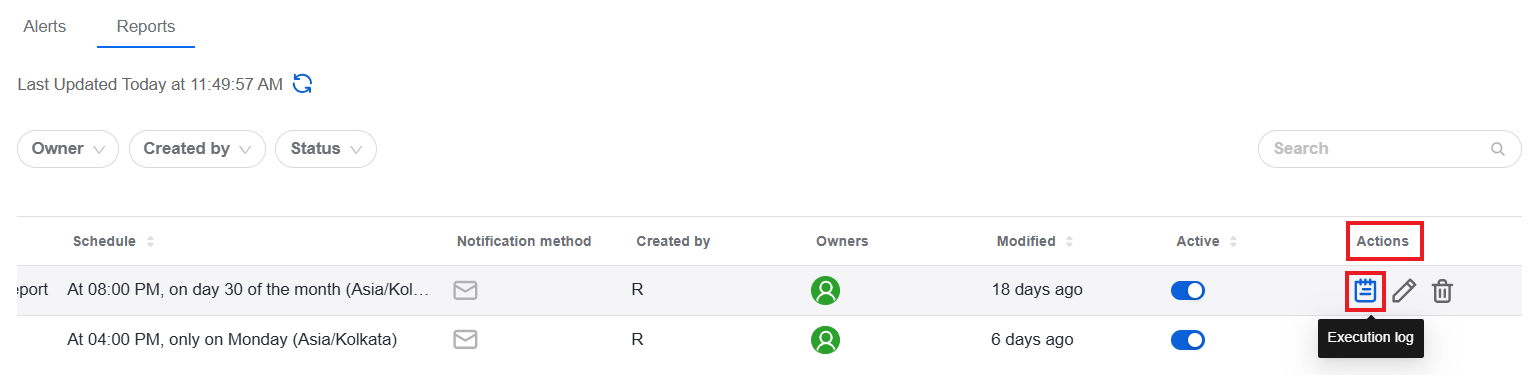
To view the execution log for a specific report, go to the Reports list and find the Actions column. Hover over the line corresponding to the report for which you want to see the execution log and click the Execution log button.
Report statuses
The table below lists possible report status indications and their meanings.
| Indications | Meaning |
|---|---|
| Blue circle | The report is actively running or logged as running. |
| Red cross | It was not possible to execute the report. |
| Green checkmark | The report was executed successfully. |
Log messages
The table below lists the messages you can find in the execution log and their detailed interpretations.
| Message | Description |
|---|---|
| Report Schedule is still working, refusing to re-compute | The report execution is launched, but its last state is Running, so it is not possible to continue. It prevents concurrent execution. |
| Report Schedule reached a working timeout | The report execution is launched, and its last state is Running, but it's working for more time than the working timeout value. The Running status is changed to Nothing triggered (green checkmark). |
Delete report
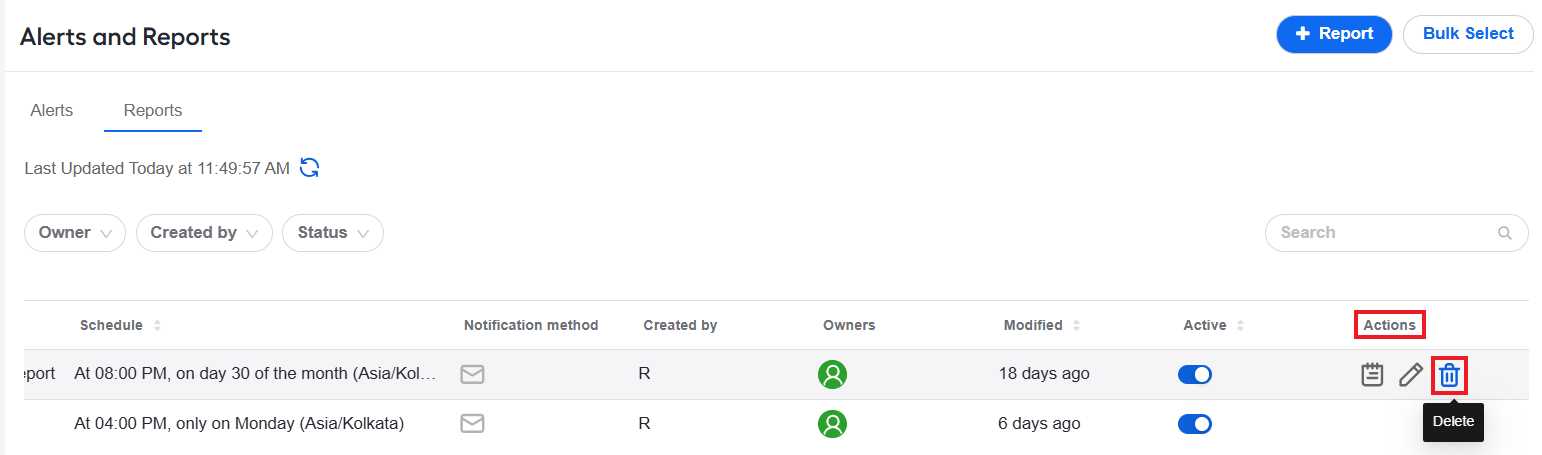
To delete a single report, find the Actions column on the Reports tab. Hover over the line corresponding to the report you want to delete and click the Delete button.
To delete multiple reports, follow the steps below:
On the Reports tab, click the Bulk Select button.
Select the checkboxes for one or more reports you want to delete. If you want to delete all existing reports, select the checkbox next to the column headers, as shown in the figure below.
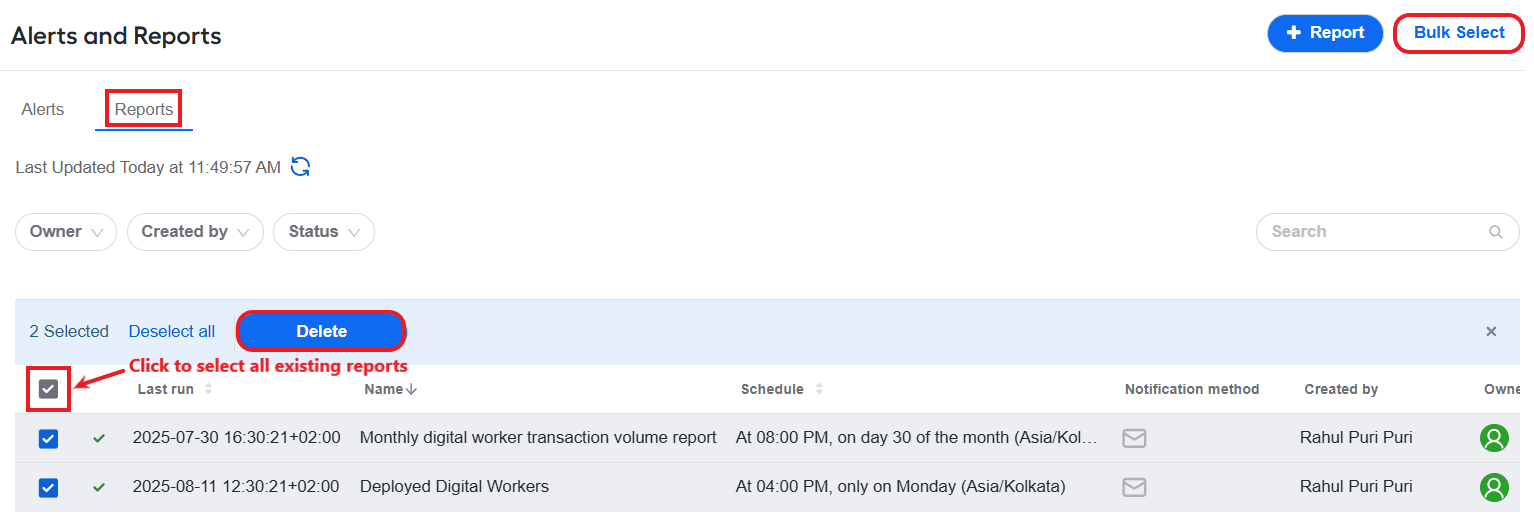
Click the Delete button and confirm the deletion. The selected reports are removed permanently from the list, and you no longer get information associated with them.
Edit report settings
To edit a report's configuration, follow the steps below:
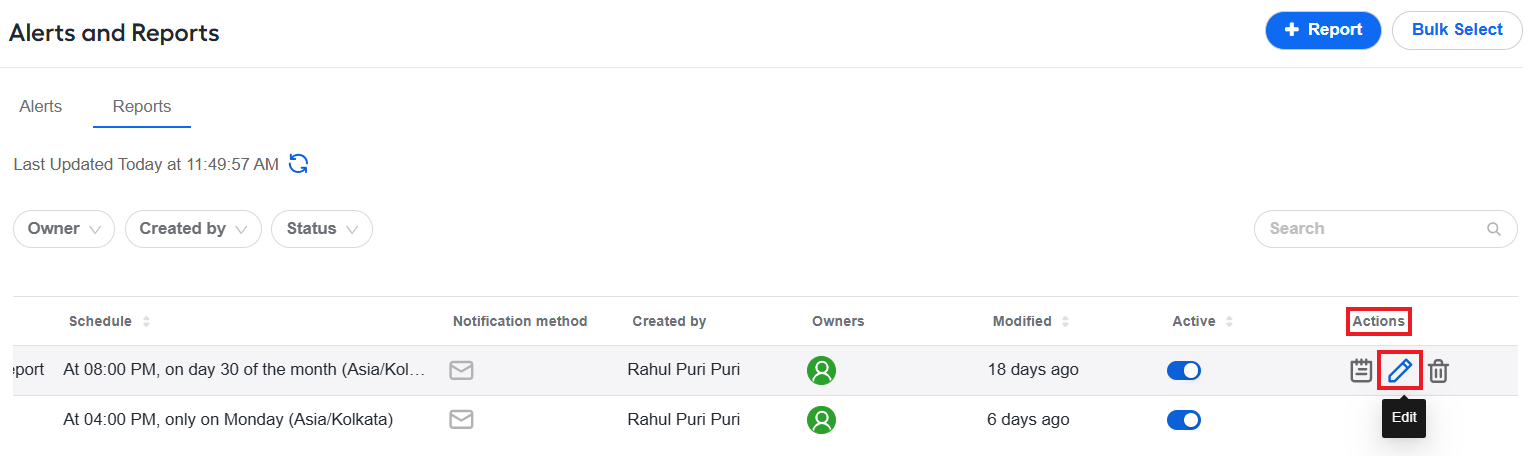
On the Reports tab, find the Actions column.
Hover over the line corresponding to the report you want to edit and click the Edit button.
In the Edit Report window, make required changes to the report configuration.
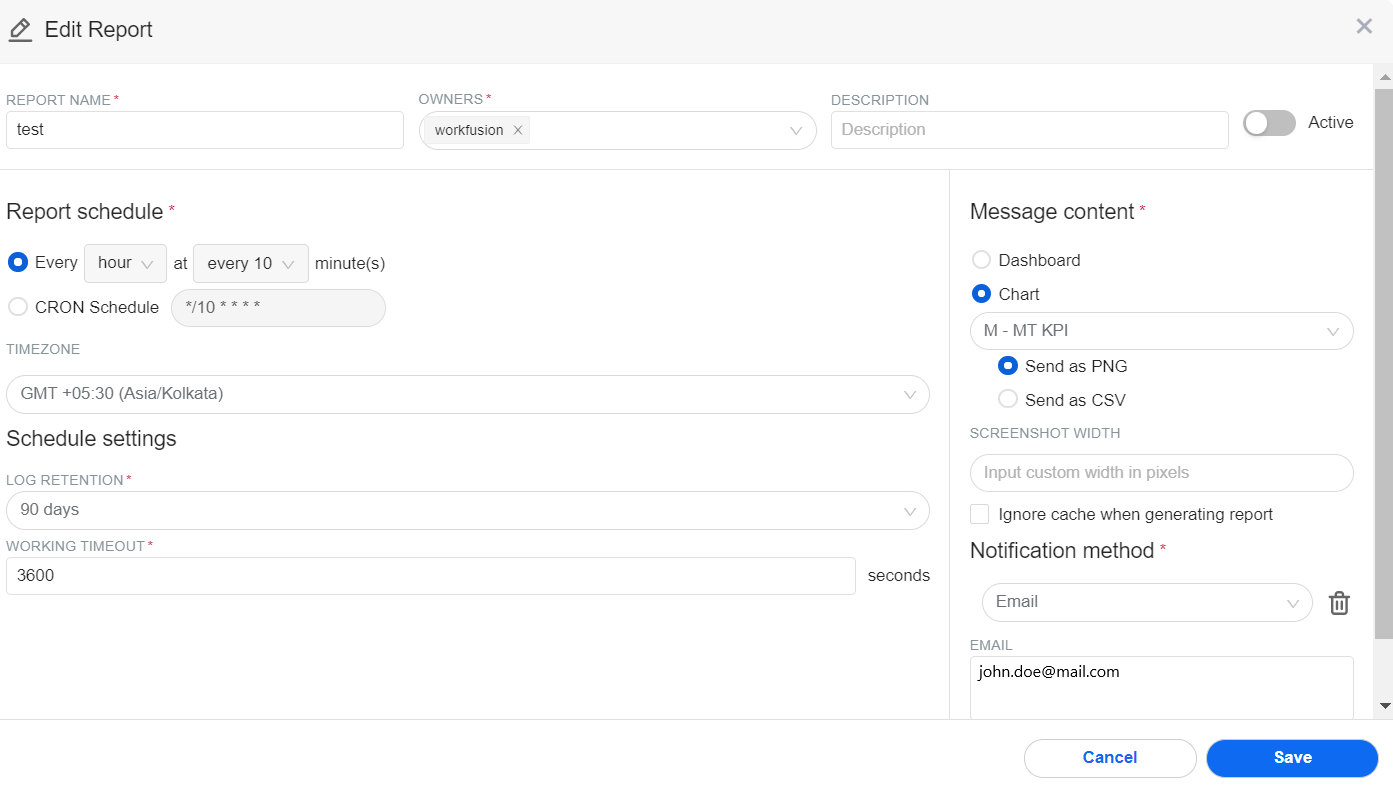
Click Save to save the changes.