Learn about analytics in WorkFusion
For monitoring process metrics, Work.AI offers Superset-based analytics installed together with the Product. To start working with the analytics, you only need to configure access. It does not require any additional third-party licenses and provides the following capabilities:
Monitor Manual Task and rule metrics with out-of-the-box (OOTB) dashboards
Create custom dashboards, including with OOTB charts
Create and customize various chart types, including with Artificial Intelligence (AI)
Manage database connections for feeding analytical data
Manage analytics datasets
Create and manage reports and alerts
Generate Analytics insights using AI
Explore analytics architecture and data flows
Starting from v10.3, Work.AI analytics collects data using an event-based approach instead of ETL (Extract, Transmit, Load) procedures.
Architecture implementation details
The diagram below represents the basic components of the event-based analytics architecture:
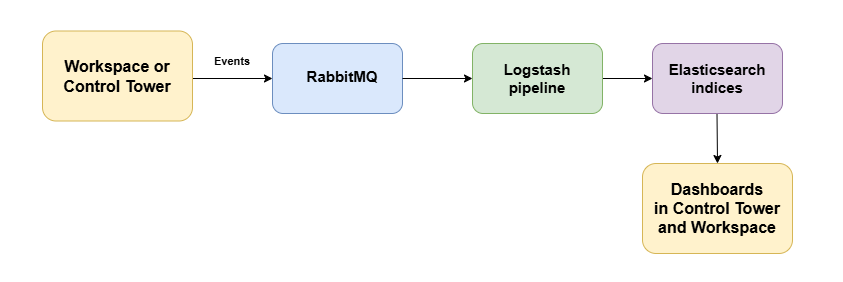
The general analytics event-processing sequence is as follows:
Workspace or Control Tower sends data attributes representing specific events, such as assignment opening, rule or task submission, as part of the payload code to a RabbitMQ queue.
The data from the RabbitMQ queue is consumed by a Logstash pipeline.
The pipeline aggregates the event data and puts it to Elasticsearch indices where the data is stored.
The analytics component consumes the data from linked Elasticsearch indices and renders them as dashboard or chart data.
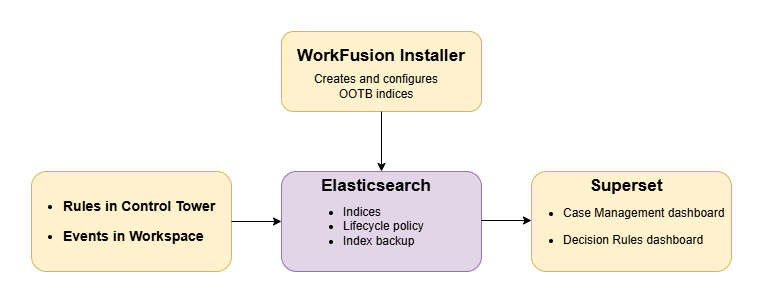
The diagram below illustrates how Elasticsearch indices are created and interact with dashboards:
Analytics data management
In 10.3, Work.AI analytics is decoupled from the MS SQL database tables, and all data is stored and managed using Elasticsearch indices. MS SQL is only supported for backward compatibility.
The database connections are created and configured at installation. To view them, log into Control Tower and go to Analytics > Data > Databases.
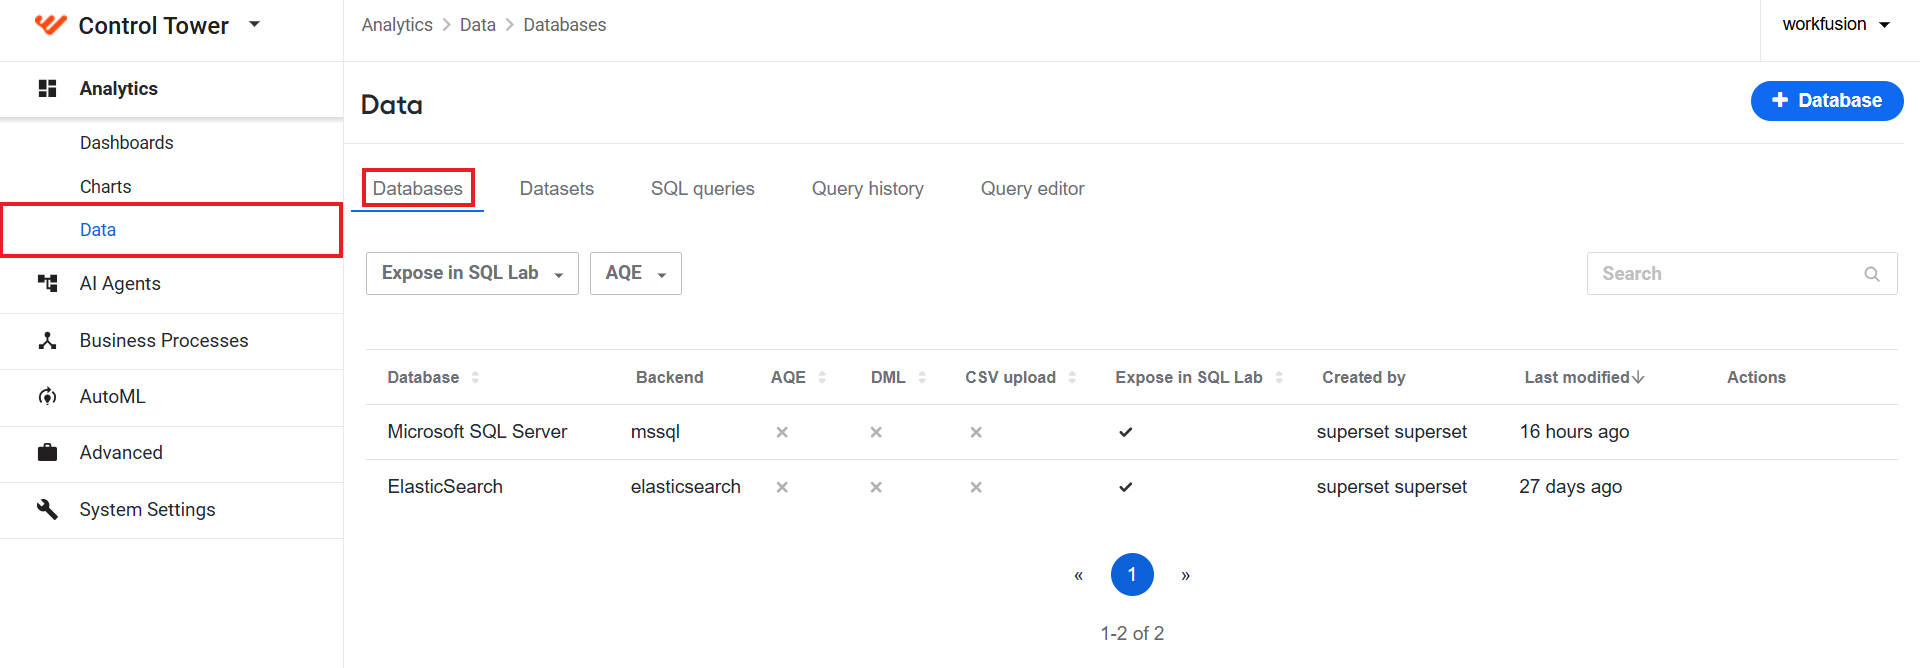
By default, only Administator users can see the Databases tab and access Platform Monitor with Elasticsearch indices, index templates, lifecycle policies, and the index backup feature.
Elasticsearch indices
Elasticsearch indices for storing events are created and preset for you at installation and available out of the box. To access them, follow the steps below:
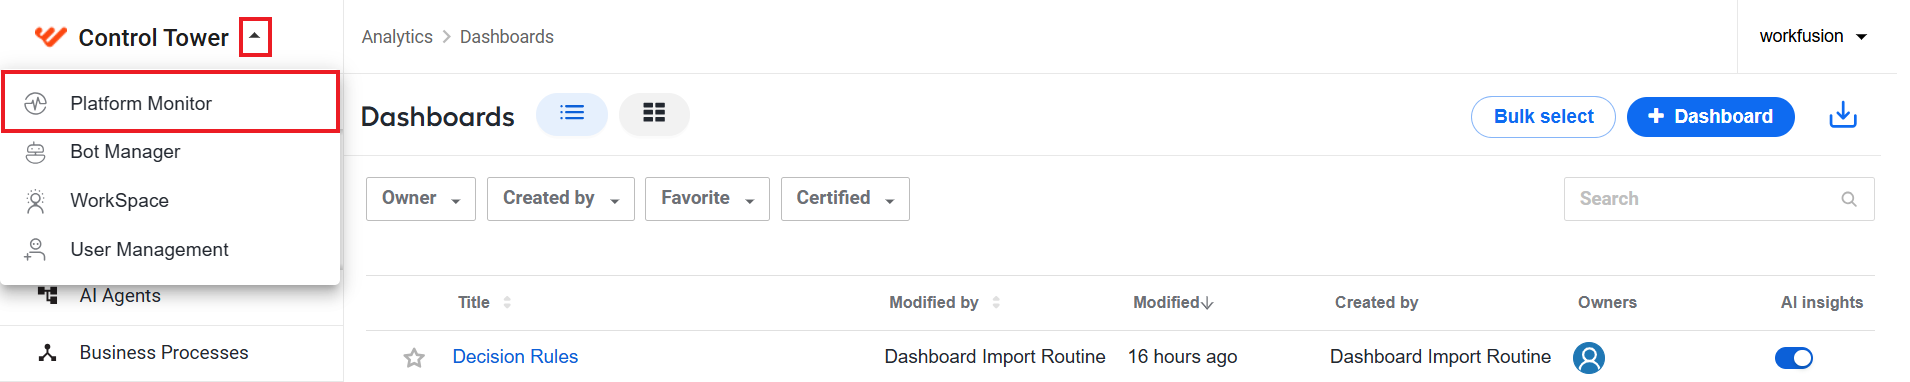
Log in to Control Tower, click the arrow button next to the Control Tower label in the top left corner menu, and choose Platform Monitor.
Once logged in, on the left menu, select Stack management > Index Management > Indices.
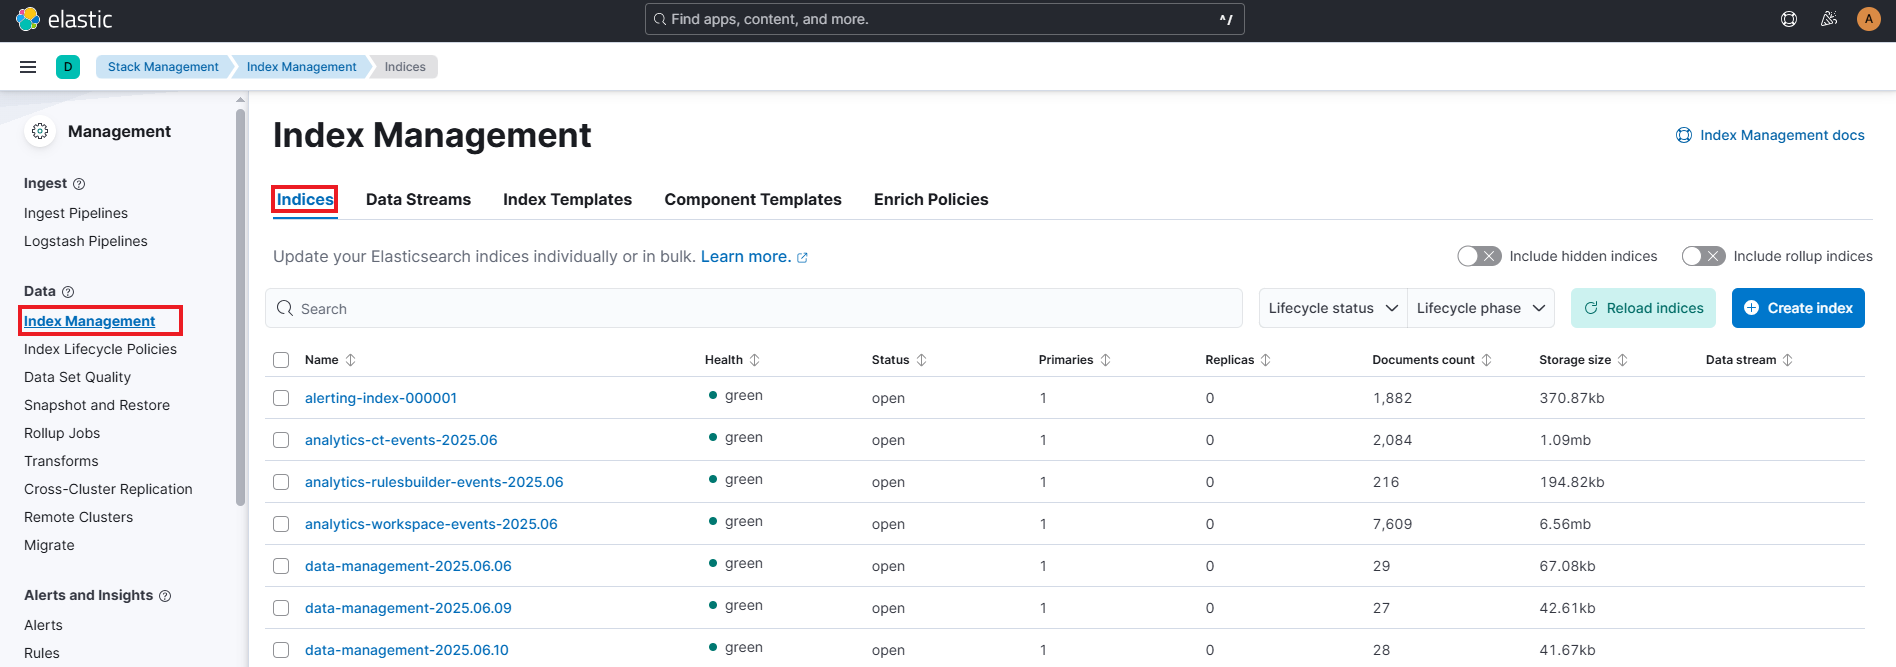
Specific Elasticsearch indices store specific WorkFusion analytics data:
analytics-workspace-events stores raw event data from Workspace.
dw-analytics-cm-overview stores the data for visualizations on the Overview tab of the Case Management dashboard.
dw-analytics-cm-events stores the data to be displayed on the User overview and User details tabs of the Case Management dashboard.
dw-analytics-ra-overview stores the aggregated data to be displayed in the Decision Rules dashboard.
analytics-ct-events stores the events sent from Control Tower while a Business Process with a Decision Rules bot step is executed. These events include running, stopping, or pausing the BP.
analytics-rulesbuilder-events stores the events associated with executing the Decision Rules bot step.
Index Templates
Index templates contain a standardized structure and configuration for Elasticsearch indices that aggregate and store analytics data. To access and manage index templates, go to Index Management > Index Templates.
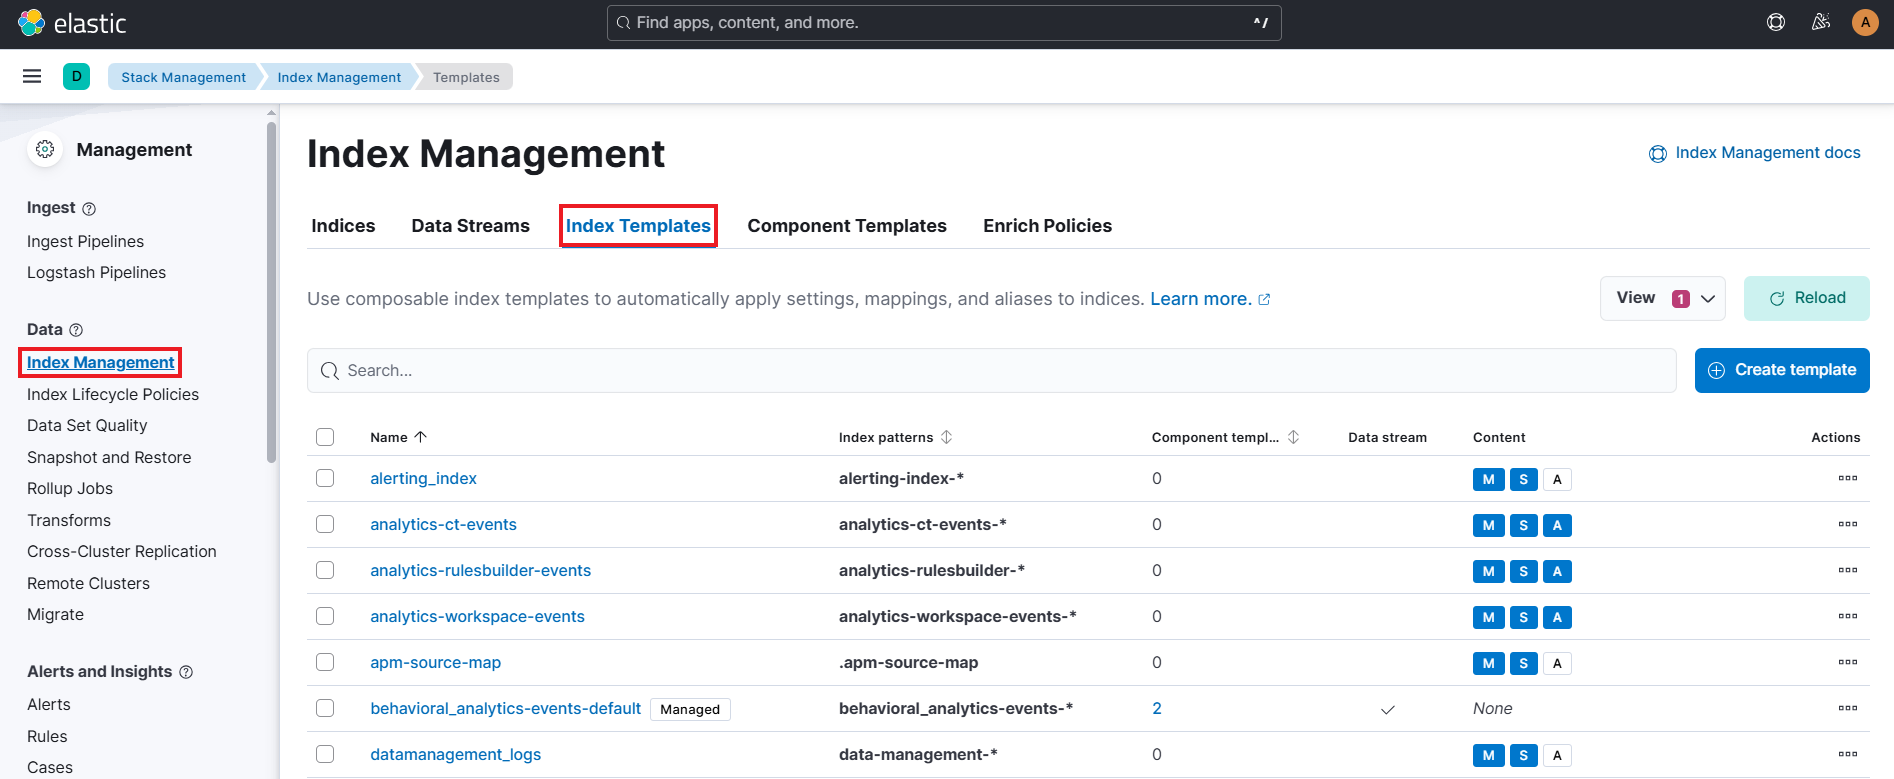
The following index templates are available out of the box in Elasticsearch for WorkFusion analytics:
analytics-workspace-events for raw Workspace events
dw-analytics-cm-overview for aggregated Workspace events displayed on the Overview tab of the Case Management dashboard
dw-analytics-cm-events for aggregated Workspace events displayed on the User overview and User details tabs of the Case Management dashboard
analytics-ct-events for aggregated Control Tower events associated with the execution of a Business Process with a Decision Rules bot step (for instance, running, stopping, or pausing the BP).
analytics-rulesbuilder-events for aggregated events associated with executing the Decision Rules bot step.
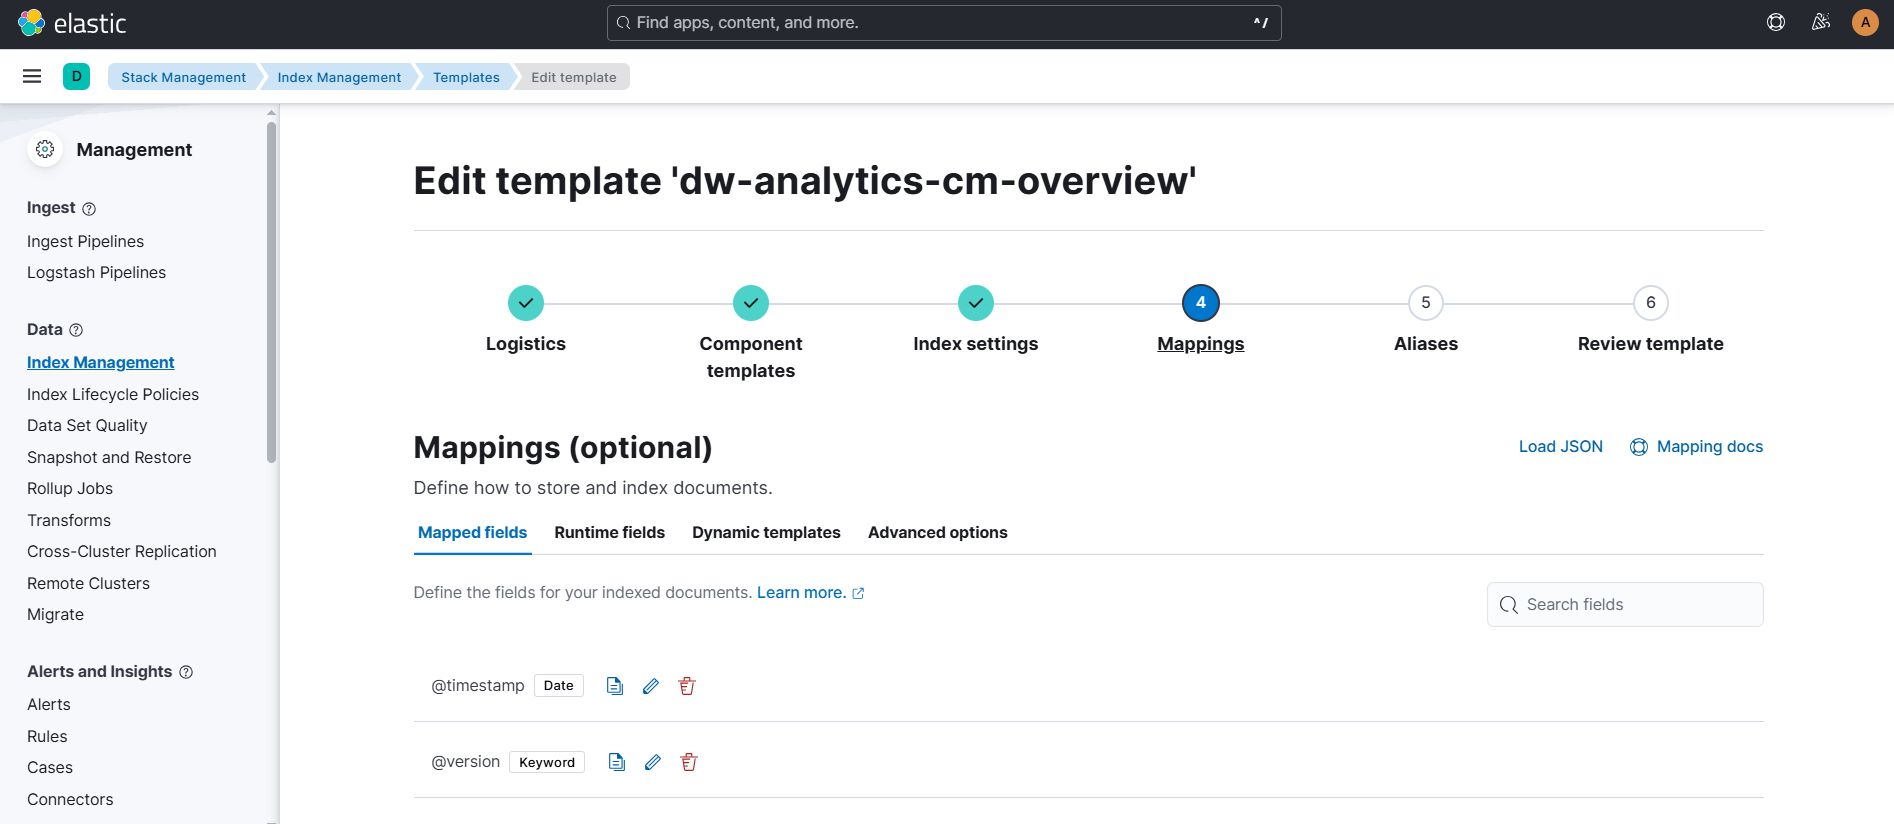
To see the structure and configuration for an index template, click a template to open its settings, click Manage, and select Edit.
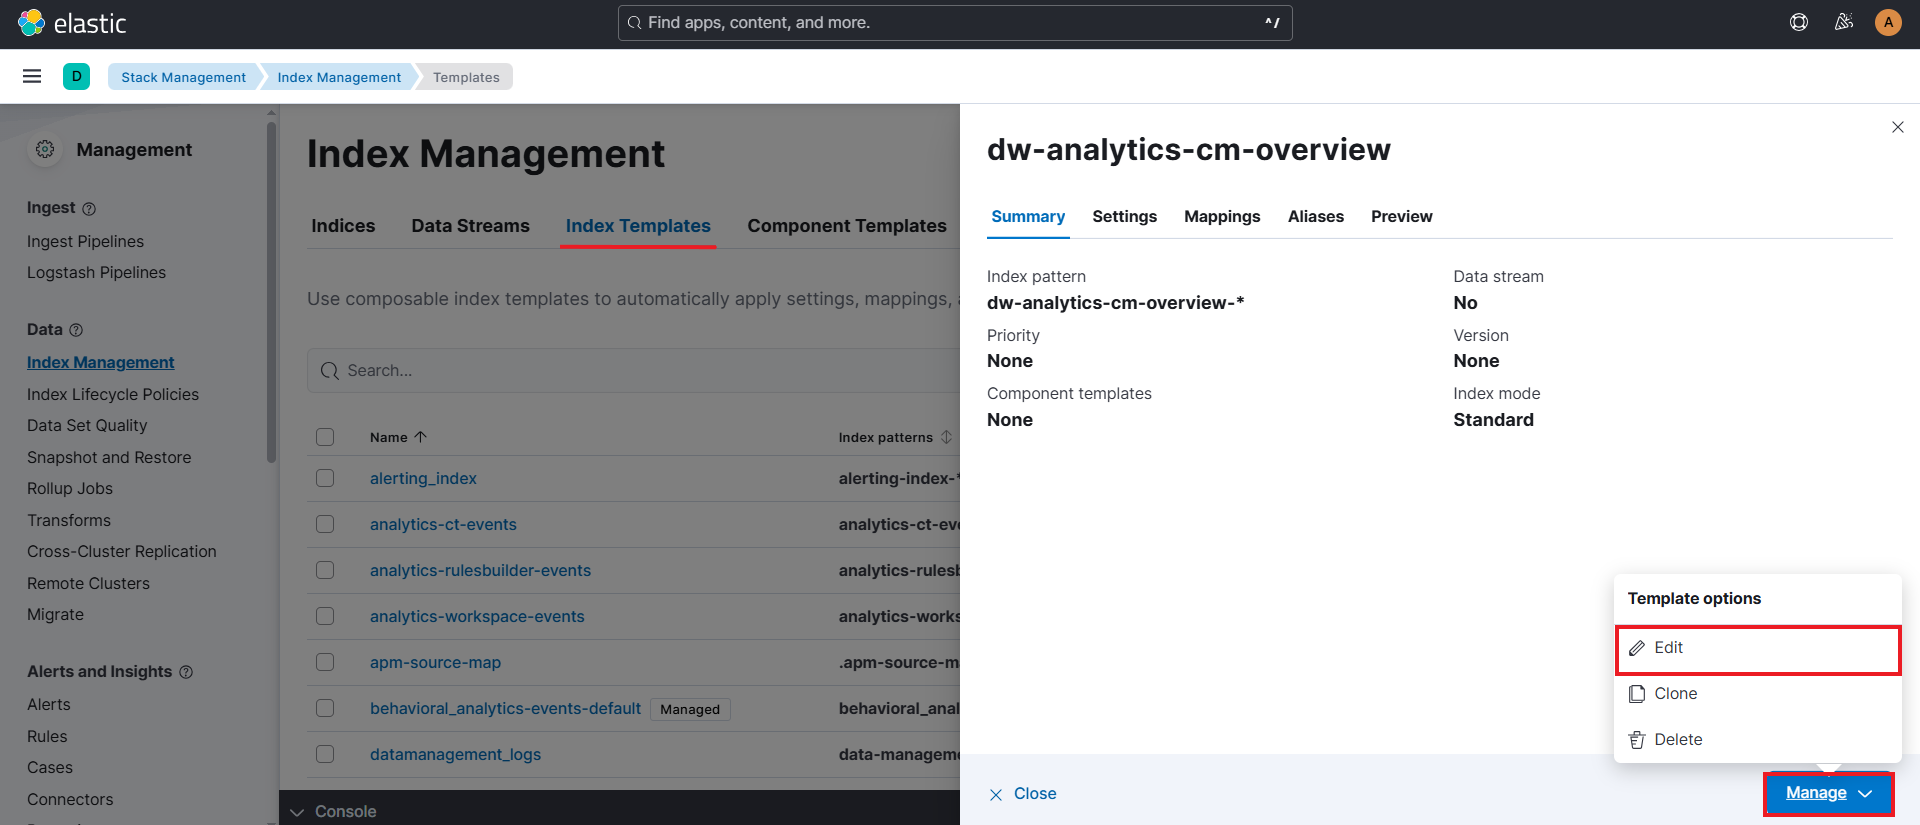
Clicking through the tabs, you can review available template settings. For instance, on the Mappings tab, you can see the data columns a template-based index will contain.
Index lifecycle policy
On the Index Lifecycle Policies page, you can manage the retention and deletion of indices.
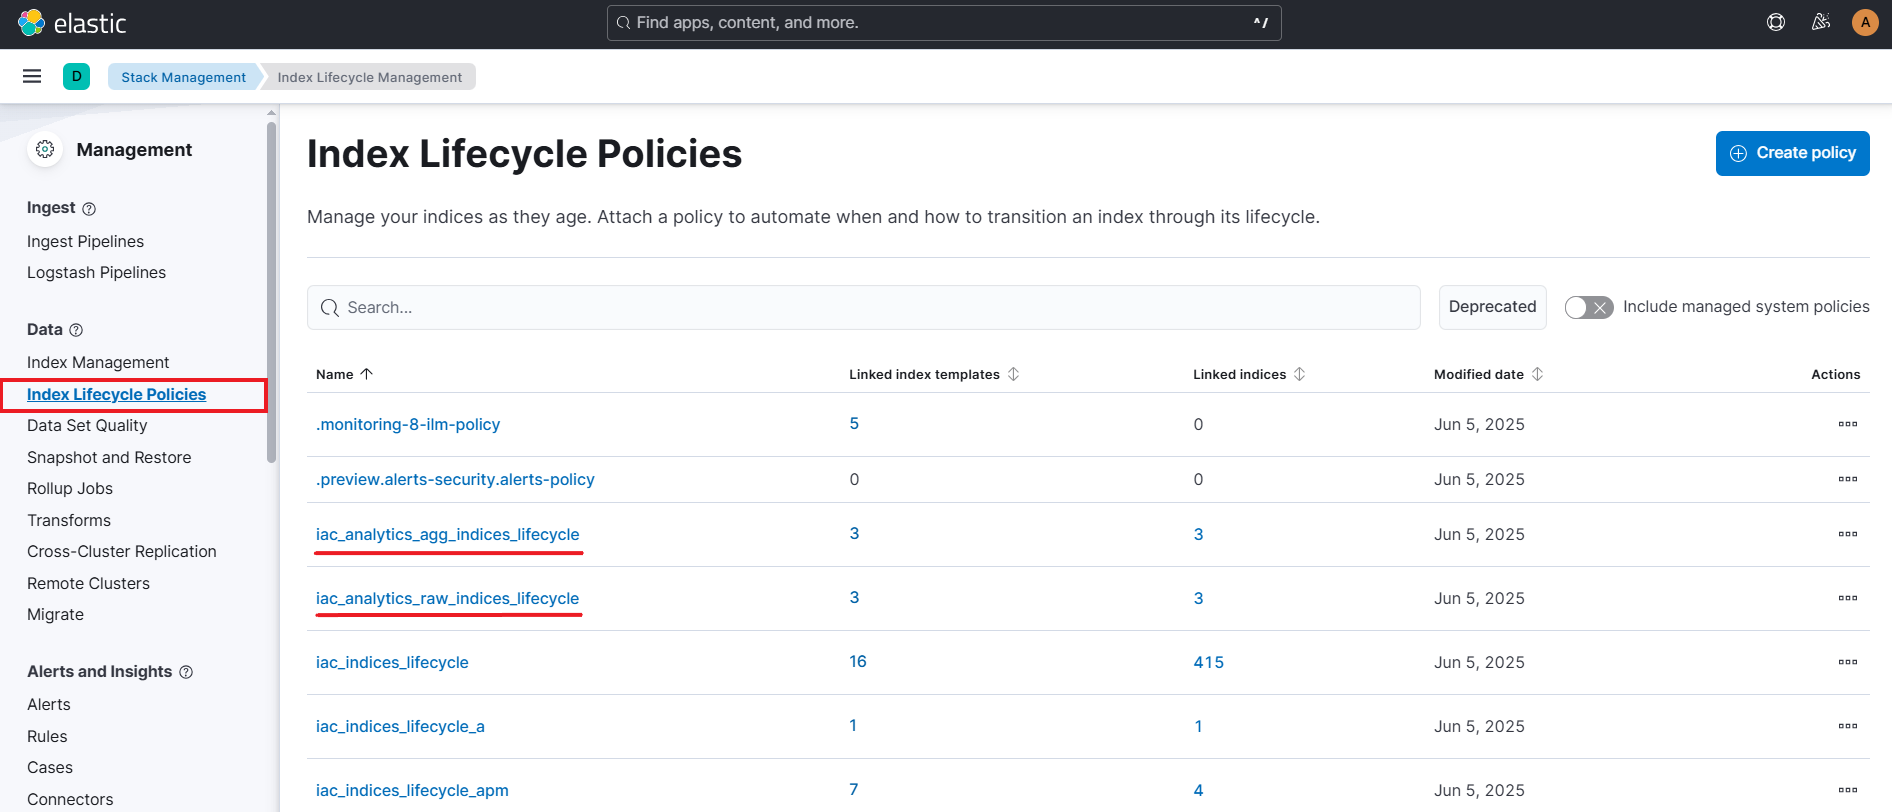
Out of the box, Elasticsearch features two preset lifecycle policies governing the retention and deletion of analytics-related indices:
iac_analytics_raw_indices_lifecycle defines the lifecycle policy for indices storing raw events (for instance, analytics-workspace-events). For the policy, major retention and deletion settings are as follows:
Warm phase: 30 days, during which you can search for events and update them infrequently.
Cold phase: 90 days, during which you can search for events infrequently, but no updates are allowed.
Delete phase: when an event is older than 365 days, it is removed entirely.
iac_analytics_agg_indices_lifecycle defines the lifecycle policy for indices storing aggregated event data (for example,dw-analytics-cm-overview). For the policy, major retention and deletion settings are as follows:
Warm phase: 365 days, during which you can search for events and update them infrequently.
Cold phase: 1095 days, during which you can search for events infrequently, but no updates are allowed.
No Delete phase
To view a policy configuration, click it in the list.
Index backups
To ensure data reliability and disaster recovery, WorkFusion offers index backup configurations preset for you at the installation level. Based on the configurations, snapshots of OOTB indices are taken at weekly intervals.
Using the snapshots, you can restore indices as needed:
In Elasticsearch, go to Snapshot and Restore.
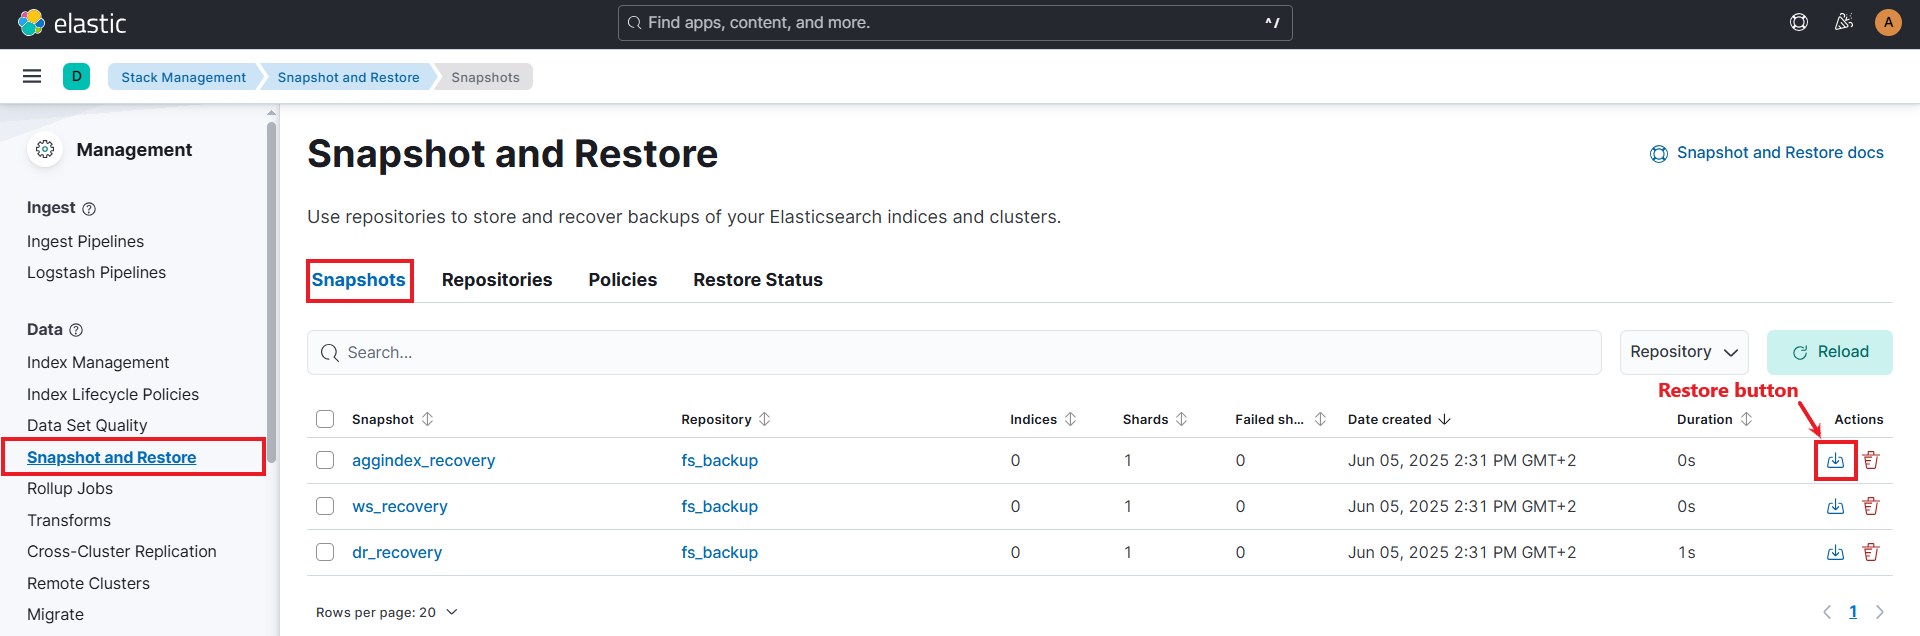
On the Snapshots tab, choose the snapshot you need and click the Restore button associated with it.
Analytics data for AI Agent dashboards
Each AI Agent dashboard has a specific index linked to it. AI Agent bundles include configurations for data index management where you can define the following for a specific AI Agent dashboard:
Data index name
Lifecycle policy
Index backup configuration
For details on the AI Agent analytics assets in a bundle, see Package assets into AI Agent Asset Bundle.
When an AI Agent bundle is imported to Control Tower, the said configurations automatically create indices and apply lifecycle policies, templates, and backups in Elasticsearch.
Both OOTB and AI Agent dashboards use a single RabbitMQ queue and Logstash pipeline. All the services send events to the single RabbitMQ queue, and the Logstash pipeline contains all the aggregation logic.
Access Analytics
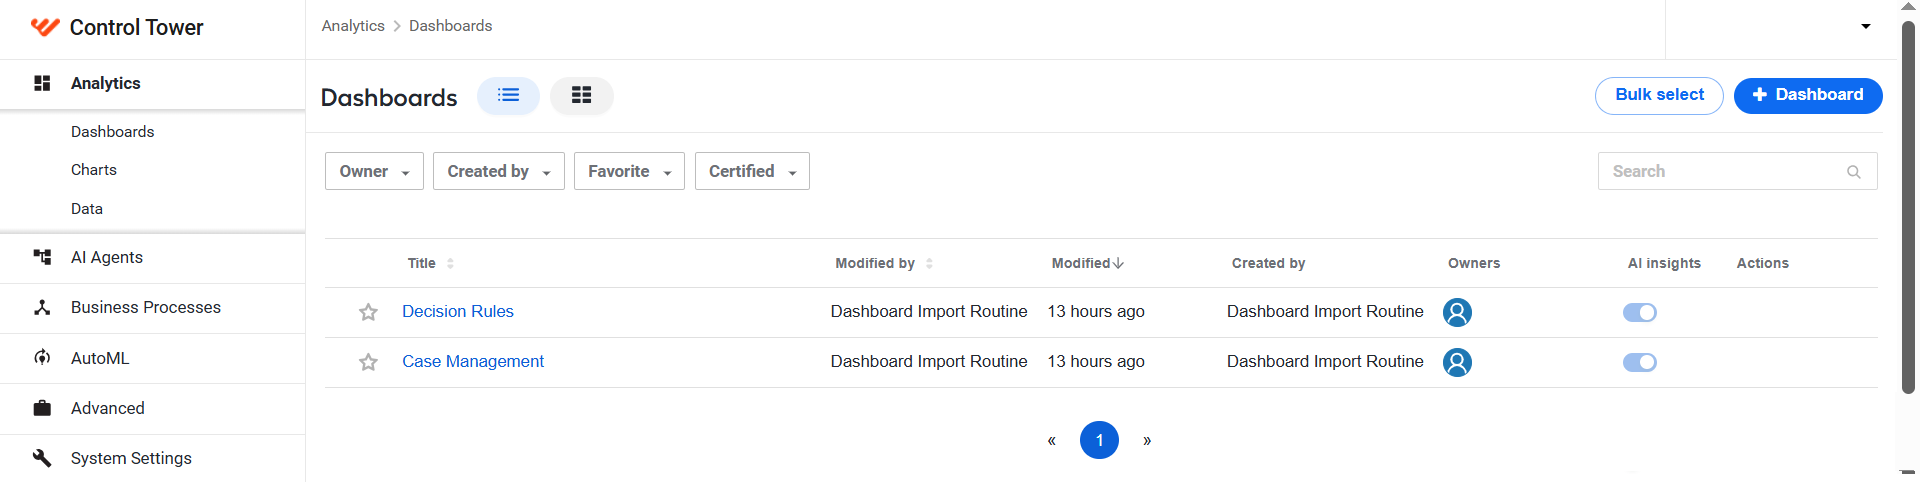
To access the analytics capabilities in Control Tower, log into the application and open the Analytics menu. From Control Tower, you can leverage the entire range of analytics capabilities, subject to your role and permissions:
Create, customize, and view dashboards, charts, datasets
Manage the database connection
Set up reports and alerts
 note
noteIf any of the Analytics menu items (Dashboards, Charts, Data, Reports & Alerts) are unavailable on your Control Tower instance, check whether your role and permissions allow accessing them. For the Reports & Alerts capability, also check the prerequisites are met and the features are activated as described in the guide.
To access the analytics in Workspace, log in to the application and navigate to the Analytics tab. From Workspace, you can only view the Case Management OOTB dashboard, provided you have required Workspace permissions.

For details on working with the dashboard, read the Case Management dashboard guide.
OOTB dashboards
Out of the box, WorkFusion provides the following Superset-based dashboards:
Case Management, available both in Control Tower and Workspace. The Workspace dashboard instance has limited functionality as compared to the one in Control Tower.
Decision Rules, available only in Control Tower.
In addition to the OOTB dashboards, you can create custom ones from scratch or by copying and altering the OOTB ones. For details, read Create and manage charts and dashboards.
OOTB charts
To access OOTB charts, follow the steps below:
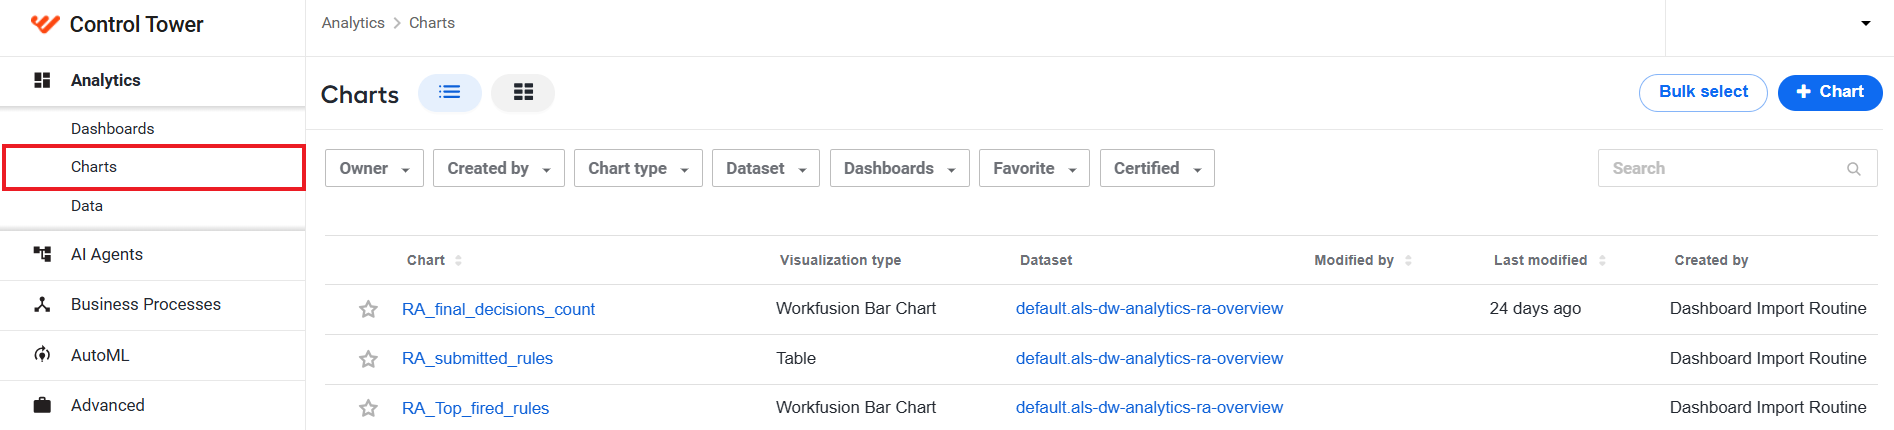
In Control Tower, go to Analytics > Charts and click the +Chart button.

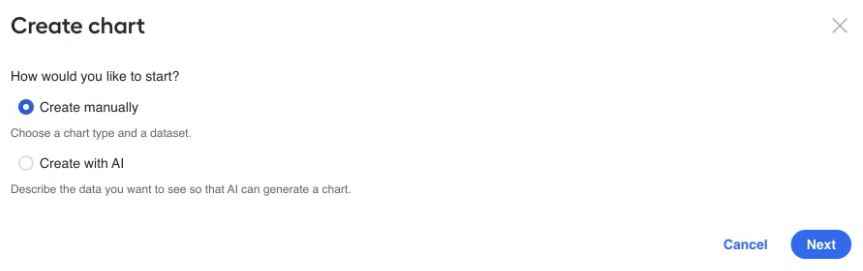
In the Create chart dialog, choose Create manually. The step is skipped if AI Chart Generator is disabled.
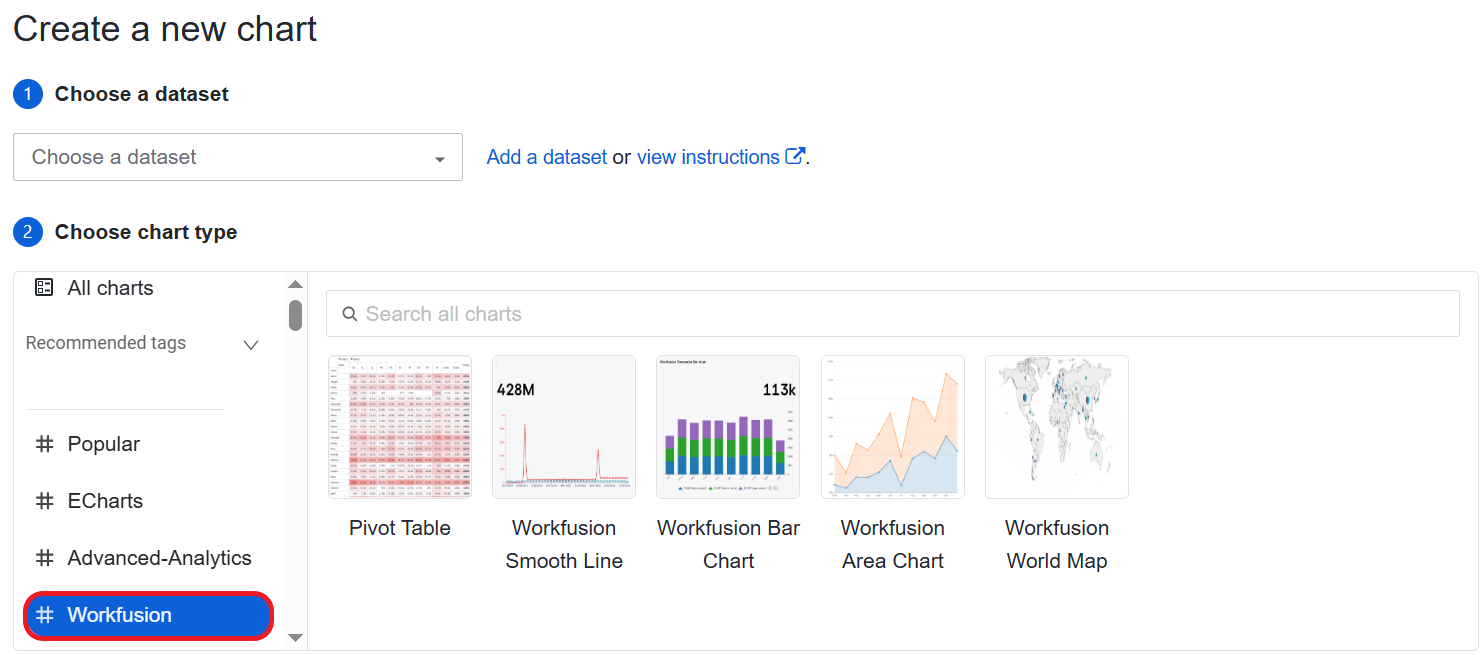
On the Create a new chart page, go to the Choose chart type step and find the Workfusion label under which the following customized charts are available out of the box:
Smooth Line
Bar
Area
World Map
You can use the charts as is or customize them using various available controls.
Leverage AI capabilities
Work.AI analytics offers the following AI-powered capabilities:
AI insights for automated building of reports based on dashboard metrics
AI Chart Generator for automated building of charts with Large Language Models (LLM) based on user prompts
Both capabilities are enabled at installation by setting the advanced_analytics flag in the installer to true. To leverage the capabilities, you should also have the following permissions assigned to you in Control Tower: Dashboard AI Insights and AI Chart Generator. For instructions on assigning the permissions, read Manage Control Tower roles and permissions.
The speed of the AI Insights and AI Chart Generator features depends on the ML Ops configuration. If pods are used with the zero-scaling approach, it takes several minutes for reports and charts to be generated and displayed. If the pods are in a GPU, the reports and charts are ready within a minute.
Get analytics insights with AI
The AI insights feature analyzes the dashboard metrics for you and creates a report with insights based on key performance indicators (KPI). The KPIs are preconfigured at the dataset level for each of the dashboard charts. To view and manage the KPIs for a chart, follow the steps below:
Go to Analytics > Charts and, in the list, click the chart for which you want to see or modify the KPIs.
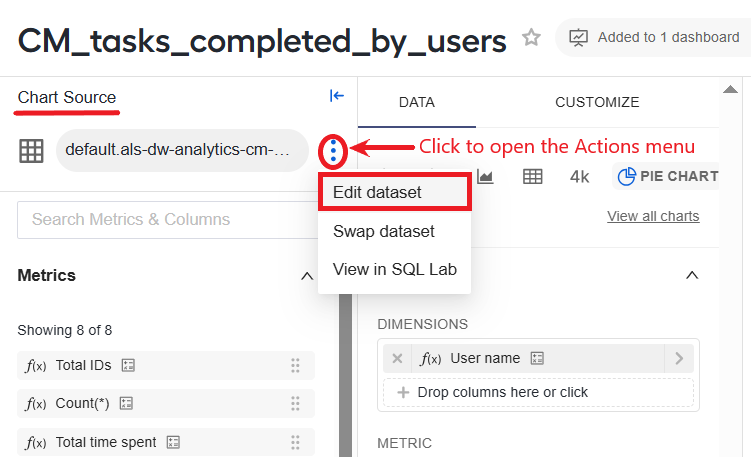
In the Chart Source area, open the Actions menu for the dataset underlying the chart and choose Edit dataset.
In the Edit Dataset window, go to the METRICS tab listing all datapoints included in the chart. The KPIs for generating AI insights are assigned a value in the Order column.
If you make any changes to the KPIs, make sure to click Save.
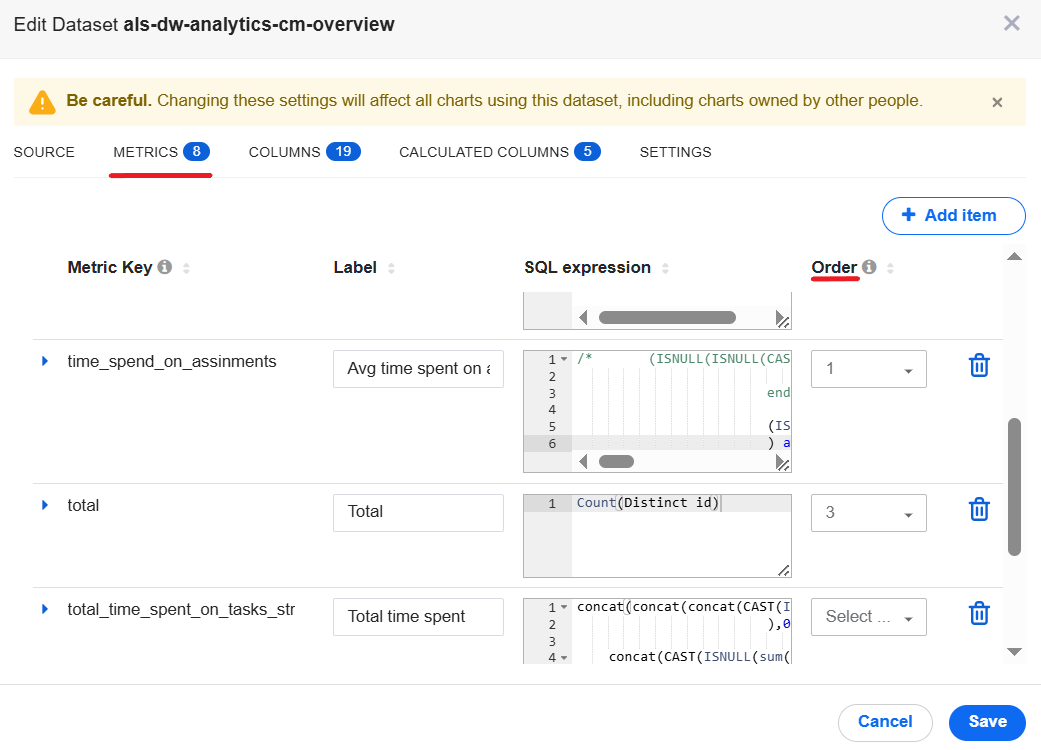
The possibility of changing KPIs is only limited to Admin users and dataset owners.
When you import or export a dashboard in a bundle, the preset KPIs for generating insights are also imported or exported within it.
To generate a report using the AI insights feature, follow the steps below:
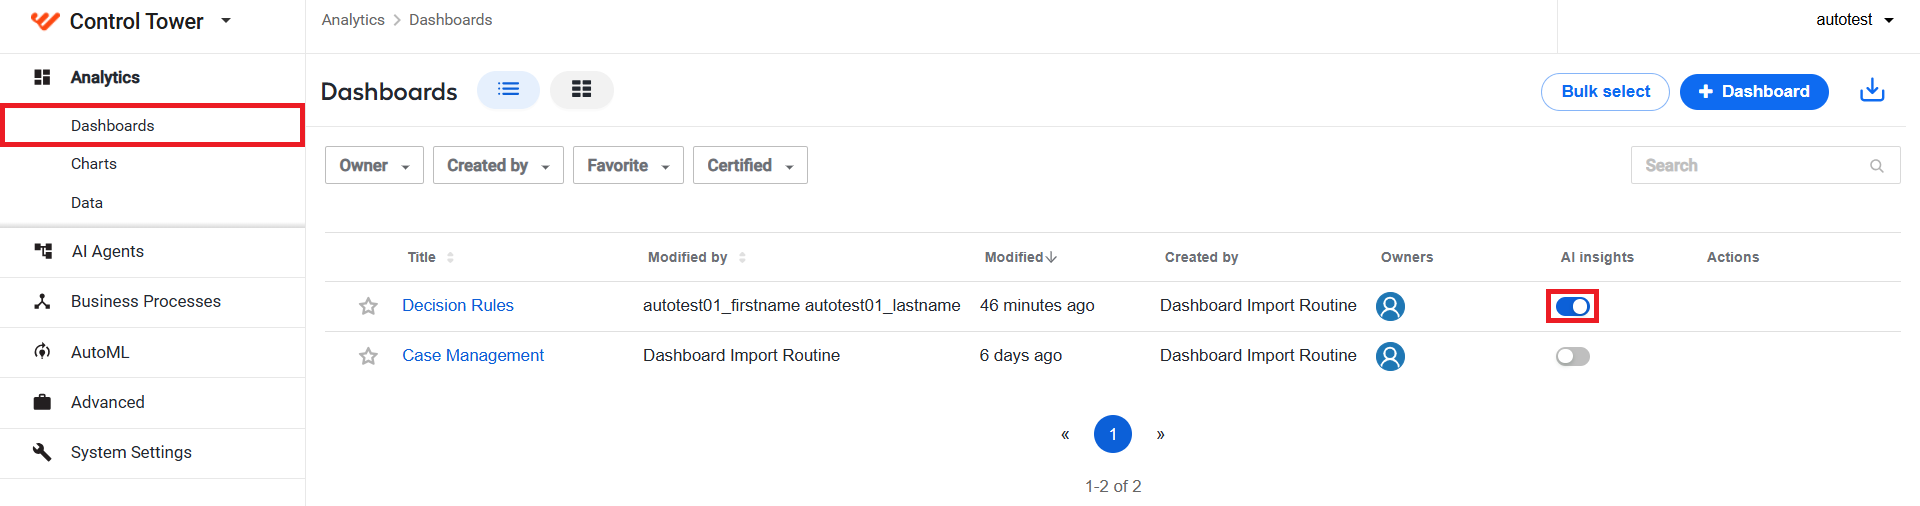
On the Dashboards list in Control Tower, switch the AI insights toggle (disabled by default) associated with the dashboard where you want to use the feature. Mind that you can switch the toggle on or off only if you are the dashboard owner.
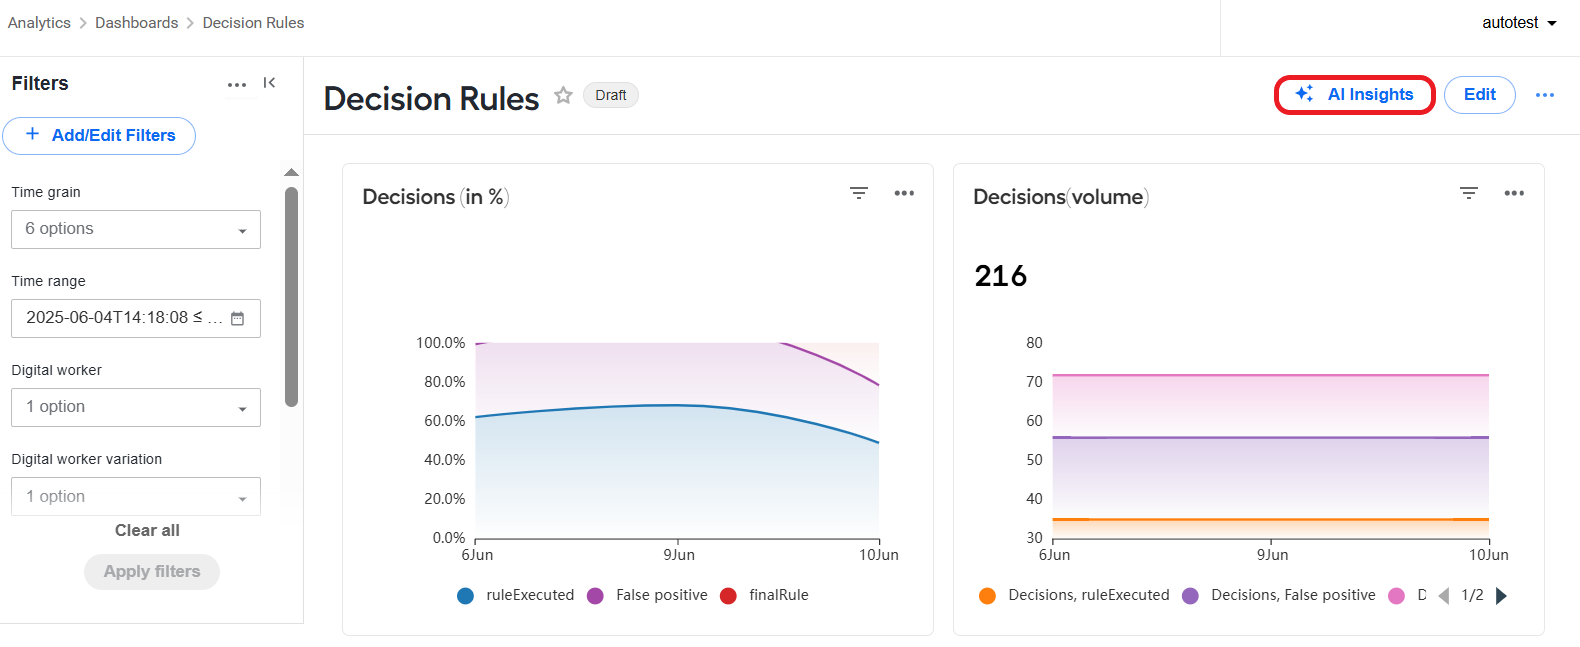
Click the dashboard name in the list to open it and then click the AI Insights button. The button is only visible if you switched on the toggle as described in step 1.
For the Case Management dashboard, the AI Insights button is available both in Control Tower and Workspace, provided the AI insights toggle in Control Tower is on.
GenAI creates a report automatically based on dashboard data and preset KPIs. The report looks similar to this:
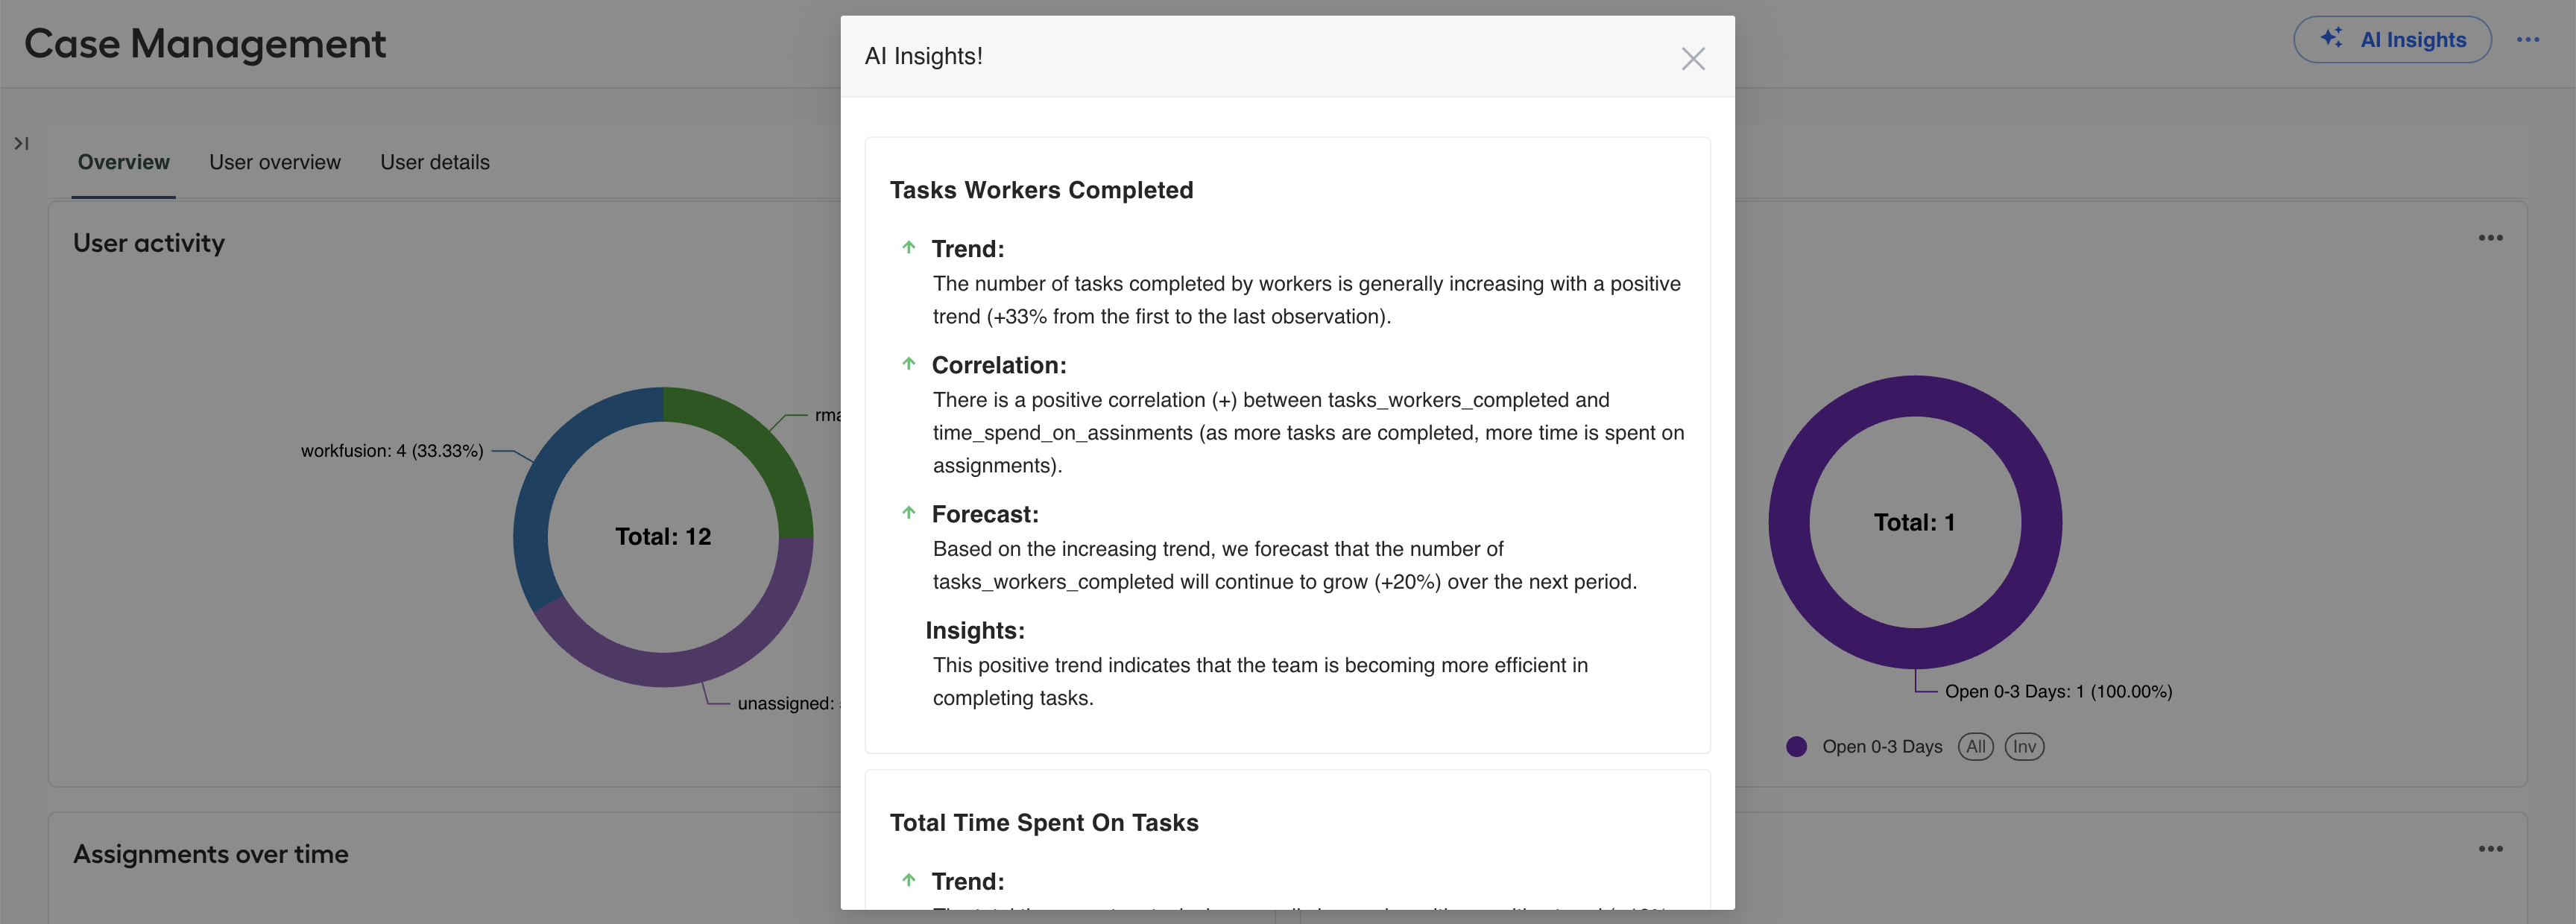
A generated report can include the following information:
Trend: identified significant patterns in the dashboard data.
Correlation: detected relationships between variables that might not be immediately obvious.
Anomaly: unusual data points or outliers.
Forecast: GenAI predicts how KPIs will evolve based on current trends.
Insights: concise summary conclusions based on KPIs.
In a report, you can also see the following indications:
| Icon | Meaning |
|---|---|
 | Downward KPI trend |
 | Upward KPI trend |
 | No changes in the trend: remains upward or downward |
Create charts with AI
The AI Chart Generator feature allows you to create charts using natural language prompts. It eliminates the need for manual chart creation, simplifying the reporting process for non-technical users. You can input a query or describe the data you want visualized, and Gen AI automatically generates a chart.
For detailed instructions on using the feature, read Create and manage charts and dashboards | Create chart.
You can create charts with AI only if both the conditions are satisfied:
In the Work.AI installer, the
advanced_analyticsflag is set totrue.You have the AI Chart Generator permission enabled for your role.
Monitor analytics interactions in Kibana
Kibana features a set of logs capturing the following:
User interactions with WorkFusion Analytics
Data from user interactions
API calls to the analytics component and their results
By default, only Administator users can see the Control Tower application menu and access Platform Monitor.
To access the logs, follow the steps below:
Log into Control Tower and, in the top left application menu, choose Platform Monitor.

In Kibana, in the Application logs section, find the SUPERSET header and click it.
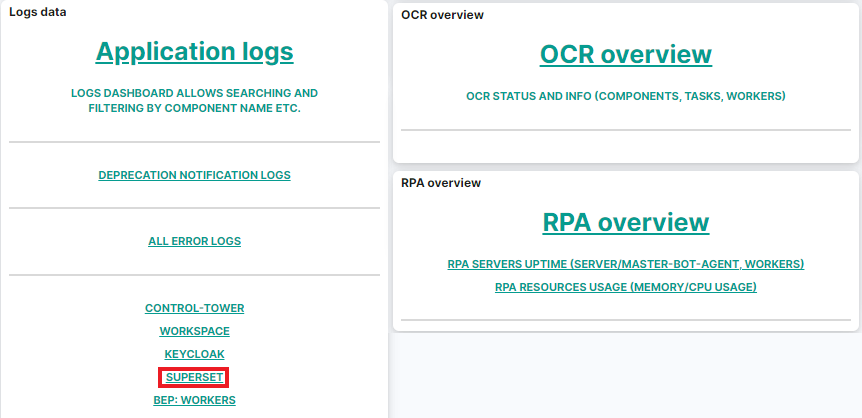
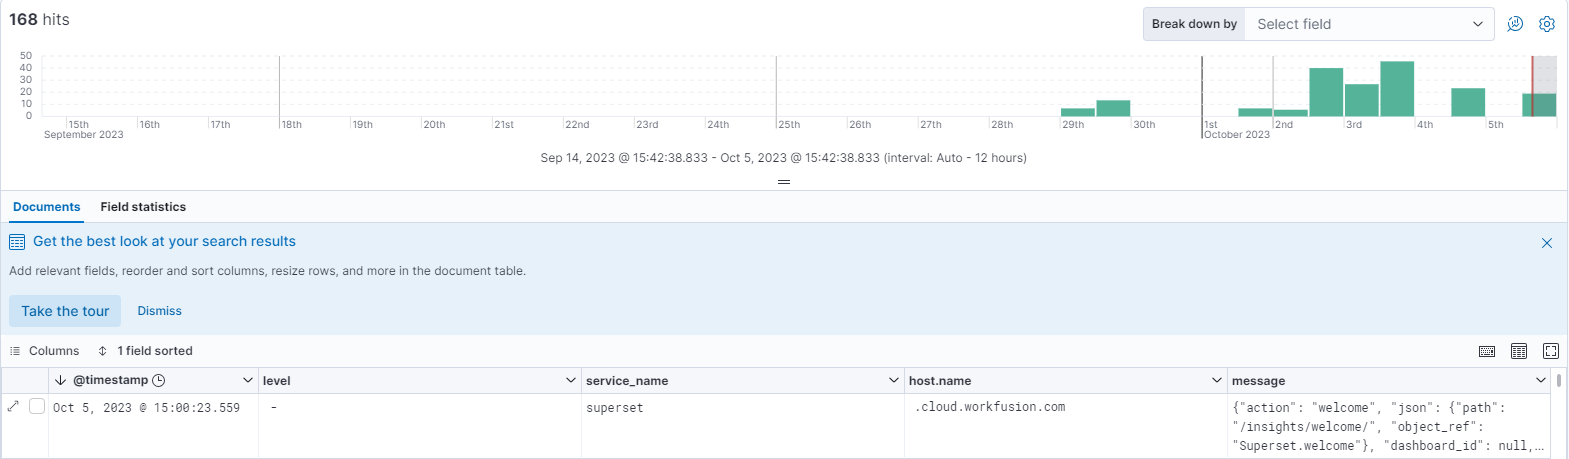
On the displayed page, you see the interaction data as shown below: