Case Management dashboard
The Case Management dashboard lets you monitor the Workspace assignment statistics and manual review performance, in particular:
Track and evaluate how efficiently workers perform their roles
Identify performance trends for specific AI Agents
Visualize key metrics related to Manual Task assignment and completion
Identify bottlenecks in how manual review tasks are completed
The dashboard collects data using an event-based approach. All dashboard data is stored and managed using Elasticsearch indices.
Case Management in Control Tower
To access the Case Management dashboard in Control Tower, go to Analytics > Dashboards and choose Case Management in the dashboard list.
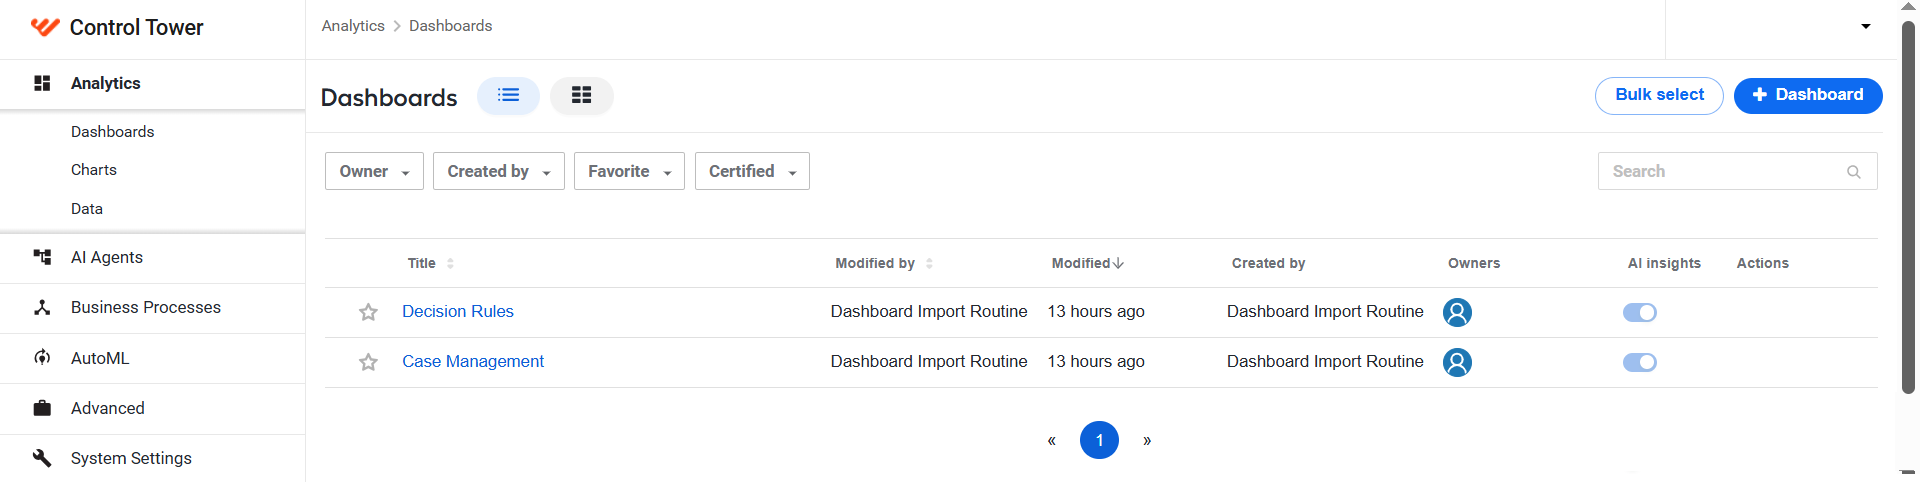
If you can't access the dashboard, make sure you have all necessary permissions for your role.
The Case Management dashboard offers the following three information levels:
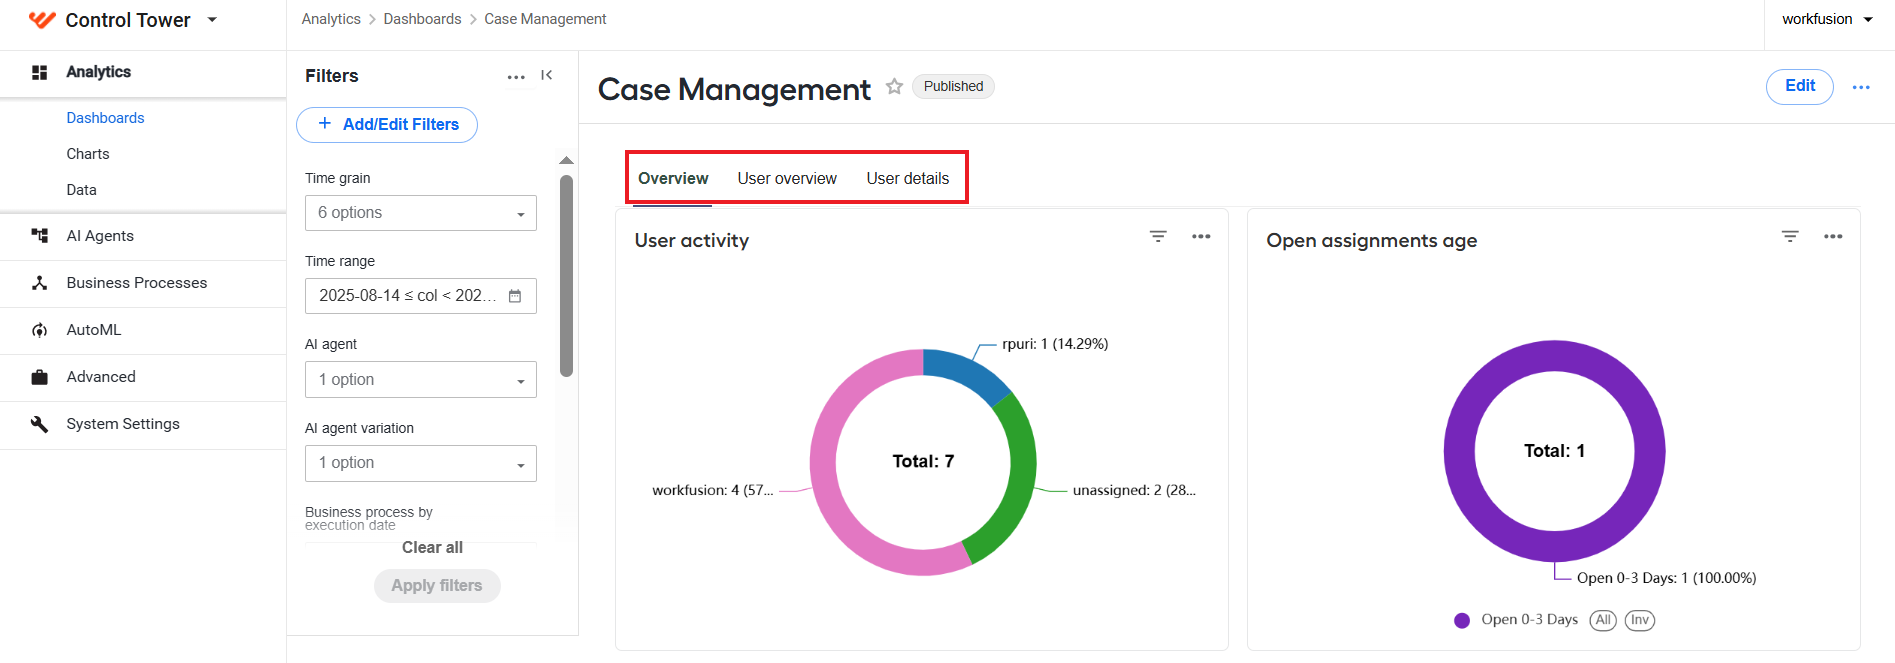
You can filter and sort dashboard data on any and all of the tabs based on various parameters, such as time, Business Process, AI Agent, and so on. For more information, read Create and manage charts and dashboards | Filter dashboard data.
To avoid refreshing the dashboard manually if you need to do this frequently, you can set an auto-refresh interval as described in the guide. However, mind that the interval setting is only valid for the duration of your current session. After a logout, you will have to configure the auto-refresh interval anew.
Overview
On the Overview tab, you can find the following information on assignments and workers:
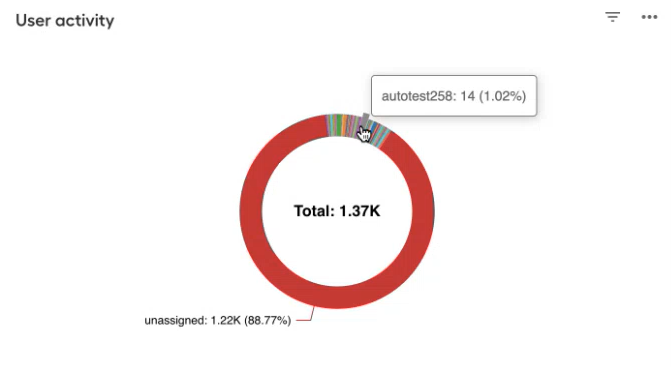
The User activity chart displays the distribution of assignments across workers: how many assignments were assigned to specific users and how many remain unassigned.
When you hover over a segment in the pie chart, a tooltip is shown, indicating a username and the quantity and percentage of assignments assigned to the user.
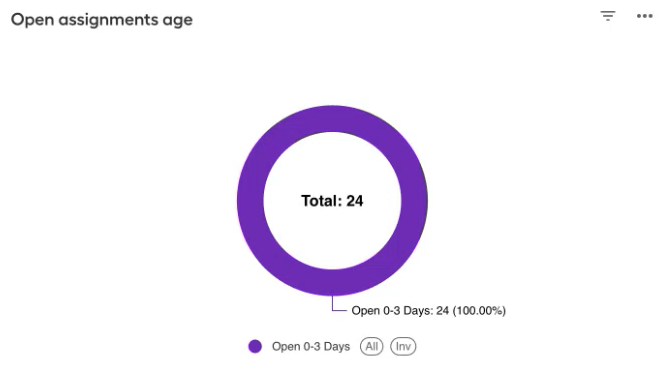
The Open assignments age chart shows for how long assignments remain open.
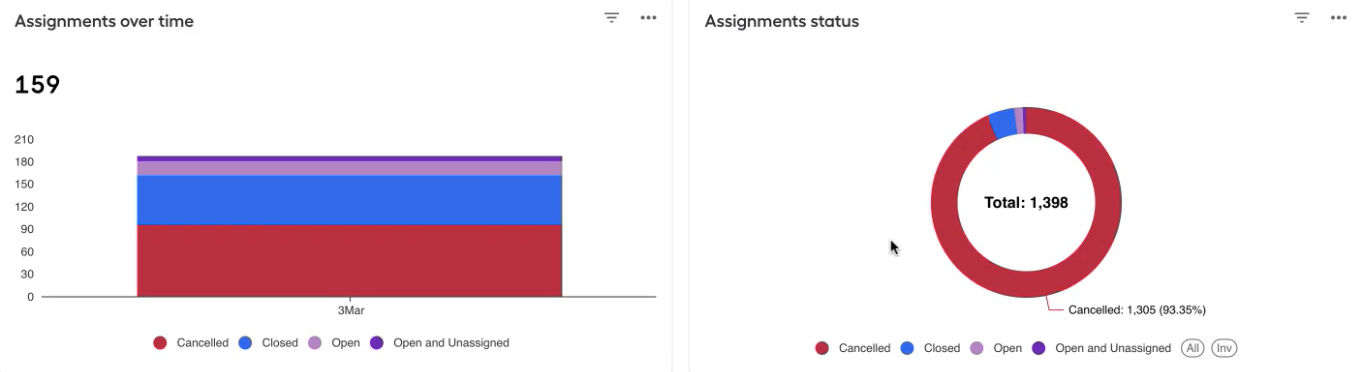
The Assignments status chart shows the total number of assignments available in Workspace and their distribution by status. The Assignments over time chart shows how the assignment distribution by status changes over time. You can adjust the period and time grain for the chart using Time range and Time grain dashboard filters.
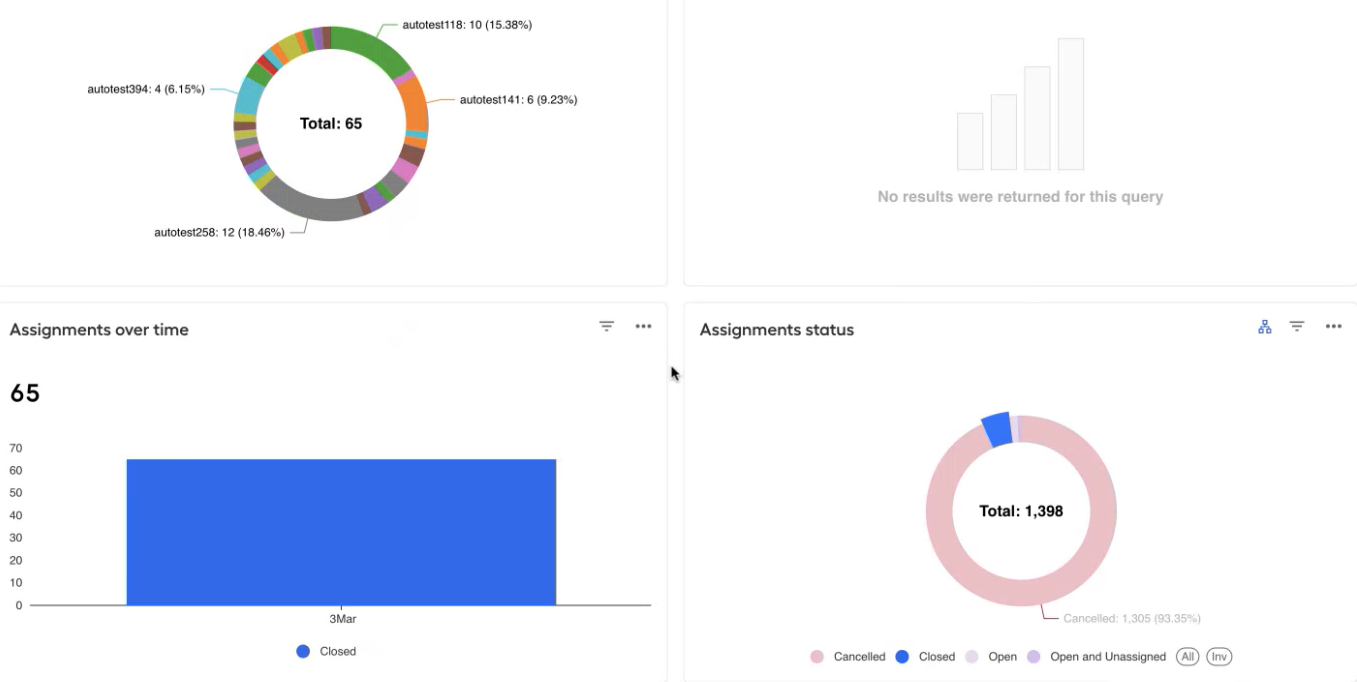
Clicking a segment in the Assignments status chart causes all the dashboard charts to change their display. As a result, the dashboard will show only the information on the assignments with the status corresponding to the segment you clicked. For instance, if you click the Closed status segment in the Assignments status chart, the dashboard will show information only on closed assignments, ignoring those with other statuses:
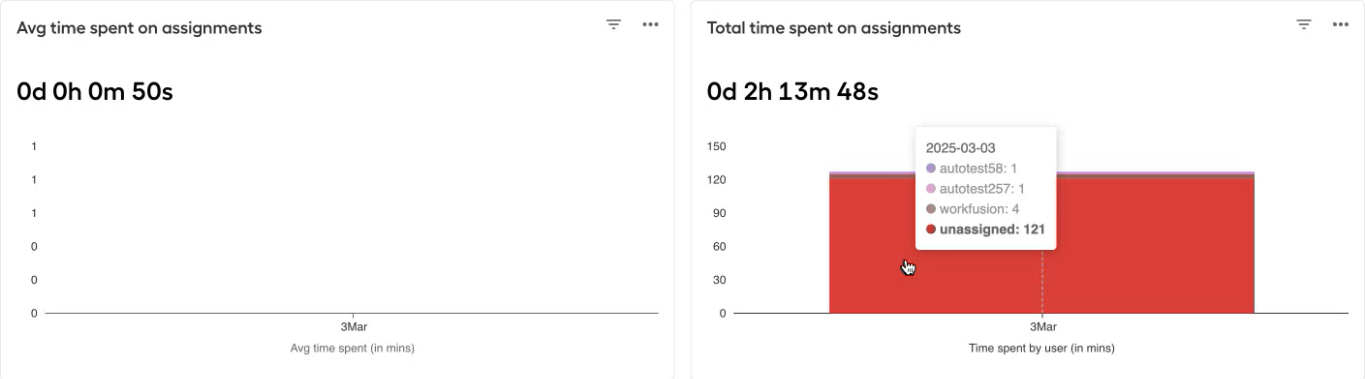
The Avg time spent on assignments and Total time spent on assignments charts show the average or total time (in minutes), accordingly, a particular worker spends working on tasks assigned to them in Workspace over a specific time period. You can adjust the period and time grain for the chart using Time range and Time grain dashboard filters.
The Average assignments cycle time chart shows the average time from the moment when assignments are created to the moment when they are closed and how the average values are distributed over a specific time period. You can adjust the period and time grain for the chart using Time range and Time grain dashboard filters.
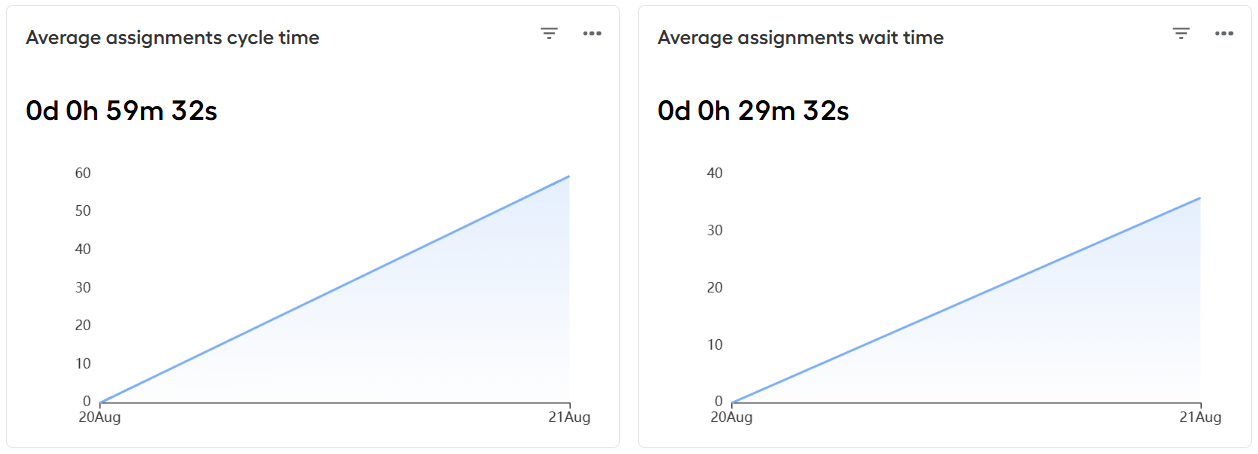
The Average assignments wait time chart shows the average time from the moment when assignments are created and the moment when the assignments are assigned and opened in Workspace. You can also see how the average values are distributed over time. To adjust the period and time grain for the chart, use the Time range and Time grain dashboard filters.
User overview
The User overview tab provides you with detailed insights into workers' activity in Workspace, in particular:
The User overview table lists all workers (usernames) with their performance metrics, such as:
- Total assignments closed or opened by a specific worker
- Tasks reassigned to the worker and their completion percentage
- Average, minimum, and maximum time the worker spent processing assignments
- Average wait time before an assignment is opened

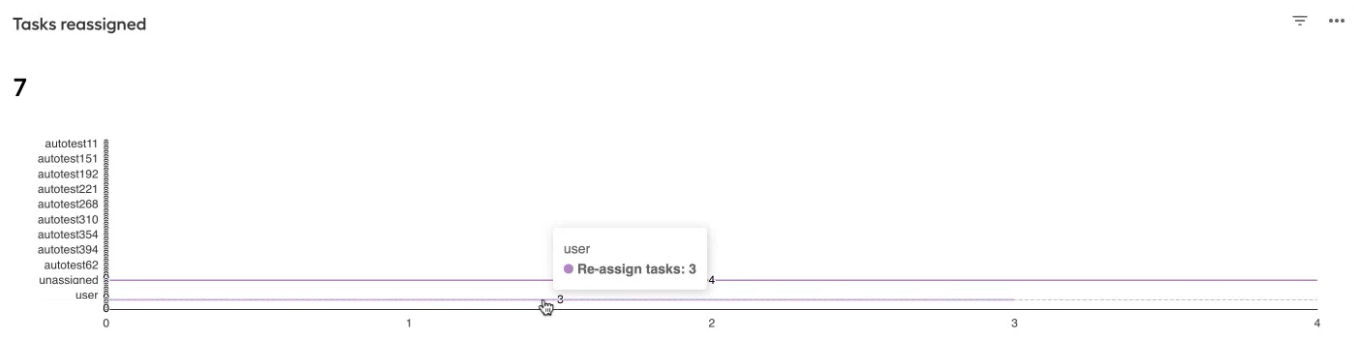
The Tasks reassigned chart shows the total number of reassigned tasks (the digit in the top left corner) and their distribution across users. The X-axis time values are adjusted using the Time grain dashboard filter.
If you hover over a chart line associated with a specific username, you can see a tooltip showing the number of tasks reassigned to the worker with the username. For instance, in the sample chart below, you can see that the worker named user was reassigned three tasks.
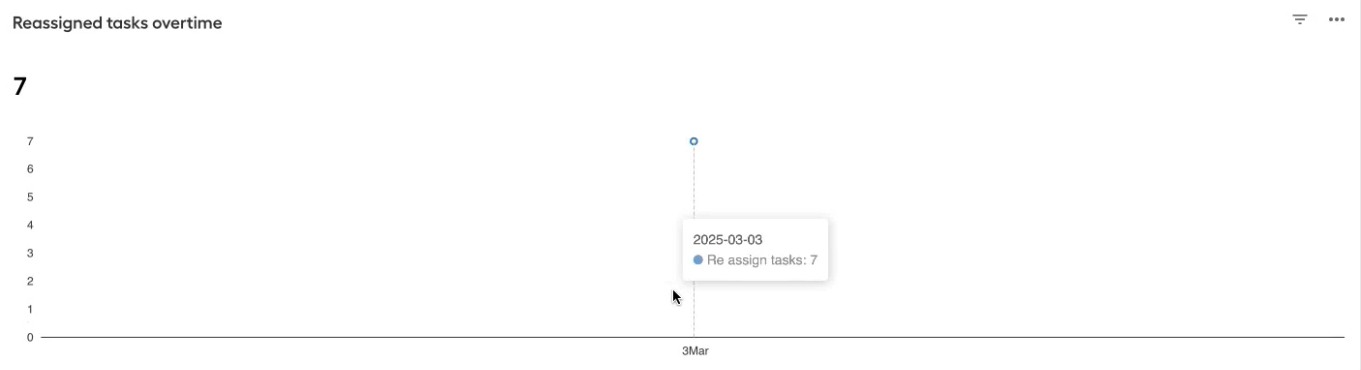
The Reassigned tasks over time chart shows the total number of reassigned tasks within a specified period (the digit in the top left corner) and how the number of reassigned assignments changes over time. You can adjust the period and time grain for the chart using Time range and Time grain dashboard filters.
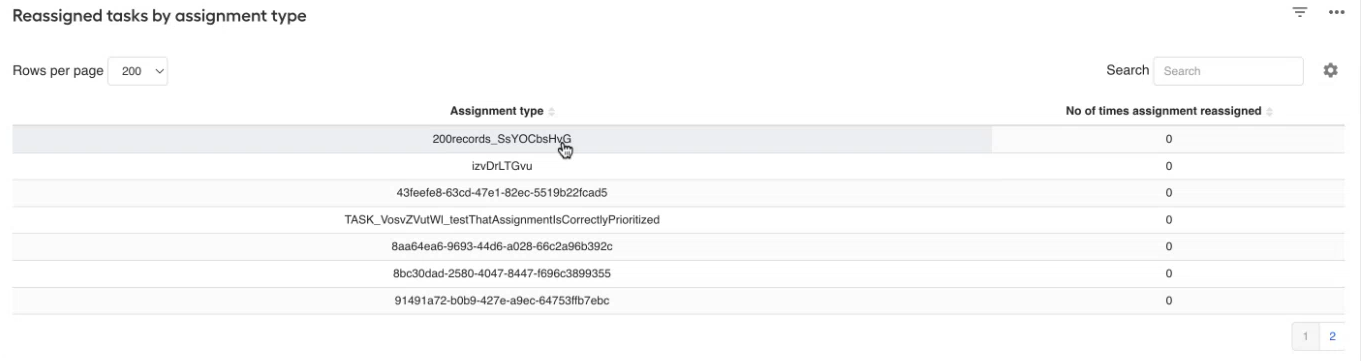
The Reassigned tasks by assignment type table lists reassigned assignment types and shows how many times those were reassigned. The assignment type is the type of task (for instance, Information Extraction or Document Classification) specified in the Task column on the assignment list.
The Reassigned task details table lists reassigned tasks and their details, such as assignment ID, name, and status, assignees, and number of times it was reassigned. From the table, you can also view the assignments in Workspace by clicking a link in the respective column.

When a user works on an assignment without assigning it to anyone, the User overview tab will not display the assignment wait time and time spent on such an assignment. However, the Overview and Users details tab will display these data with the Unassigned user name.
User details
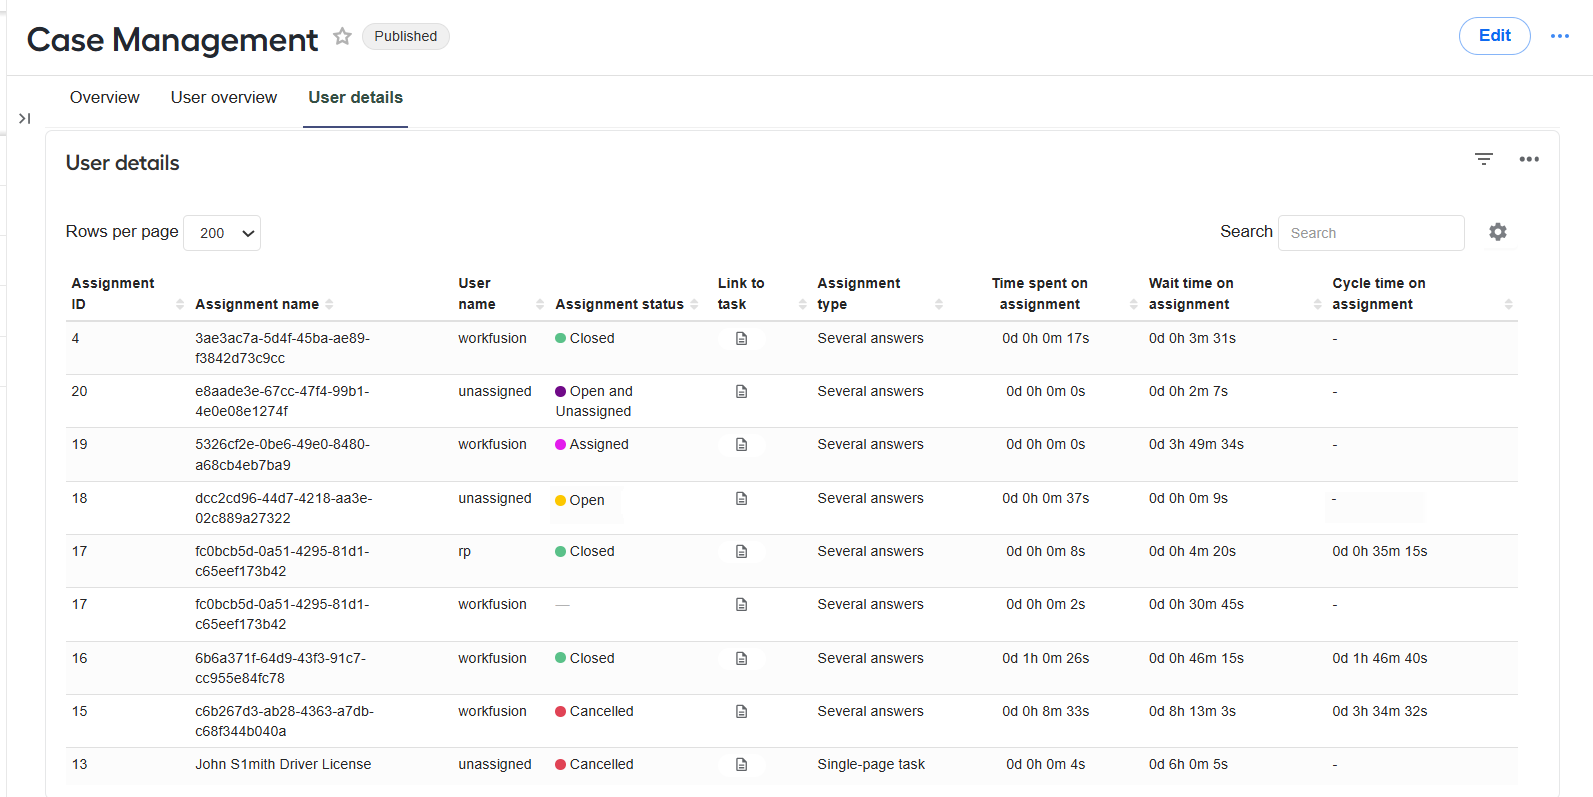
The table on the User details tab brings together assignment-related data, in particular:
Workers who were assigned specific assignments
Assignment ID, name, and status
Task type (for instance, Information Extraction)
Links to tasks
Time workers spent on assignments
Time before an assignment is opened in Workspace (wait time)
Time from the moment an assignment is created till the moment it is closed (cycle time)
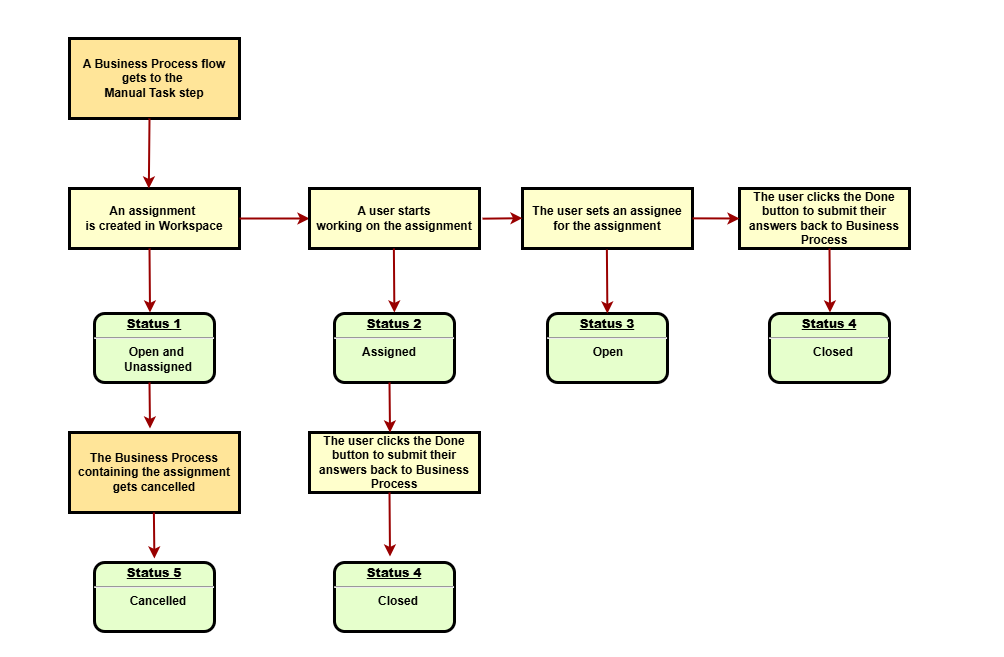
Assignment statuses
The following statuses are possible for assignments:
Open and unassigned: an assignment gets the status as soon as it is created in Workspace and before a user assigns it to anyone.
Assigned: an assignment gets the status once a user assigns it to someone.
Open: an assignment gets the status once a user opens it in Workspace and starts working on it.
Closed: an assignment gets the status once a user clicks the Done button in Workspace, and the answers are
Cancelled: the status means a Business Process with the manual review assignment was cancelled.
Case Management in Workspace
To access the Case Management dashboard in Workspace, log into the application and go to the Analytics tab.

If you can't access the dashboard, make sure you have all necessary permissions for your role.
From the Case Management dashboard in Workspace, you can leverage the following capabilities:
View the same visualizations as those available in Control Tower, subject to permissions or restrictions:
warningWhen a user works on an assignment without assigning it to anyone, the User overview tab will not display the assignment wait time and time spent on such an assignment. However, the Overview and Users details tab will display these data with the Unassigned user name.
Filter dashboard data using the same filtering options as those available in Control Tower. For details, read Create and manage charts and dashboards | Filter dashboard data.
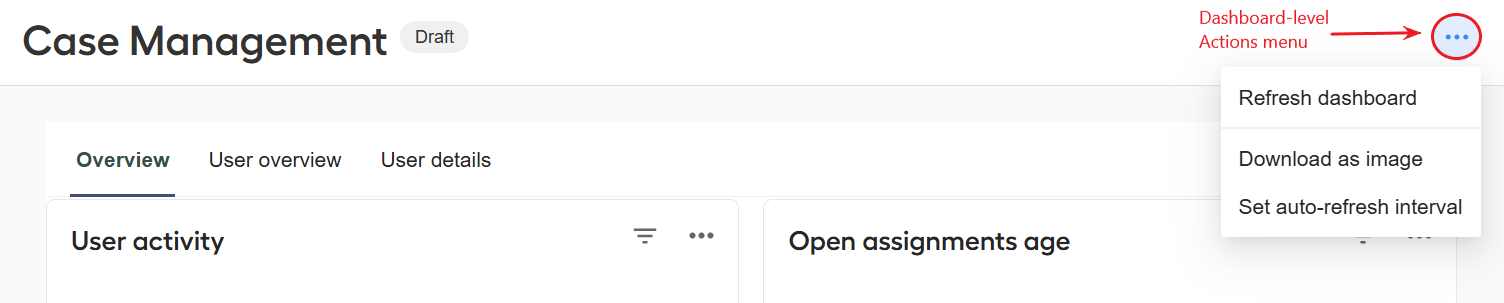
Perform the following operations with dashboards using the dashboard-level Actions menu:
Download as an image
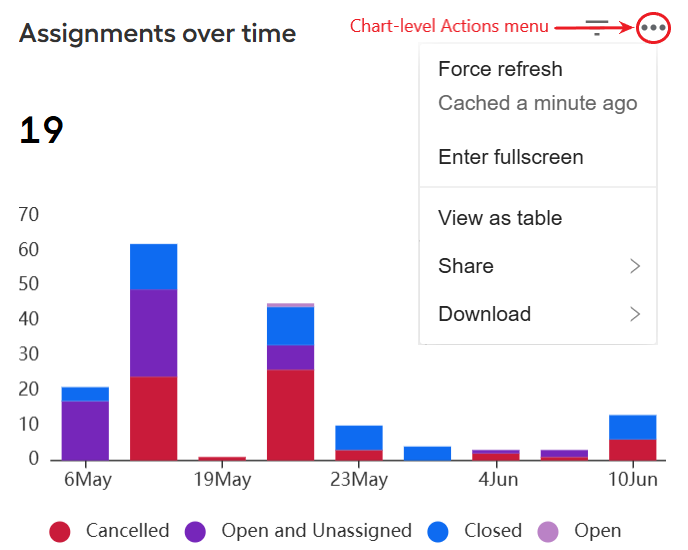
Perform the following operations with charts using the chart-level Actions menu:
- Share
- Export in a variety of formats
- Refresh data
- Change the visualization format
Create reports using the AI Insights feature, provided the AI insights toggle in Control Tower is on.
The following manipulations are not available in the Case Management dashboard in Workspace:
Editing dashboards and charts
Sharing and embedding dashboards
Viewing chart queries
Enabling or disabling the AI insights capability and modifying its underlying metrics
AI-powered reporting
For the Case Management dashboards in Control Tower and Workspace, you can leverage the AI insights capability. It analyzes the dashboard metrics for you and creates a report with insights based on key performance indicators (KPI). The KPIs are preconfigured at the dataset level for each of the dashboard charts.
For instructions on enabling and using the AI insights capability, read Learn about analytics in WorkFusion | Get analytics insights with AI.