
Analyze Thread Dump
Retreive dump
You can retrieve the overall Java process dump via the command line as described in the Get Thread Dump section.
Alternatively, to get a dump of the threads related to the Bot Task execution in a Business Process (BP), use the api/v1/monitoring/bots/thread-dumps REST API endpoint.
Use analytic tools
To conduct a thread dump analysis, use the following tools:
View through a textual dump.
Employ user interface (UI) tools like http://fastthread.io.
Download a file using an FTP client and upload it to the web tool. It provides general stats, such as total thread count grouped by status.
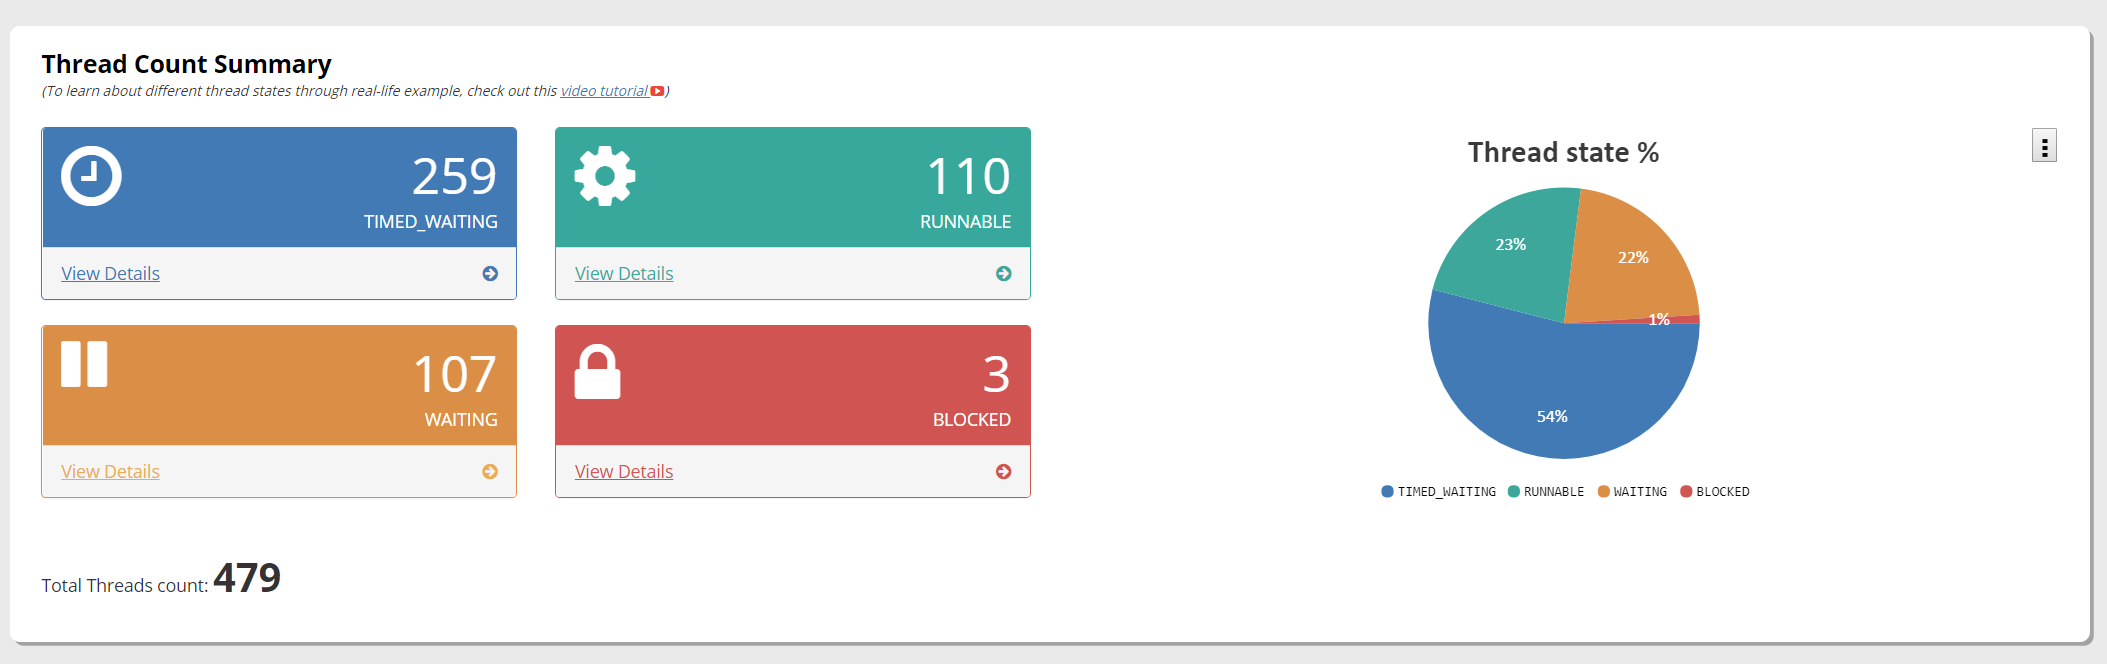
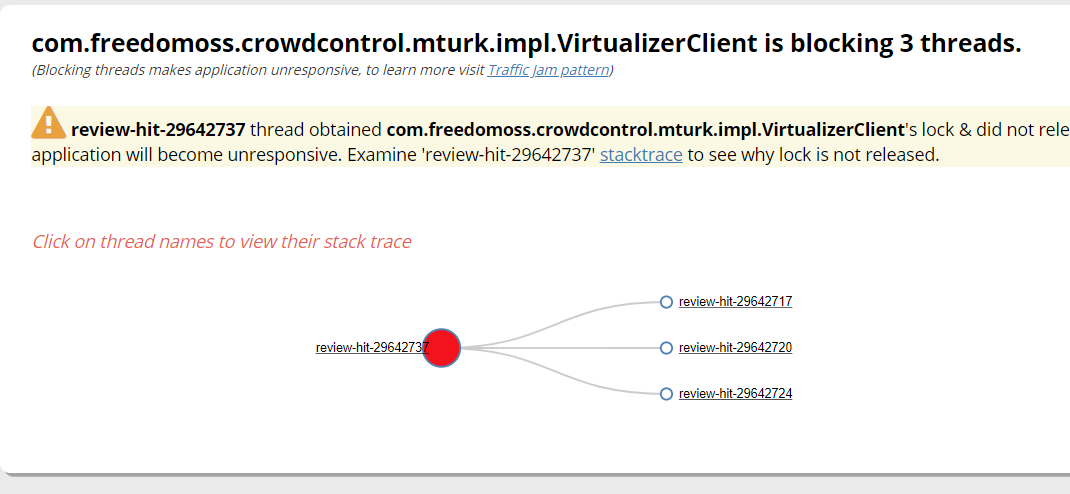
Three BLOCKED threads can indicate a performance issue. In this thread, the dump dump-example.txt HIT review threads are blocked by the usage of the same Worker:
Although there are many RUNNABLE threads, they are almost all JIT and GC threads that can hint at memory issues. Application threads are mainly
bot-results-run-*-hit-and are responsible for writing bot results to the database (DB). Also, this can be caused by large Bot Task outputs.Employ the FlameGraph visualization: https://github.com/brendangregg/FlameGraph.
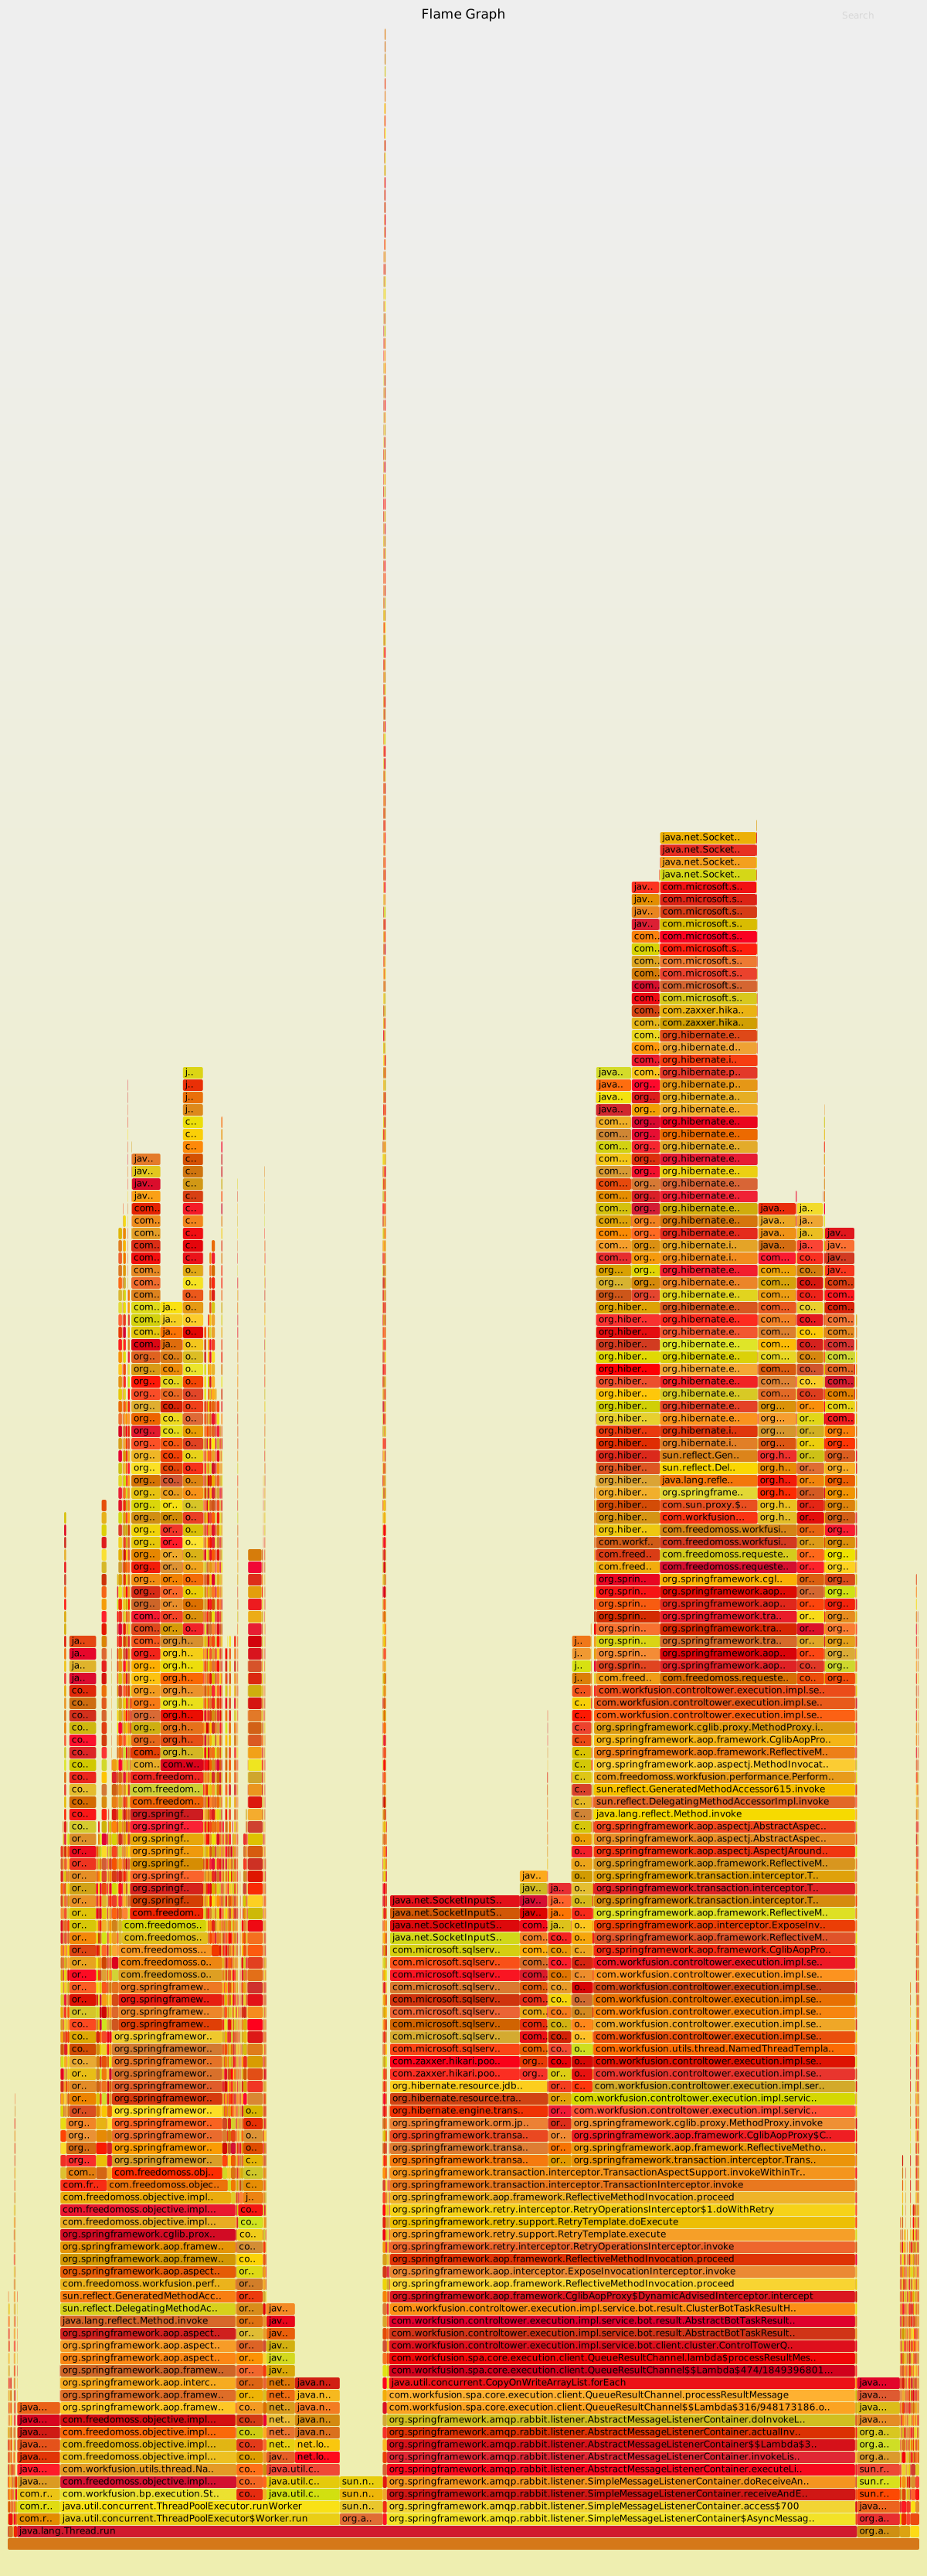
If there are multiple thread dumps, you can visualize them by using modified scripts.
Modifications:
- BLOCKED threads are not excluded.
- Threads with
socketAcceptin method names are not excluded because of DB or REST calls.
Usage:
Copy the text files with thread dumps to an analysis folder.
Copy
create-graph.sh,stackcollapse-jstack.pl,flamegraph.plto the same folder.Execute the script:
./create-gpaph.shThe script scans all text files in the current folder recursively and generates
flame.svgafter execution.Example: flame.svg
Analyze
Pay attention to tips
A common line in multiple dumps of the same thread can indicate a performance issue in that line. For example, a thread stuck in a JDBC call is a clue to check DB stats and query logs.
The recommended way is to start investigation from the application classes in the stack trace. For example, those with the
com.workfusion.\orcom.crowdcontrol.\package.A deeper analysis usually requires access to particular Control Tower (CT) version sources. You can find them in the bottom right corner.

Investigate Bot Task execution
You can identify Bot Task processing dumps via the machine-run*-* prefix in the thread name.
Thread.sleep in Bot Config
"machine-run-603-hit-35416-step-1820" \#920 prio=5 os\_prio=0
tid=0x00000000318a3000 nid=0x26d0 waiting on condition
\[0x000000006e87d000\]
java.lang.Thread.State: TIMED\_WAITING (sleeping)
at java.lang.Thread.sleep(Native Method)
at sun.reflect.NativeMethodAccessorImpl.invoke0(Native Method)
at
sun.reflect.NativeMethodAccessorImpl.invoke(NativeMethodAccessorImpl.java:62)
at
sun.reflect.DelegatingMethodAccessorImpl.invoke(DelegatingMethodAccessorImpl.java:43)
at java.lang.reflect.Method.invoke(Method.java:498)
at bsh.Reflect.invokeMethod(Reflect.java:134)
at bsh.Reflect.invokeStaticMethod(Reflect.java:98)
at bsh.Name.invokeMethod(Name.java:874)
at bsh.BSHMethodInvocation.eval(BSHMethodInvocation.java:75)
at bsh.BSHPrimaryExpression.eval(BSHPrimaryExpression.java:102)
at bsh.BSHPrimaryExpression.eval(BSHPrimaryExpression.java:47)
at bsh.Interpreter.eval(Interpreter.java:660)
at bsh.Interpreter.eval(Interpreter.java:754)
at bsh.Interpreter.eval(Interpreter.java:743)
at
org.webharvest.runtime.scripting.BeanShellScriptEngine.eval(BeanShellScriptEngine.java:134)
at
org.webharvest.runtime.processors.ScriptProcessor.execute(ScriptProcessor.java:74)
at
org.webharvest.runtime.processors.BaseProcessor.run(BaseProcessor.java:127)
at org.webharvest.runtime.Scraper.execute(Scraper.java:169)
at org.webharvest.runtime.Scraper.execute(Scraper.java:182)
at
com.freedomoss.crowdcontrol.webharvest.executor.LocalWebharvestTaskExecutor.executeWebHarvestTask(LocalWebharvestTaskExecutor.java:187)
at
com.freedomoss.crowdcontrol.webharvest.executor.LocalWebharvestTaskExecutor.executeWebHarvestTask(LocalWebharvestTaskExecutor.java:97)
at
com.workfusion.service.machine.BotRecordExecutionService.process(BotRecordExecutionService.java:171)
at
com.workfusion.service.machine.BotRecordExecutionService.process(BotRecordExecutionService.java:142)
at
com.workfusion.service.machine.BotRecordExecutionService.lambda$3(BotRecordExecutionService.java:113)
at
com.workfusion.service.machine.BotRecordExecutionService$$Lambda$428/544535371.run(Unknown
Source)
at
com.workfusion.utils.thread.ThreadMonitoringUtils.executeWithAllocatedMemoryCallback(ThreadMonitoringUtils.java:17)
at
com.workfusion.service.machine.BotRecordExecutionService.processSubmissionWithAllocationLogger(BotRecordExecutionService.java:113)
at
com.workfusion.service.machine.BotRecordExecutionService.lambda$0(BotRecordExecutionService.java:97)
at
com.workfusion.service.machine.BotRecordExecutionService$$Lambda$426/1429204113.run(Unknown
Source)
at
com.workfusion.utils.thread.NamedThreadTemplate.executeWithNamedThread(NamedThreadTemplate.java:10)
at
com.workfusion.service.machine.BotRecordExecutionService.processRecord(BotRecordExecutionService.java:97)
at
com.workfusion.service.machine.thread.RecordProcessThread.run(RecordProcessThread.java:28)
at
java.util.concurrent.ThreadPoolExecutor.runWorker(ThreadPoolExecutor.java:1149)
at
java.util.concurrent.ThreadPoolExecutor$Worker.run(ThreadPoolExecutor.java:624)
at java.lang.Thread.run(Thread.java:748)
From the following stack trace lines, it's clear that a <script> tag inside <config> is under execution.
at org.webharvest.runtime.processors.ScriptProcessor.execute(ScriptProcessor.java:74)at org.webharvest.runtime.processors.BaseProcessor.run(BaseProcessor.java:127)
Find threads waiting for Data Stores
The following thread is stuck in a slow query caused by the usage of the pg_sleep(300* function inside the Data Store plugin.
Slow Data Store query in Bot Config
"machine-run-605-hit-35417-step-1822" \#1618 prio=5 os\_prio=0
tid=0x00000000406b6000 nid=0x510c runnable \[0x0000000062e0d000\]
java.lang.Thread.State: RUNNABLE
at [java.net](http://java.net/).SocketInputStream.socketRead0(Native
Method)
at
[java.net](http://java.net/).SocketInputStream.socketRead(SocketInputStream.java:116)
at
[java.net](http://java.net/).SocketInputStream.read(SocketInputStream.java:171)
at
[java.net](http://java.net/).SocketInputStream.read(SocketInputStream.java:141)
at
org.postgresql.core.VisibleBufferedInputStream.readMore(VisibleBufferedInputStream.java:143)
at
org.postgresql.core.VisibleBufferedInputStream.ensureBytes(VisibleBufferedInputStream.java:112)
at
org.postgresql.core.VisibleBufferedInputStream.read(VisibleBufferedInputStream.java:71)
at org.postgresql.core.PGStream.ReceiveChar(PGStream.java:282)
at
org.postgresql.core.v3.QueryExecutorImpl.processResults(QueryExecutorImpl.java:1741)
at
org.postgresql.core.v3.QueryExecutorImpl.execute(QueryExecutorImpl.java:255)
- locked \<0x00000000e4cdbed0\> (a
org.postgresql.core.v3.QueryExecutorImpl)
at
org.postgresql.jdbc2.AbstractJdbc2Statement.execute(AbstractJdbc2Statement.java:561)
at
org.postgresql.jdbc2.AbstractJdbc2Statement.executeWithFlags(AbstractJdbc2Statement.java:405)
at
org.postgresql.jdbc2.AbstractJdbc2Statement.execute(AbstractJdbc2Statement.java:397)
at
com.zaxxer.hikari.pool.ProxyStatement.execute(ProxyStatement.java:95)
at
com.zaxxer.hikari.pool.HikariProxyStatement.execute(HikariProxyStatement.java)
at
com.freedomoss.crowdcontrol.webharvest.plugin.datastore.service.DatabaseDataStoreService.executeSelectQuery(DatabaseDataStoreService.java:57)
at
com.freedomoss.crowdcontrol.webharvest.plugin.datastore.service.DatabaseDataStoreService.executeSelectQuery(DatabaseDataStoreService.java:46)
at
com.freedomoss.crowdcontrol.webharvest.plugin.datastore.DataStorePlugin.executeSelectQuery(DataStorePlugin.java:92)
at
com.freedomoss.crowdcontrol.webharvest.plugin.datastore.DataStorePlugin.executeQuery(DataStorePlugin.java:75)
at
com.freedomoss.crowdcontrol.webharvest.plugin.datastore.DataStorePlugin.executePlugin(DataStorePlugin.java:63)
at
org.webharvest.runtime.processors.WebHarvestPlugin.execute(WebHarvestPlugin.java:125)
at
org.webharvest.runtime.processors.BaseProcessor.run(BaseProcessor.java:127)
at org.webharvest.runtime.Scraper.execute(Scraper.java:169)
at org.webharvest.runtime.Scraper.execute(Scraper.java:182)
at
com.freedomoss.crowdcontrol.webharvest.executor.LocalWebharvestTaskExecutor.executeWebHarvestTask(LocalWebharvestTaskExecutor.java:187)
at
com.freedomoss.crowdcontrol.webharvest.executor.LocalWebharvestTaskExecutor.executeWebHarvestTask(LocalWebharvestTaskExecutor.java:97)
at
com.workfusion.service.machine.BotRecordExecutionService.process(BotRecordExecutionService.java:171)
at
com.workfusion.service.machine.BotRecordExecutionService.process(BotRecordExecutionService.java:142)
at
com.workfusion.service.machine.BotRecordExecutionService.lambda$3(BotRecordExecutionService.java:113)
at
com.workfusion.service.machine.BotRecordExecutionService$$Lambda$428/544535371.run(Unknown
Source)
at
com.workfusion.utils.thread.ThreadMonitoringUtils.executeWithAllocatedMemoryCallback(ThreadMonitoringUtils.java:17)
at
com.workfusion.service.machine.BotRecordExecutionService.processSubmissionWithAllocationLogger(BotRecordExecutionService.java:113)
at
com.workfusion.service.machine.BotRecordExecutionService.lambda$0(BotRecordExecutionService.java:97)
at
com.workfusion.service.machine.BotRecordExecutionService$$Lambda$426/1429204113.run(Unknown
Source)
at
com.workfusion.utils.thread.NamedThreadTemplate.executeWithNamedThread(NamedThreadTemplate.java:10)
at
com.workfusion.service.machine.BotRecordExecutionService.processRecord(BotRecordExecutionService.java:97)
at
com.workfusion.service.machine.thread.RecordProcessThread.run(RecordProcessThread.java:28)
at
java.util.concurrent.ThreadPoolExecutor.runWorker(ThreadPoolExecutor.java:1149)
at
java.util.concurrent.ThreadPoolExecutor$Worker.run(ThreadPoolExecutor.java:624)
at java.lang.Thread.run(Thread.java:748)
The stack trace shows that the Data Store plugin is being executed:
at com.freedomoss.crowdcontrol.webharvest.plugin.datastore.DataStorePlugin.executePlugin(DataStorePlugin.java:63)at org.webharvest.runtime.processors.WebHarvestPlugin.execute(WebHarvestPlugin.java:125)at org.webharvest.runtime.processors.BaseProcessor.run(BaseProcessor.java:127)
Also, it is stuck in java.net.SocketInputStream.socketRead. This signifies that activity is performed on the database side.
Identify UI and REST calls
You can identify UI and REST requests by the http-nio- prefix in the thread name.
Stuck BP list page
"http-nio-8080-exec-10" \#346 daemon prio=5 os\_prio=0
tid=0x000000001c58c000 nid=0x2f74 runnable \[0x0000000049b08000\]
java.lang.Thread.State: RUNNABLE
at [java.net](http://java.net).SocketInputStream.socketRead0(Native
Method)
at
[java.net](http://java.net).SocketInputStream.socketRead(SocketInputStream.java:116)
at
[java.net](http://java.net).SocketInputStream.read(SocketInputStream.java:171)
at
[java.net](http://java.net).SocketInputStream.read(SocketInputStream.java:141)
at
com.mysql.jdbc.util.ReadAheadInputStream.fill(ReadAheadInputStream.java:101)
at
com.mysql.jdbc.util.ReadAheadInputStream.readFromUnderlyingStreamIfNecessary(ReadAheadInputStream.java:144)
at
com.mysql.jdbc.util.ReadAheadInputStream.read(ReadAheadInputStream.java:174)
- locked \<0x00000000aba53030\> (a
com.mysql.jdbc.util.ReadAheadInputStream)
at com.mysql.jdbc.MysqlIO.readFully(MysqlIO.java:3008)
at com.mysql.jdbc.MysqlIO.reuseAndReadPacket(MysqlIO.java:3469)
at com.mysql.jdbc.MysqlIO.reuseAndReadPacket(MysqlIO.java:3459)
at com.mysql.jdbc.MysqlIO.checkErrorPacket(MysqlIO.java:3900)
at com.mysql.jdbc.MysqlIO.sendCommand(MysqlIO.java:2527)
at
com.mysql.jdbc.ServerPreparedStatement.serverExecute(ServerPreparedStatement.java:1281)
- locked \<0x00000000b6cd62b8\> (a com.mysql.jdbc.JDBC4Connection)
at
com.mysql.jdbc.ServerPreparedStatement.executeInternal(ServerPreparedStatement.java:782)
- locked \<0x00000000b6cd62b8\> (a com.mysql.jdbc.JDBC4Connection)
at
com.mysql.jdbc.PreparedStatement.executeQuery(PreparedStatement.java:1966)
- locked \<0x00000000b6cd62b8\> (a com.mysql.jdbc.JDBC4Connection)
at
com.zaxxer.hikari.pool.ProxyPreparedStatement.executeQuery(ProxyPreparedStatement.java:52)
at
com.zaxxer.hikari.pool.HikariProxyPreparedStatement.executeQuery(HikariProxyPreparedStatement.java)
at
org.hibernate.engine.jdbc.internal.ResultSetReturnImpl.extract(ResultSetReturnImpl.java:60)
at org.hibernate.loader.Loader.getResultSet(Loader.java:2168)
at org.hibernate.loader.Loader.executeQueryStatement(Loader.java:1931)
at org.hibernate.loader.Loader.executeQueryStatement(Loader.java:1893)
at org.hibernate.loader.Loader.doQuery(Loader.java:938)
at
org.hibernate.loader.Loader.doQueryAndInitializeNonLazyCollections(Loader.java:341)
at org.hibernate.loader.Loader.doList(Loader.java:2692)
at org.hibernate.loader.Loader.doList(Loader.java:2675)
at org.hibernate.loader.Loader.listIgnoreQueryCache(Loader.java:2507)
at org.hibernate.loader.Loader.list(Loader.java:2502)
at
org.hibernate.loader.criteria.CriteriaLoader.list(CriteriaLoader.java:109)
at org.hibernate.internal.SessionImpl.list(SessionImpl.java:1898)
at org.hibernate.internal.CriteriaImpl.list(CriteriaImpl.java:370)
at
org.hibernate.internal.CriteriaImpl.uniqueResult(CriteriaImpl.java:392)
at
com.freedomoss.workfusion.repository.run.impl.RunRepository.isHasProcessingIssuesInChild(RunRepository.java:1014)
at
com.freedomoss.requester.service.run.impl.RunService.isHasProcessingIssuesInChild(RunService.java:644)
at
com.freedomoss.requester.service.run.impl.RunService$$FastClassBySpringCGLIB$$2699e362.invoke(\<generated\>)
at
org.springframework.cglib.proxy.MethodProxy.invoke(MethodProxy.java:204)
at
org.springframework.aop.framework.CglibAopProxy$CglibMethodInvocation.invokeJoinpoint(CglibAopProxy.java:738)
at
org.springframework.aop.framework.ReflectiveMethodInvocation.proceed(ReflectiveMethodInvocation.java:157)
at
org.springframework.transaction.interceptor.TransactionInterceptor$1.proceedWithInvocation(TransactionInterceptor.java:99)
at
org.springframework.transaction.interceptor.TransactionAspectSupport.invokeWithinTransaction(TransactionAspectSupport.java:282)
at
org.springframework.transaction.interceptor.TransactionInterceptor.invoke(TransactionInterceptor.java:96)
at
org.springframework.aop.framework.ReflectiveMethodInvocation.proceed(ReflectiveMethodInvocation.java:179)
at
org.springframework.aop.framework.CglibAopProxy$DynamicAdvisedInterceptor.intercept(CglibAopProxy.java:673)
at
com.freedomoss.requester.service.run.impl.RunService$$EnhancerBySpringCGLIB$$8890d0d.isHasProcessingIssuesInChild(\<generated\>)
at
com.freedomoss.crowdcontrol.controller.task.TaskListController.isReprocessRun(TaskListController.java:458)
at sun.reflect.GeneratedMethodAccessor1112.invoke(Unknown Source)
at
sun.reflect.DelegatingMethodAccessorImpl.invoke(DelegatingMethodAccessorImpl.java:43)
at java.lang.reflect.Method.invoke(Method.java:498)
at
org.jboss.el.util.ReflectionUtil.invokeMethod(ReflectionUtil.java:329)
at
org.jboss.el.util.ReflectionUtil.invokeMethod(ReflectionUtil.java:274)
at
org.jboss.el.parser.AstMethodSuffix.getValue(AstMethodSuffix.java:59)
at org.jboss.el.parser.AstValue.getValue(AstValue.java:67)
at
org.jboss.el.ValueExpressionImpl.getValue(ValueExpressionImpl.java:186)
at
com.sun.faces.facelets.el.TagValueExpression.getValue(TagValueExpression.java:109)
at
javax.faces.component.ComponentStateHelper.eval(ComponentStateHelper.java:193)
at
javax.faces.component.UIComponentBase.isRendered(UIComponentBase.java:421)
at
javax.faces.component.UIComponentBase.processDecodes(UIComponentBase.java:1037)
JSF classes in the stack trace (javax.faces.component.UIComponentBase) hint it is a UI request. The thread is stuck in java.net.SocketInputStream.socketRead so the cause of slowness is on the MySQL side.
View background system threads
Consider the following background system threads and their meaning:
review-hit-<hit_id>: processing of human worker answersbot-results-run-<run_id>-hit-<hit_id>: processing of bot worker answersget-reviewable-hits-prod/get-reviewable-hits-sandbox: retrieval of human worker answers from the crowdget-reviewable-hits-paused-prod/get-reviewable-hits-paused-sandbox: retrieval of human worker answers from the crowd for paused runsprocess-refreshable-hits-sandbox/process-refreshable-hits-prodredistribution-production/redistribution-sandbox: redistribution of Manual Tasks in multi-crowd setupsbp-[<instance_uuid>]: Business Process lifecycle taskscreateHumanTasks-<stream_id>: submission of Manual Tasks to crowdscompleteMachineRun-<run_id>: completion or transition of bot step recordsstartMachineHits-<run_id>: start of bot step record executionrunStatsUpdate-<run_id>: periodic update of the BP step statsprocessRunStreamEvent-<run_uuid>: completion or transition of the manual step records
Most scheduled activities are executed inside the WorkFusion_Worker-* threads. Therefore, you should guess the executed task based on the stack trace.
Identify BP by thread name
In the thread dump bot execution, you can identify threads via the machine-run-<run_id> prefix. To identify the BP that started bot execution, run the following query. Before execution, replace the @run_id parameter with an appropriate value from the thread name.
set @run_id = 4;

select c.title as bp_title, r.title as step_title, r.rootRunUUID as bp_instance_uuid
from Run r
join CampaignMap cm on r.campaignMap_id = cm.id
join Campaign c on c.id = cm.parent
where r.id = @run_id;
- The
bp_titlecolumn contains the BP name. - The
step_titlecolumn contains the BP step name. - The
bp_instance_uuidcolumn contains the BP instance UUID. You can put it into the browser URL like this:business-process/edit/<UUID>.
Get Thread Dump
Find process pid
To find the process pid, you can use the standard ps utility.
For example, to find the tomcat process, you can use the following command:
ps aux | grep java | grep tomcat
As a result, it prints the process id (pid), process owner, and other process details.
Make sure current user is process owner
For the jstack operation to succeed, run it under the user who owns the process you are checking.
To check the logged-in user, run the below command:
whoami
Make sure JAVA_HOME is defined
To print the current JAVA_HOME value, run the following command:
echo $JAVA_HOME
To set the environment variable, use the command below. The actual path to the Java installation folder can differ from the one specified below, depending on the IA Cloud version or the folder where the software was installed to. The below example illustrates the most common case:
JAVA_HOME=/opt/workfusion/lib/jdk1.8.0_101/
Take jstack snapshots
As jstack takes snapshot of the immediate state, it is a good idea to take a few snapshots to see the things in dynamics. The general recommendation is three snapshots at the 15 second interval.
Replace process_pid with the pid collected on the first step.
$JAVA_HOME/bin/jstack ${process_pid} > jstack-`date -u +"%Y-%m-%dT%H-%M-%SZ"`.txt
You can put the command into the loop to create multiple dumps, for instance:
Take multiple dumps (take-dumps.sh)
#!/bin/sh
for ((n=0;n<$2;n++))
do
  echo "Taking dump `date '+%Y-%m-%d %H:%M:%SZ'`"
  $JAVA_HOME/bin/jstack $1 > jstack-`date -u +'%Y-%m-%dT%H-%M-%SZ'`.txt
  sleep 1
done
Example:
bash-4.2$ ./take-dumps.sh \<jvm\_pid\> 5
Taking dump 2018-05-28 19:03:17Z
Taking dump 2018-05-28 19:03:18Z
Taking dump 2018-05-28 19:03:19Z
Taking dump 2018-05-28 19:03:20Z
Taking dump 2018-05-28 19:03:22Z