
Analyze Heap Dump
Heap Dump is a snapshot of the Java Virtual Machine (JVM) memory. It is crucial in case the following symptoms are observed:
- High RAM consumption by Control Tower (Tomcat process)
- Ineffective garbage collection (GC) cycles (
gc.log) or potential suspect for memory leak
How to get Heap Dump
To get Heap Dump, run the command below with the process pid. For instructions to get the pid, read the Analyze Thread Dump article.
\[root@local-test-migrations \~\]\# ps aux \| grep java
tomcat 20647 16.4 45.2 8802672 3626400 ? Sl May22 226:15
/opt/java/bin/java
-Djava.util.logging.config.file=/opt/tomcat/conf/logging.properties
-Djava.util.logging.manager=org.apache.juli.ClassLoaderLogManager -Xms2G
-Xmx4G -Djava.awt.headless=true -Dfile.encoding=UTF-8 -server
-XX:+DisableExplicitGC -XX:+UseG1GC -Xloggc://opt/tomcat/logs/gc.log
-XX:-PrintGCDetails -verbose:gc -XX:+PrintGCDateStamps
-Duser.timezone=UTC -Dcom.sun.management.jmxremote
-Dorg.apache.el.parser.SKIP\_IDENTIFIER\_CHECK=true
-Dgroovy.use.classvalue=true -Dgroovy.target.indy=true
-Dspring.profiles.active=test,soapEnable,default
-XX:+HeapDumpOnOutOfMemoryError -Xdebug
-Xrunjdwp:transport=dt\_socket,server=y,suspend=n,address=8000
-Djdk.tls.ephemeralDHKeySize=2048
-Djava.protocol.handler.pkgs=org.apache.catalina.webresources -classpath
/opt/tomcat/bin/bootstrap.[jar:/opt/tomcat/bin/tomcat-juli.jar](http://jar/opt/tomcat/bin/tomcat-juli.jar)
-Dcatalina.base=/opt/tomcat -Dcatalina.home=/opt/tomcat
-[Djava.io](http://Djava.io).tmpdir=/opt/tomcat/temp
org.apache.catalina.startup.Bootstrap start
root 27270 0.0 0.0 112644 960 pts/0 S+ 17:34 0:00 grep --color=auto java
Syntax: jmap -dump:live,format=b,file=\<file\_name\> \<pid\>
Example: jmap -dump:format=b,file=heap\_dump.hprof 4988
Mind that you must execute the command under the same user under which JVM was started, for example, tomcat for the ps output above:
jmap
su tomcat -c "/opt/java/bin/jmap -dump:live,format=b,file=/tmp/dump-`date +\%m-\%d-\%H`.hprof 20647"
Dumping heap to /tmp/dump-05-23-17.hprof ...
Heap dump file created
important
Heap Dump generation can take up to few hours, depending on the heap size.
For Heap Dump analysis, it is recommended to use Eclipse Memory Analyzer.
For large heap dumps, you may need to increase the maximum heap size allowed for Eclipse Memory Analyzer (MAT)—the Xmx parameter in the MemoryAnalyzer.ini file.
Also, large heap dumps take a lot of time to open since, at that time, MAT builds indices. You can build indices using the Batch or Bash ParseHeapDump script. Run the file with the single parameter = heap\_dump\_file\_name. MAT will build indices and, next time, will use them to speed up any Heap Dump analysis.
There are three reports you can generate from the command line:
ParseHeapDump.bat HeapDumpSample.hprof org.eclipse.mat.api:suspectsParseHeapDump.bat HeapDumpSample.hprof org.eclipse.mat.api:overviewParseHeapDump.bat HeapDumpSample.hprof org.eclipse.mat.api:top\_components
These commands generate an HTML report into a zip file, and you can use the zip file for further analysis. The reports are the same as what you see in the user interface.
What to look for in Heap Dump
note
The following examples and screenshots are made in MAT 1.7.
First, look at Dominator Tree and find there the object that took too much memory.
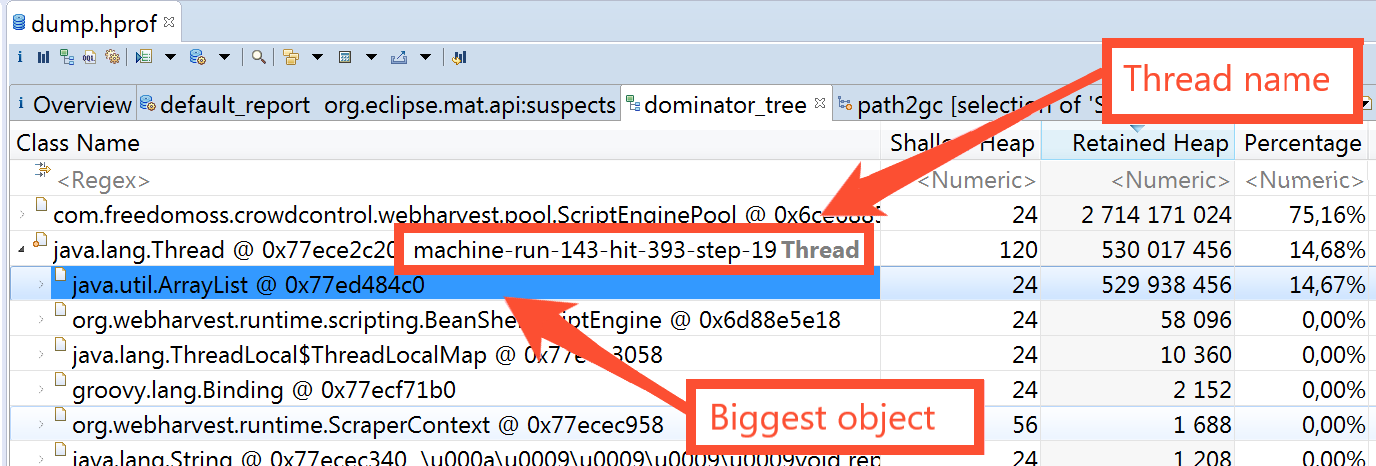
In this way, you can see the problematic thread (run, hit, step) and the object that takes memory. You can then right-click the thread and select Java Basics > Thread details to see the stack trace. This can help to understand where you are in the code.
Also, you can select ArrayList and then from the context menu—List Objects\With incoming references.
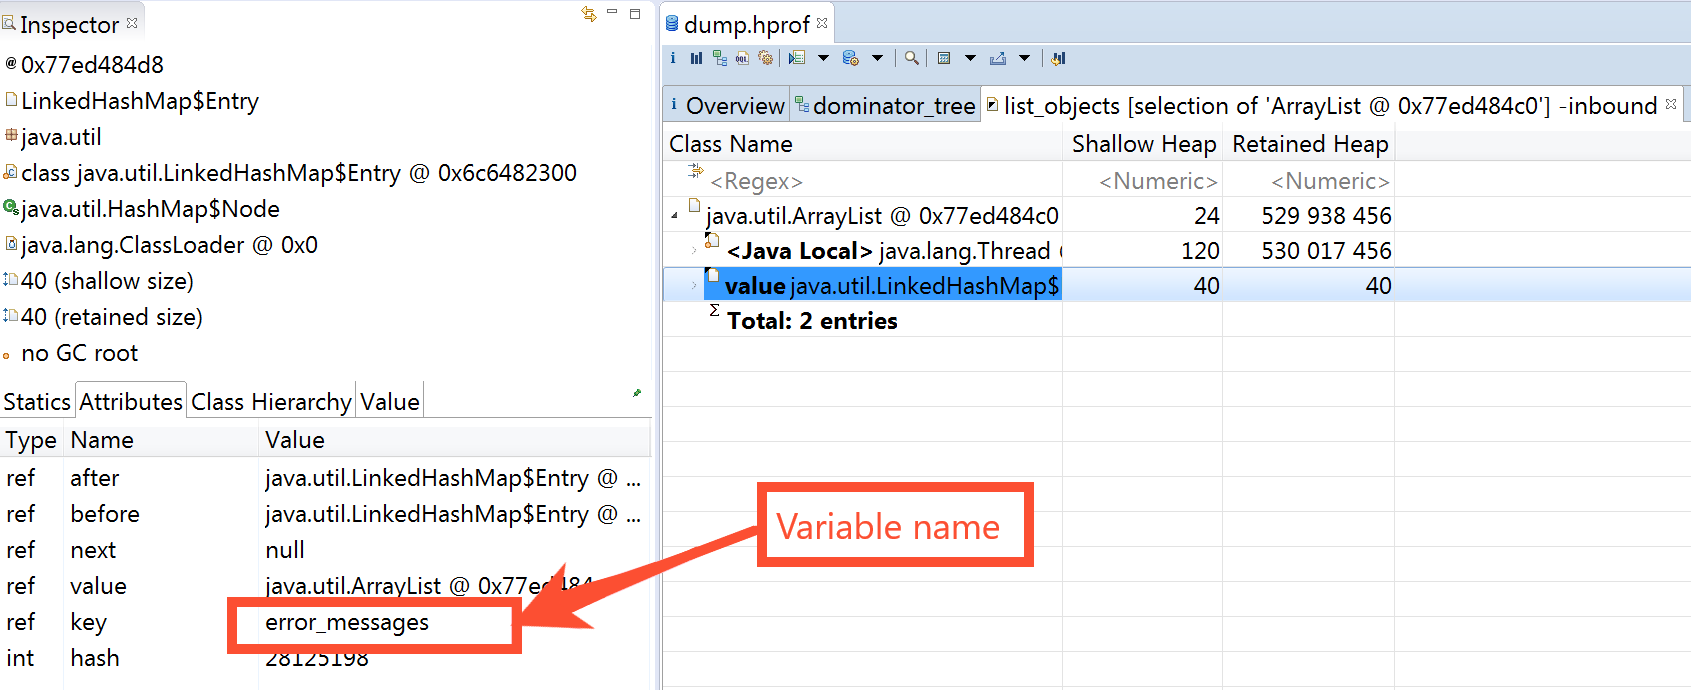
Now, you can see the variable name.
To find out Business Process (BP) and step details, run the following query against the MySQL mturk database. The example below illustrates how you can find the BP responsible for the execution of the machine-run-143-hit-393-step-19 thread.
set @hit_id = 393;

select c.title as process_title, r.title as step_title, r.rootRunUUID
as instance_uuid
from Run r
join Campaign c on [c.id](http://c.id) = r.campaign_id
join AwsHit ah on ah.run_id = [r.id](http://r.id)
where ah.id = @hit_id
process_title | step_title | instance_uuid |
|---|---|---|
Automation Process: CZPffQnpbn | (Generic)Automation Settings | 0579c068-bc1d-41c3-8cb1-507e052b5aa5 |
So, you can find the BP from UI using the following link: \<server\>/workfusion/secure/business-process/edit/0579c068-bc1d-41c3-8cb1-507e052b5aa5.
The two most frequent causes of memory issues are as follows:
Selection from a large Data Store without filters. You can identify the issue via the
machine-run-\*thread name andDataStorePlugin\*classes in the stack trace. For example, ifmachine-run-595-hit-35412-step-1751processing caused the execution ofDataStorePlugin, you can view the query as a local variable on the thread_overview tab.Page rendering with a lot of data, for example, a process list. You can identify it via the
http-nio-8080-\*thread in the dump thread overview.