
RPA performance Excel report
The page describes a workaround for when BI server is not installed. Starting from version 9.0, BI server is a must.
Recommended approach
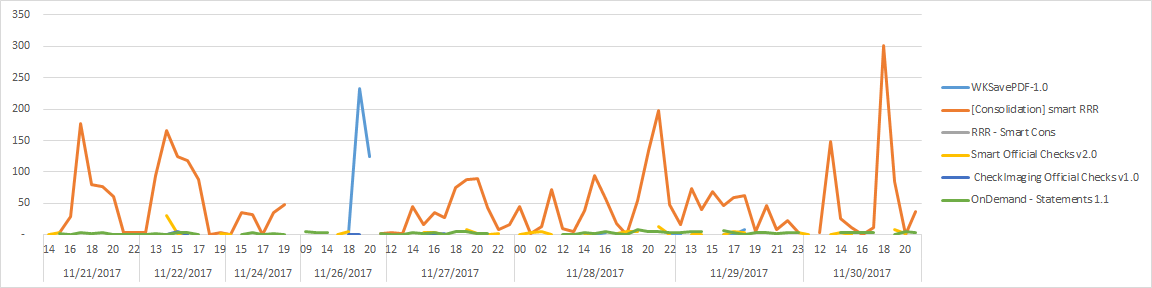
The report helps to analyze RPA performance. Report contains chars for the following data:
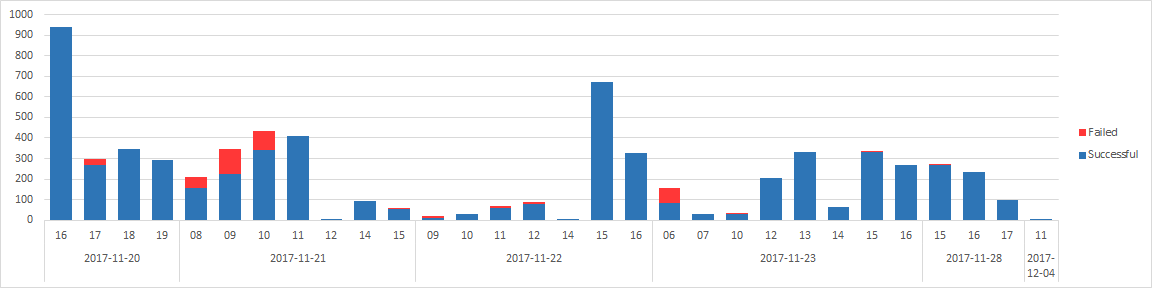
Load on RPA Manager: The number of sessions per hour.
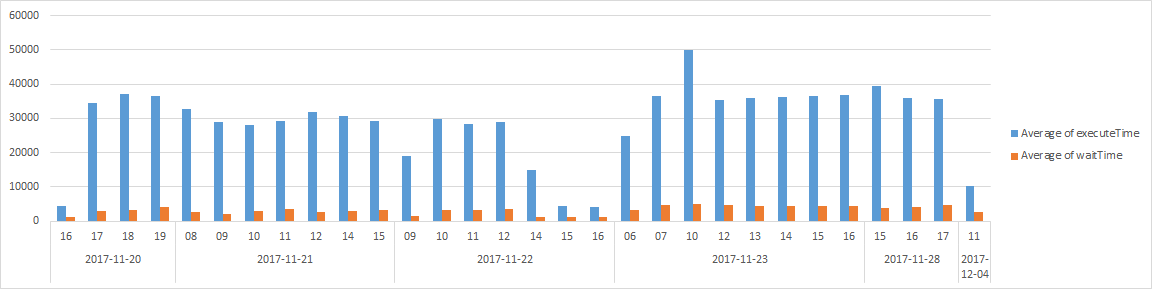
Speed of RPA session creation: Average wait and execute time of session, ms.
Total wait time spent on RPA steps, ms.
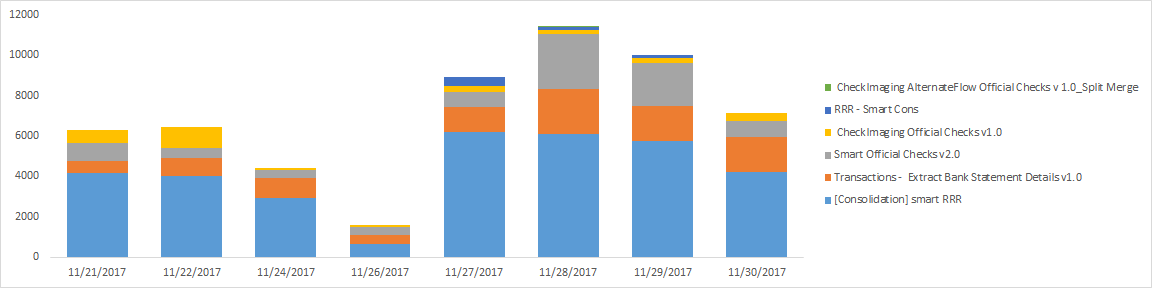
Total execute time spent on RPA steps, ms.
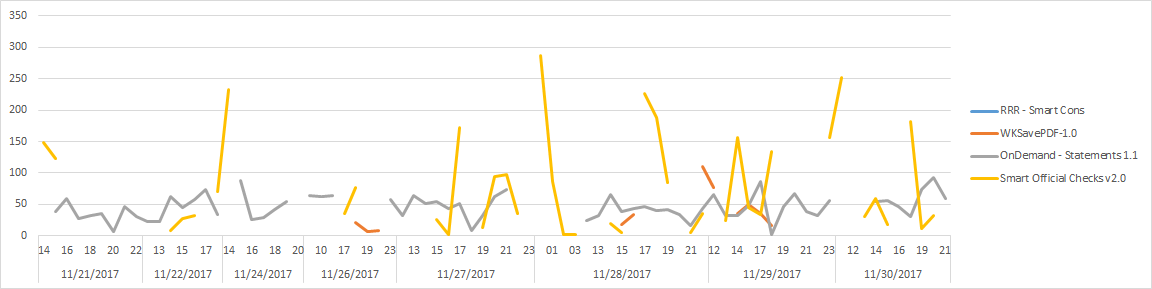
Historic load on RPA steps: Average number of sessions per hour.
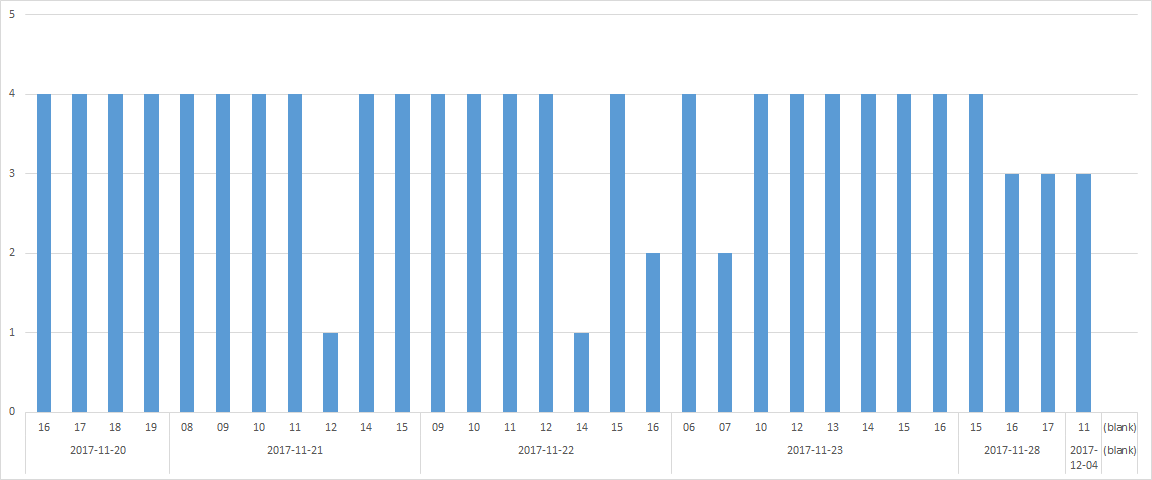
RPA nodes engagement report: Number of nodes.
Available filters:
- Date
- Hour
- Hub
- Node
- Business Process title
- Step title
Generate report
Generate CSV file
Use a command from here to fetch required data from Mongo DB.
To export MongoDB Node metrics for performance analysis:
Connect to MongoDB.
Execute the following command. Replace the
host/port/username/password/outattributes with actual values.mongoexport --host local-qa.ccs .com --port 27016 --username user --password "pass" --db selenograph --collection 'nodes-metrics' --type=csv --out /opt/workfusion/node-metrics.csv --fields nodeId,hubId,hubSgHash,waitTime,executeTime,totalTime,failed,date,name,sessionId,type,blockImages,closeOnCompletion,startInPrivate,hostName,contextPath,runName,runUuid,taskName
The same query with the date-from filter:
mongoexport --host local2-qa15.crowdcomputingsystems.com --port 27016 --query '{"date" : {"$gte" : { "$date" : "2018-12-03T01:00:00.000Z"} }}' --db selenograph --collection nodes-metrics --type=csv --out D:\node-metrics.csv --fields nodeId,hubId,hubSgHash,waitTime,executeTime,totalTime,failed,date,name,sessionId,type,blockImages,closeOnCompletion,startInPrivate,hostName,contextPath,runName,runUuid,taskName
Download Excel report template
Download the following Excel document: RPA Performance Excel Report template.xlsx
Populate Excel file with generated data
Execute the following steps in the downloaded template:
- Click Enable content when you open the file. This warning is generated because this template uses tsv files and data sources:
- For each sheet from the first to the last one follow comments inside file (for convenience - all instructions are duplicated inside the template).
Alternative approach
The report helps to analyze RPA performance. Report contains chars for the next data:
- Historic load on RPA steps
- Total time spent on RPA steps
- Average duration of RPA steps
- Speed of RPA session creation
- Load on RPA manager
Generate report
Collect data
Install Gradle if needed. Use the
gradle -vcommand in the terminal that should return details.Download the
build.gradlescript for collecting the required data.Copy
grid-router.logandselenium.logto the folder with the downloaded Gradle script. Do not change logs file nameExecute the next commands in the folder with the script and logs:
gradle grid > result-grid.txt
gradle selenium > result-selenium.txt
Populate Excel template
- Download report excel template file: RPA Performance Excel Report template v0.xlsx
- Update resources in Excel tabs from output generated by the script:
- The grid tab from
grid.csv. - The activeSessions tab from
activeSessions.csv. - The BP and steps tab from the
BP_name.csvfile. For now, the script generates CSV files for each BP. Thus, join them into one and insert content to this step.
- The grid tab from