
MySQL slow query log
Problem
For details on the slow query log, refer to the MySQL documentation.
Sometimes, slow_query_log, log-error, general_log cannot be found.
Solution
Check the my.cnf file. It should contain the following lines inside the [mysqld] block.
log-error=/path_to_folder/mysqld.log
slow_query_log=1
slow_query_log_file=/path_to_folder/mysql-slow.log
long_query_time=1
general_log = 1
general_log_file = /path_to_folder/mysql-general.log
If lines are absent, add them and restart the MySQL service. This can help to stabilize the database work.
Check the Innodb status and deadlocks:
show engine innodb status
For details, refer to the article.
Check if the wfdb setup is correct. Ask to perform the following procedure:
Execute the following command:
show variables;Provide the results from the previous step.
- Set the
innodb_buffer_pool_sizevariable. Its value must be at least 70% of the available memory for MySQL (in versions later than 8.5 can be less).
Sometimes, the connection to the database server can be slow. It can be detected with profiling:
Connect to the MySQL database from the machine where the WorkFusion web application started:
mysql -u{username} -p -h{remote server ip} {DB name}Enable profiling by executing there:
SET profiling = 1;Execute a heavy query, such as:
select * from AwsHit;Execute:
SHOW PROFILES;As a result of Step 4, you will see a table as shown below:
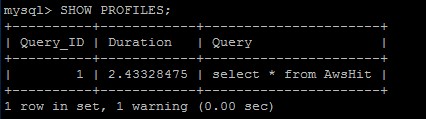
From the table, select the profile of your query from Step 3 using its ID:
SHOW PROFILE FOR QUERY 1;Analyze the results of Step 5.
Sometimes, you should check the size of indexes on all schemas:
select table_schema                              as "DB Name"
     , sum(Round(index_length / 1024 / 1024, 1)) as "Index Size in MB"
  from information_schema.tables
 group by table_schema
 order BY index_length
;
Business Process performance
These queries can help you to analyze the processing time for specific steps.
set @rootRun = 'a962ca7f-0edc-4943-9f9e-138b6bff1e57';
-- top 20 records sorted by processing time with step title
select r.title
     , wal.spendTime
  from Run r
  join WorkerActivityLog wal on wal.run_id = r.id
 where r.rootRunUUID = @rootRun
 order by wal.spendTime desc
 limit 20
;

-- top 10 steps sorted by avg record processing time
select r.title
     , avg(wal.spendTime)
     , max(wal.spendTime)
     , count(wal.spendTime)
  from Run r
  join WorkerActivityLog wal on wal.run_id = r.id
 where r.rootRunUUID =@rootRun
 group by r.id
 order by avg(wal.spendTime) desc
 limit 10
;
If a slow Business Process step tries to open URLs, it's recommended to check the load time of each URL by opening it manually.