Scheduler monitoring
To access the dashboard, navigate to Analytics > Dashboards and click Scheduler monitoring on the dashboard list.
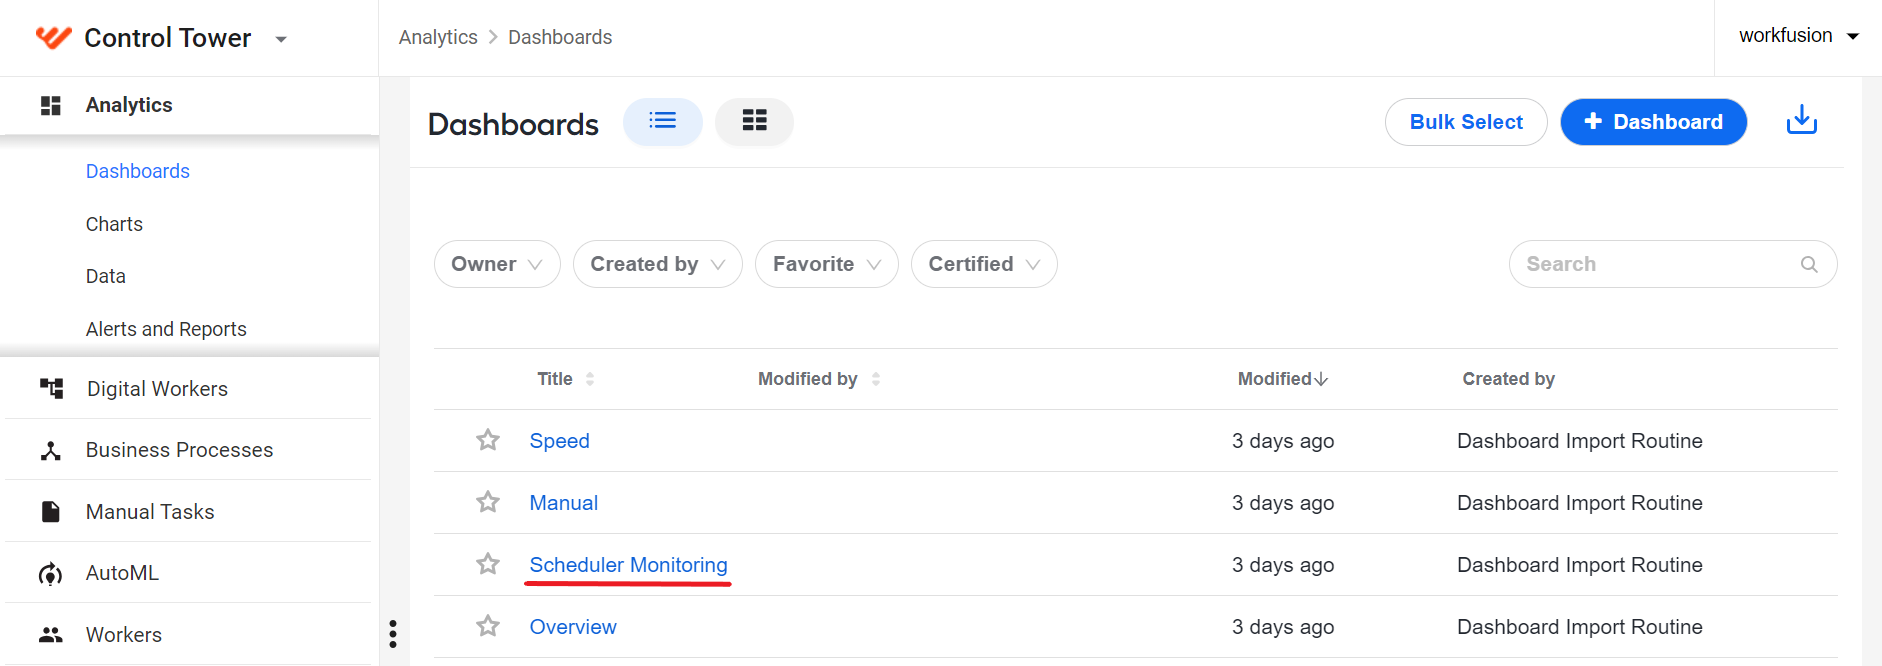
The Scheduler monitoring dashboard enables you to monitor the information described in the sections below.
ETL schedules
The ETL schedules tab shows the information on all ETL procedure runs across the dm schema tables. This means you can get data on any schedules configured for ETL Scheduler to aggregate analytics data.
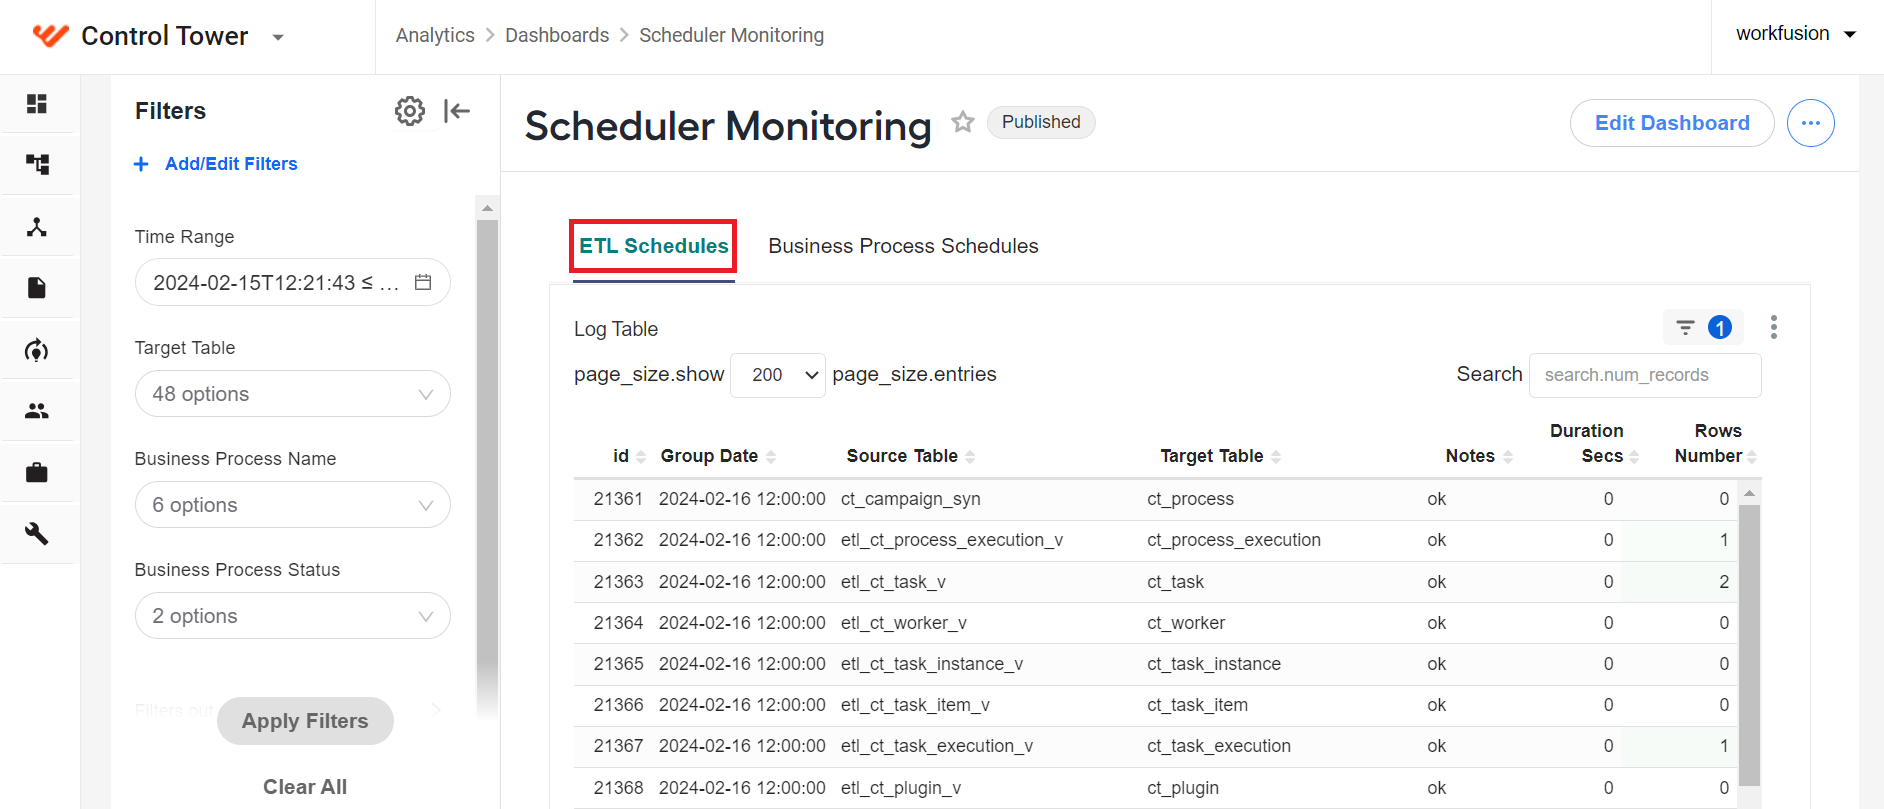
If the monitored schedules are executed successfully, the Notes column has ok indications. Should any issues happen, the same column contains an error indication for the failed ETL Scheduler run.
You can filter the metrics on the tab by the following criteria:
Additionaly, you can create custom filters to match your specific business needs. For instructions on applying and creating filters, read Learn about analytics in WorkFusion | Filter dashboard data.
Business Process Schedules
On the Business Process Schedules tab, you can watch any schedules configured to run Business Processes in Control Tower.
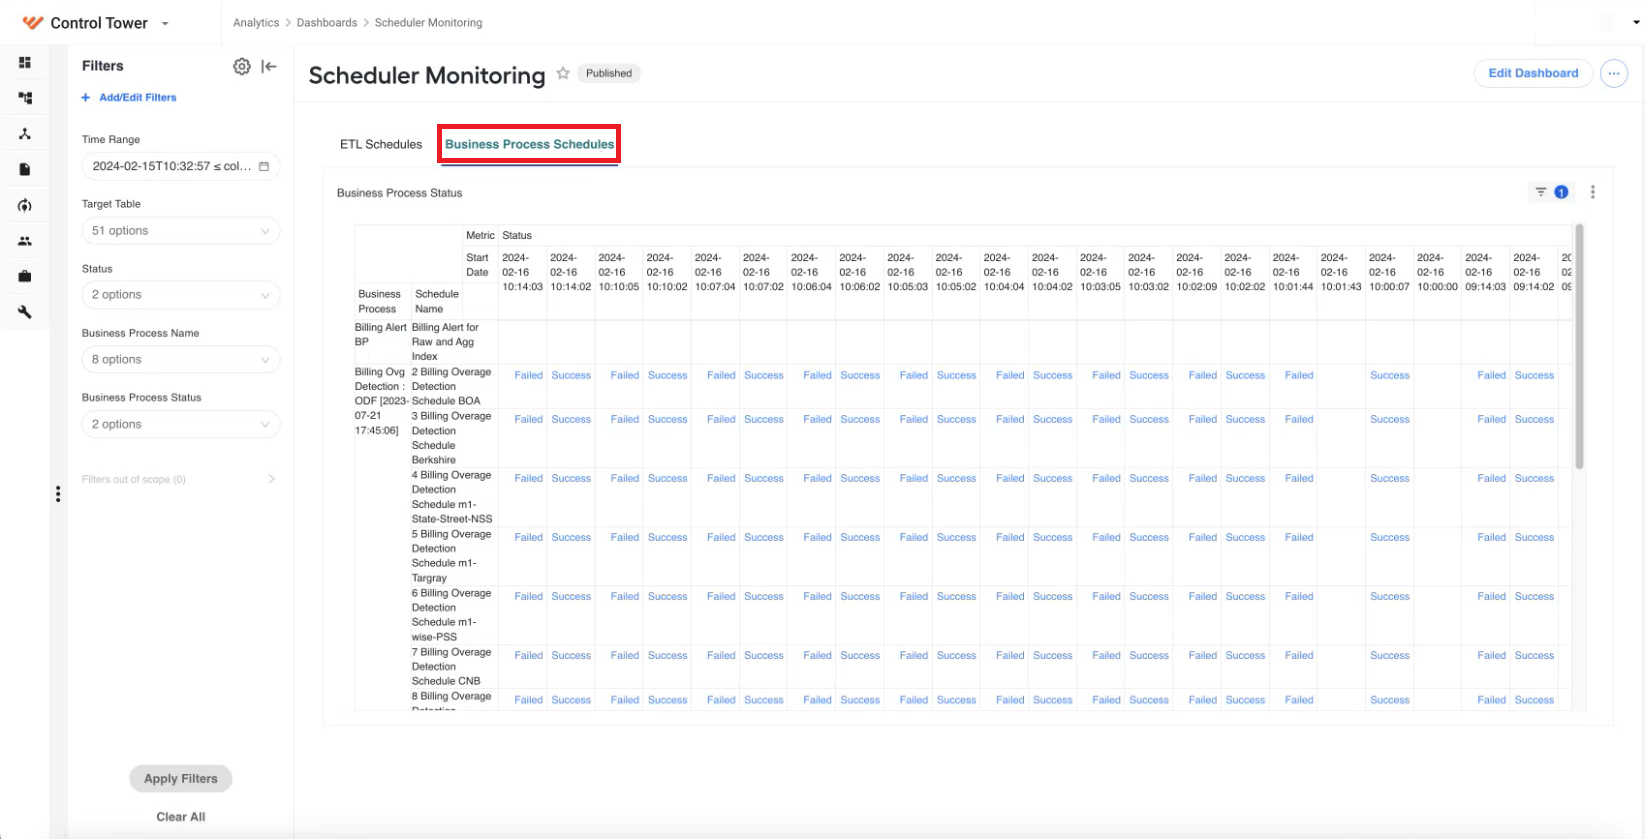
You can filter the metrics on the tab by the following criteria:
Additionaly, you can create custom filters to match your specific business needs. For instructions on applying and creating filters, read Learn about analytics in WorkFusion | Filter dashboard data.