Issues related to failure while launching BP run
Scheduler failure
The Scheduler fails to trigger a Business Process (BP) run. To investigate, act as follows:
Check Scheduler configuration
Check if the Scheduler configuration is correct starting from the Scheduler's current state.
The schedule can have three possible states:
- RUNNING
- PAUSED
- STOPPED
Go to Control Tower > Advanced > Schedules and find the schedule you are looking for:
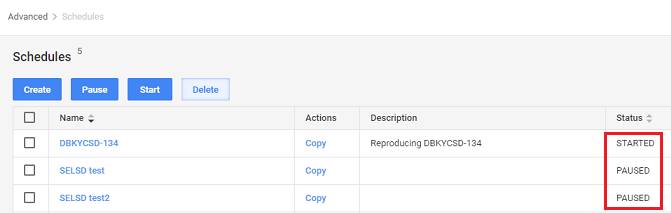
When the Scheduler is PAUSED or STOPPED, it won't start the BP. Consider if the investigation can wait until the next scheduled launch.
warningBP capacity is supposed to be enough to handle certain workload. Pausing the Scheduler and holding the BP against processing can be exhausting for subsequent runs and the application performance at the same time.
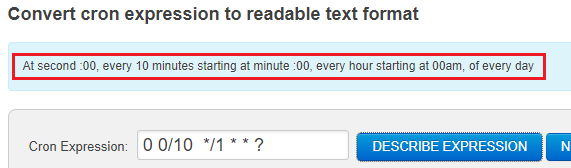
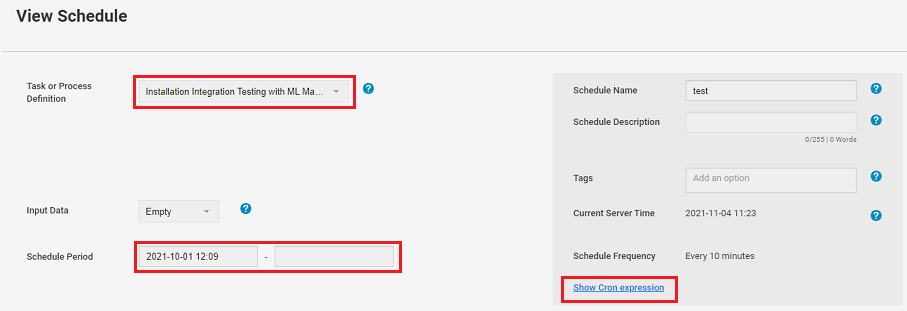
Verify the schedule frequency. Review Schedule Period and check dates. There can be a future date or expired launch dates. Review and check cron expressions as well:

To validate or adjust cron expressions, use, for example, Cron Expression Generator & Explainer: Quartz or another free online cron expression tool. This way, you can get immediate cron expression verbal explanation to compare with the schedule authors' scheduling plan:
Verify if Process Definition is correct. An incorrect process definition often can cause issues in launching BPs from Schedulers. When several BPs are named in the same way or have the same name, that can lead to a mistake. Always create unique BP names and follow the best practices in naming conventions.
Check logs
Check Control Tower logs for exceptions at the time the Scheduler is supposed to trigger the BP. If everything is fine, it can be a lost database (DB) connection that causes issues, and you can easily find JDBC connection timeout logs.
The framework responsible for BP launch triggering is Spring, but it is Quartz under the hood. When Quartz cannot establish a DB connection, it waits silently, attempting to reconnect every fifteen seconds.
There are two internal properties responsible for data source timeout configuration:
lockTimeoutis set up to 60 seconds by default. For more details, refer to Version 10.1.2.1 Release notes.socketTimeoutEach trigger has a precise time when it fires, including this timeout. When the DB connection cannot be established for 1.5 minutes, the trigger can be skipped without any message in INFO logs. In this case, the BP is triggered only on the next schedule as specified by the cron expression.
Check the following less frequent scenarios if your issue is unlikely to be connected to JDBC connection timeouts.
Work with the OPS team to change a component log level to DEBUG and search for exceptions containing pieces of sample message templates below:
Trigger ....... misfired job ....... at: ....... . Should have fired at: .......

Trigger ....... fired job ....... at: ....... fired (by trigger .......) at: .......

Job ....... execution failed at ....... and reports: .......

Job ....... was vetoed. It was to be fired (by trigger .......) at: .......
Finding them means there are some infrastructural issues, data purge problems, data consistency issues, and so on. Therefore it is recommended to involve the OPS and Support team in your investigation.
Output
If you fail to establish the root cause, escalate the case to the Support team. Make sure to provide the following Control Tower logs:
workfusion.out.logcrowdcontrol.logcatalina.log
Otherwise, continue the investigation.
Task-start plugin failure
The task-start plugin fails to launch a BP run.
Open Kibana, go to Discover, and look for this specific log:
Failed to start run for campaignUuidor simply:
Failed to start taskWhen you find out that the log is exactly when the BP is supposed to run, the plugin probably fails.
Check
campaign-uuidspecified in the task-start plugin if it is correct. For details, refer to Bot Task plugins | task-start.Work with the OPS team to download NGINX logs and try to find and analyze the following
POSTrequests:/task/..../starttask/file
Continue your investigation when you find a response status different than 200, unlike the correct response status example below:
10.240.123.182 - - [21/Oct/2021:08:25:12 +0100] "POST /workfusion/api/v2/workfusion/task/file HTTP/1.1" 200 36 "-" "Apache-HttpClient/4.5.13 (Java/1.8.0_291)" "10.236.12.100" - ["-"] 0.000 3.354 3.354 3.354
For detailed instructions on searching specific messages in Kibana logs, refer to the article.
Output
If you fail to establish the root cause, escalate the case to the Support team. Make sure to provide the following Control Tower logs:
workfusion.out.logcrowdcontrol.logcatalina.log
Otherwise, continue the investigation.
Review also: