Analyze results
Along with the out-of-the-box operational analytics of the WorkFusion’s platform, the Adverse Media Monitoring AI Agent includes pre-built dashboards for real-time continuous monitoring of the solution by operations managers. You can dynamically filter the dashboards to visualize data from a specific Business Process run, timeframe, or parameters, such as risk category or news domain.
Adverse Media Monitoring analytics is presented with the Overview and Articles Analysis dashboards providing sophisticated views of solution effectiveness. They allow you to do the following:
- Track overall performance
- Search for improvement opportunities
- Identify and troubleshoot issues
To open the Analytics dashboards, in the Control Tower menu, click Analytics.
Overview dashboard
The Overview dashboard focuses on processing time and solution quality. It allows you to track the following metrics:
- Overall manual processing time
- Volumes of search requests
- Processing time by Business Process step
- Model accuracy visualized as a confusion matrix
- List of keywords used by the model to score and categorize each article by risk
Filtering options allow you to select individual Business Process instances, specific process runs, and search periods.
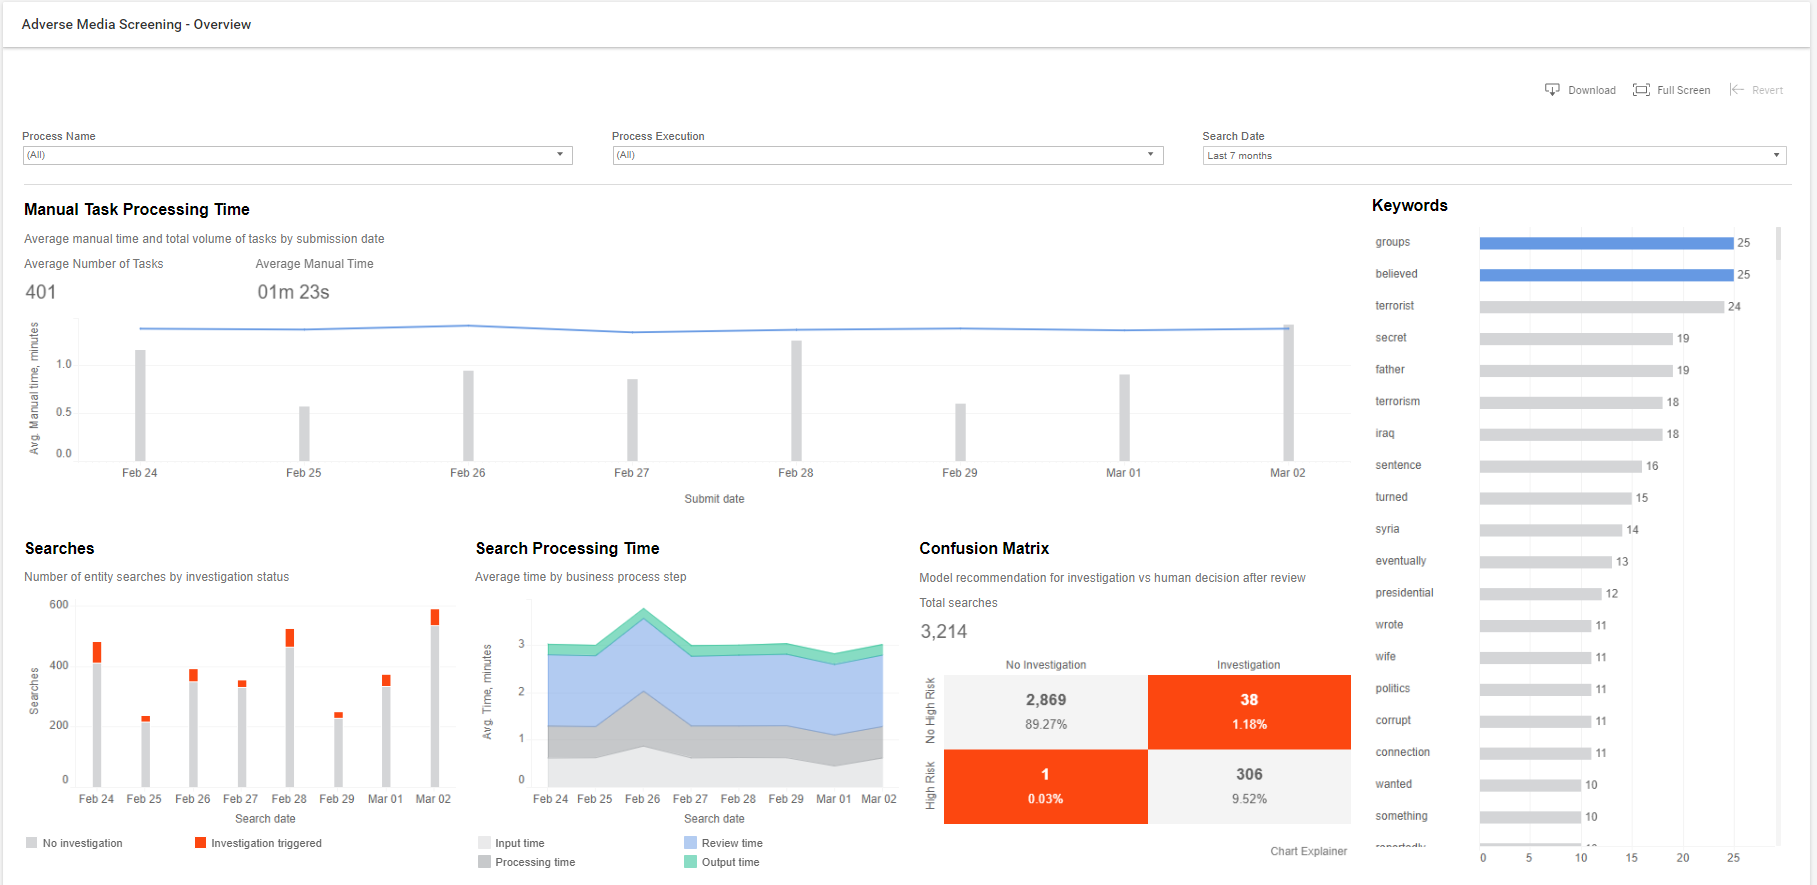
The dashboard includes the following sections:
Manual Task Processing Time
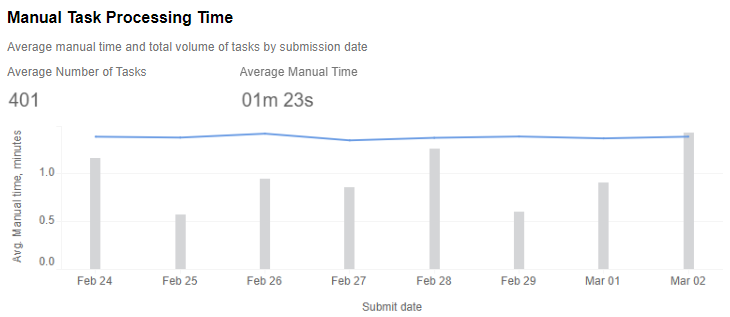
The area displays the average manual handling time per entity reviewed and the volume of tasks completed over time. Here, you can check how Average Manual Processing Time vs. Number of Tasks submitted on a specific day change over time.
It also displays the summary information on the Average Number of Tasks submitted daily and Average Manual Time for a selected period.
Example: over the last seven days, the Average Number of Tasks was equal to 401 per day with an Average Manual Time of 1 minute 23 seconds per task. You can observe stable behavior on the manual processing step with no dependencies on the volume of tasks. Hence, the team works well.
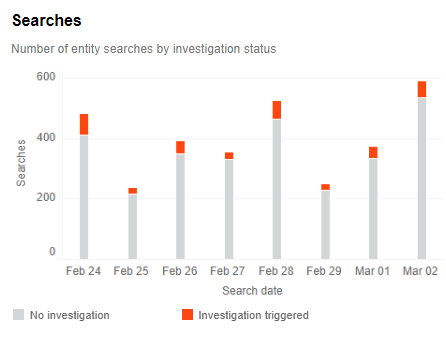
Searches
The total number of daily searches with a breakdown by the investigation status allows you to evaluate the volume and understand the trends of daily investigations and their relative volumes in all searches.
Search Processing Time
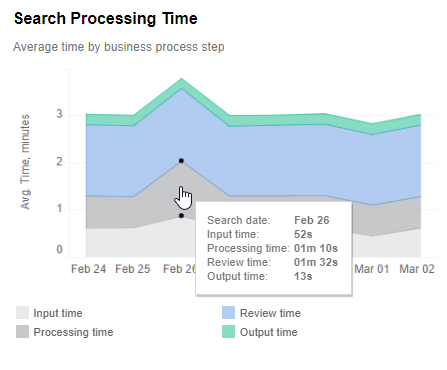
The section provides information on Average Processing Time broken down by individual steps in the Business Process and dates used to identify bottlenecks.
Here, the process step comes from the Business Process design and corresponds to the building blocks and their names. Thus, it allows you to identify issues within processing time when they happen and specific steps in the process that may require attention and further troubleshooting.
Note: cases without articles that lead to manual review steps are filtered from this view. For example: on Day 3, the times for processing steps slightly increased. This can indicate an increased number of searches or that the system was slowed down by external factors.
Confusion Matrix
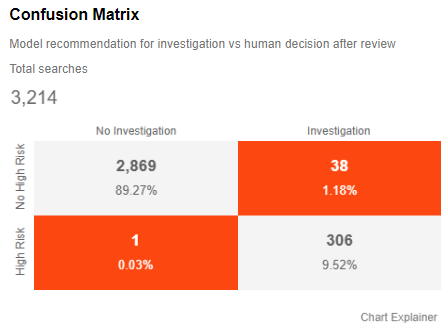
This section evaluates the solution's accuracy by comparing the model’s decisions against analysts’ decisions on whether real adverse media was found. Red boxes indicate instances in which WorkFusion’s decision differed from the analysts’ ones.
Model results are estimated based on High-Risk articles found during the search according to the logic below:
True Positive: at least one High-Risk article was found, and a human operator decides to proceed with the investigation. The model results correlate to the human decision triggering an investigation.
False Positive: at least one High-Risk article was found, but a human operator decides that no investigation is required. The model incorrectly assigns high risk, and more time is spent on review.
False Negative: no High-Risk articles are found, but a human decision is to proceed with an investigation. The model did not identify any risk that leads to missing risk.
True Negative: no High-Risk articles are found, and a human decides that no investigation is required. The model results correlate to the human decision with no further study required.
Pay special attention to the False Negative category that may lead to missing risks. The model could not identify high risk in search results, and only manual review allowed handling the case properly. The False Positive category should also be monitored as it indicates High Risk and may lead to increased manual time, while the organization's risk is minimal.
Note: when no articles were found, the alerts are filtered from the confusion matrix as no manual review was performed.
Keywords
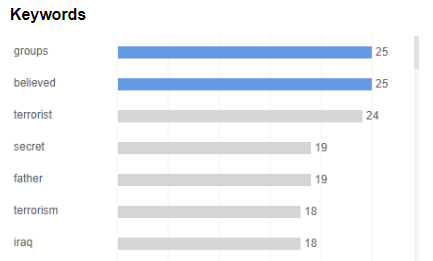
This section contains a list of keywords and how frequently each was used in the model to score the articles and assign appropriate risk categories. You can export this chart's content in the text format for further reference and use it for model revision and future retraining activities.
To export the list of keywords:
Click the white space in the chart area. Then, in the toolbar located at the dashboard's right top corner, click Download.
In the pop-up dialog, select the Data or Crosstab option to get underlying data in the text format.
Articles Analysis dashboard
The Articles Analysis dashboard gives an overview of the technical aspects of the process. It provides an understanding of the following:
- Processed article volumes
- Sources of information (domains)
- Distributions by risk category for each domain or in total
- Distribution of articles by size
- Successful parsing of articles found and dependency on the size of the article
Filtering options allow you to select an individual Business Process instance, specific process run, period of search, as well as specify a news portal or success ratio for the article parsing status.
- Color coding is used consistently across all views with every single color having the same meaning within the scope of the dashboard.
- The dashboard supports inline filtering actions. Selecting any entity in one view filters the other views according to the chosen value and selected filters.
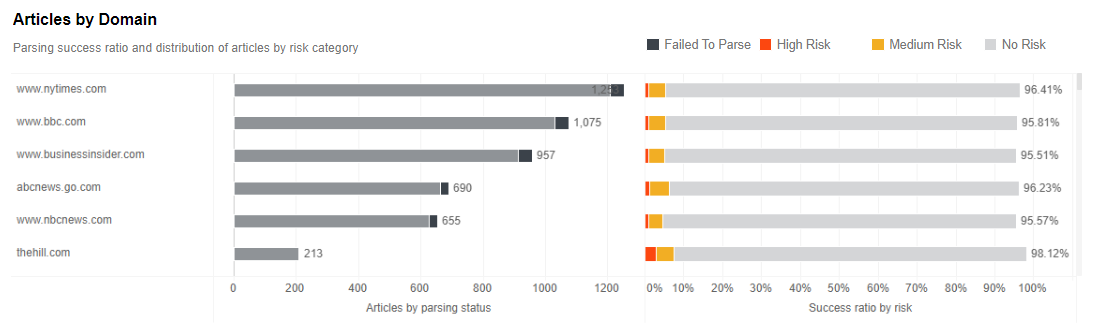
Articles by Domain
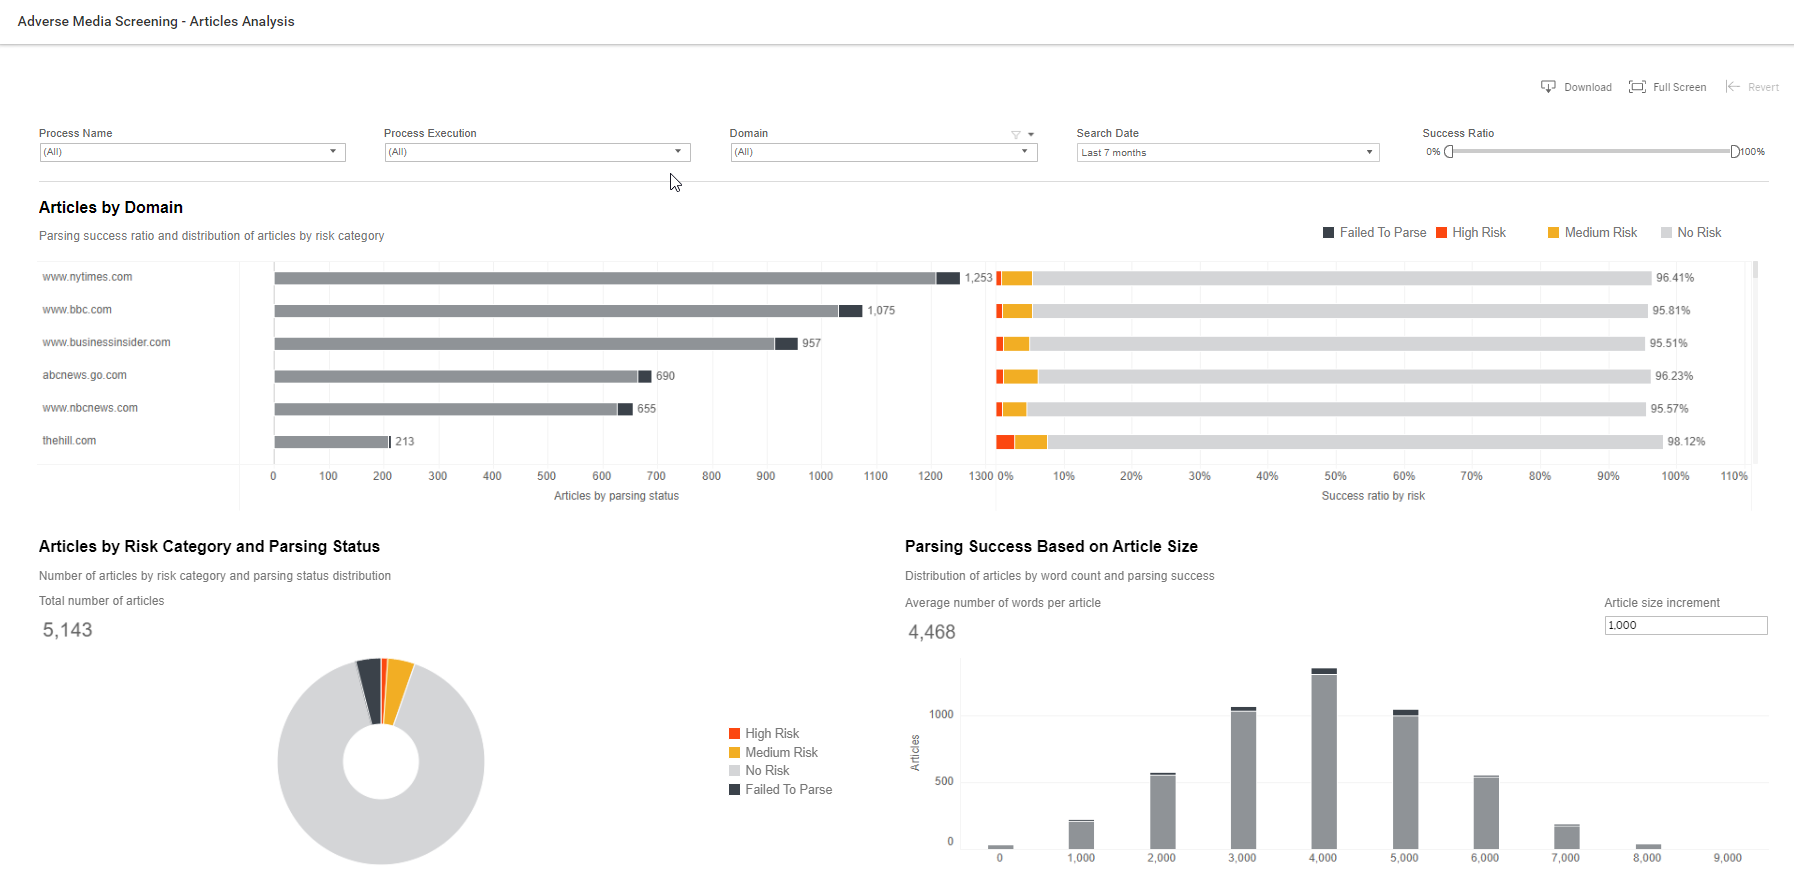
The view provides information about all the domains from which articles were sourced (BBC World, New York Times). The first section shows the Total Number of Articles retrieved from a specific domain. The breakdown by the parsing status displays overall volumes, primary sources of information, and parsing quality of each domain. The second section on the right indicates the distribution of successfully parsed articles by risk categories: High, Medium, Low, and No Risk (percentages are calculated relatively to the Total Number of Articles).
Example: The New York Times is the primary source of articles, and it was parsed successfully in >96 % of the cases. It has an expected rate of High-Risk articles within several percent (1% here). The Hill news website has high parsing success. Simultaneously, it brings a more significant contribution to High and Medium Risk articles. Here, additional training may be required to minimize reviews.
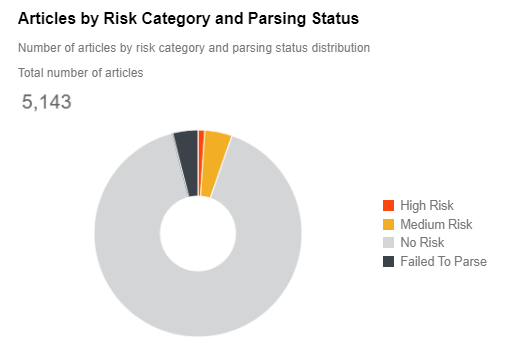
Articles by Risk Category and Parsing Status
The section shows the distribution of articles by risk category to assess levels of risk over time. It provides a review of the total number of articles that were not parsed and how they are distributed among risk categories: High Risk, Medium Risk, Low Risk, or No Risk.
Parsing Success Based on Article Size
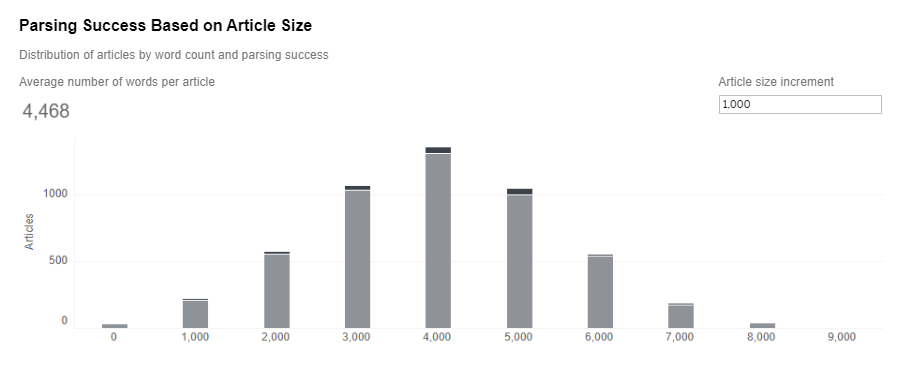
The chart provides information on the articles' distribution by content size and error status during the parsing step to understand the size of commonly processed articles. This view also allows you to evaluate how effectively the parser works with various article sizes and identify areas for improvements. The section is most relevant when using Google News or Google.com and its local variants, such as the news provider rather than a curated news provider (for example, Factiva).
Each bar represents a bin for article size (word count), and it can be changed using the Article size increment parameter. The first bar has the zero (0) label and contains all articles within the defined size increment. See the example and description below.
Note: Article size increment is set to 1,000 words, and the first bar (zero/0) represents all the articles with a size from 0 to 1,000 words.