Analyze effectiveness
Out of the box, the NSS skill includes three Superset-based dashboards:
To access the dashboards, log into Control Tower and navigate to Analytics > Dashboards.
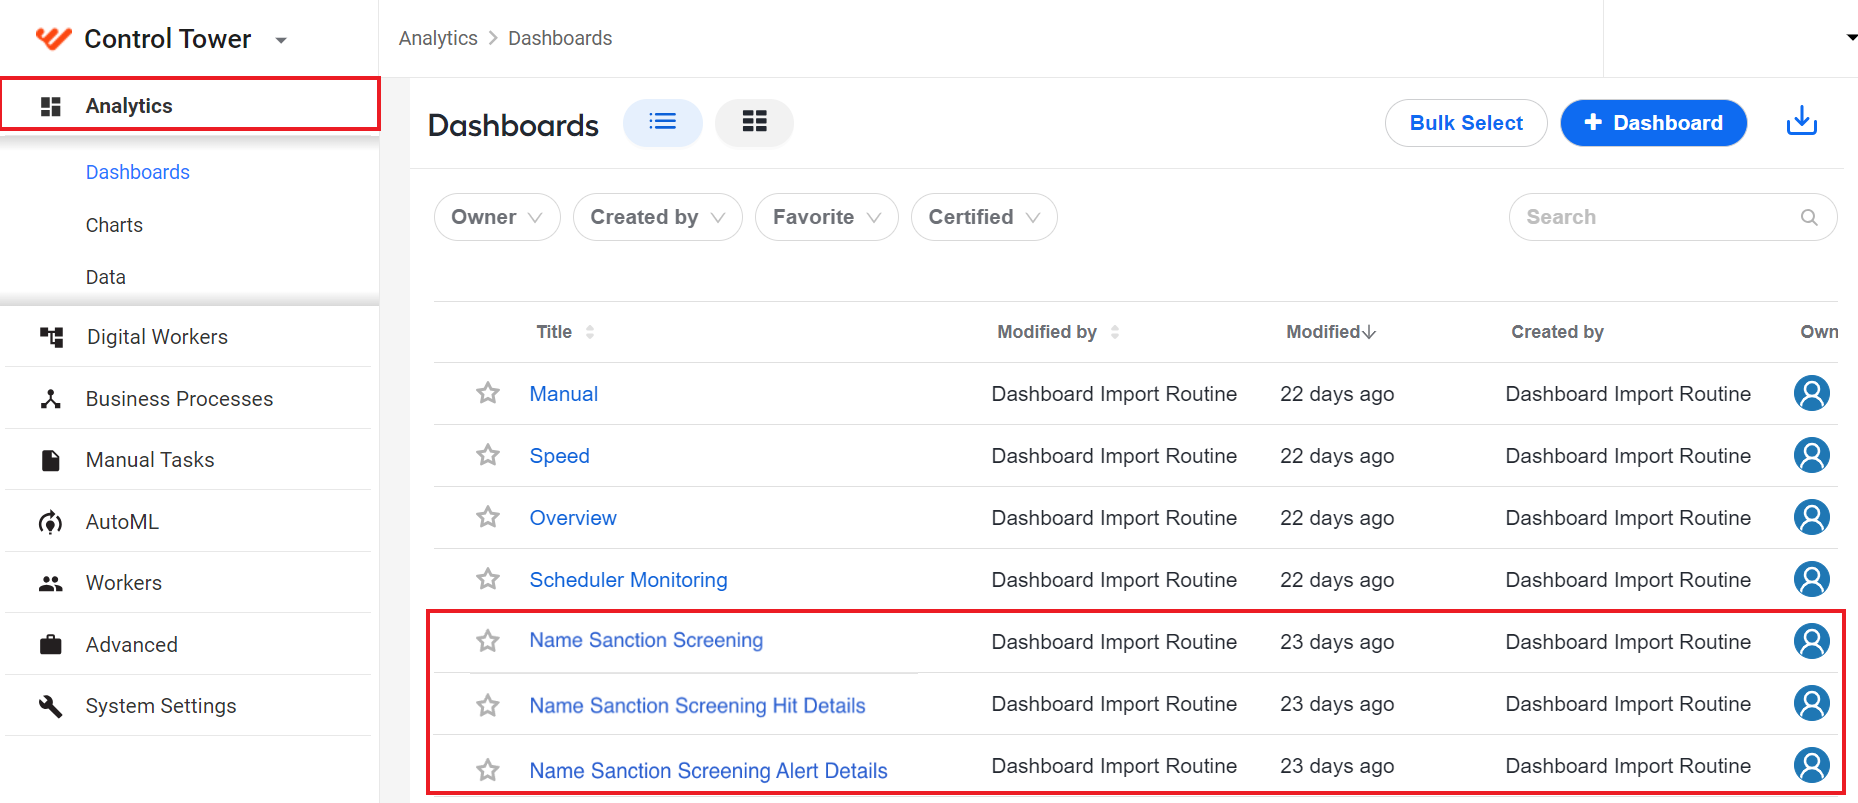
Name Sanction Screening
The Name sanctions screening dashboard contains information about the skill's main performance metrics and trends.
Automation metrics
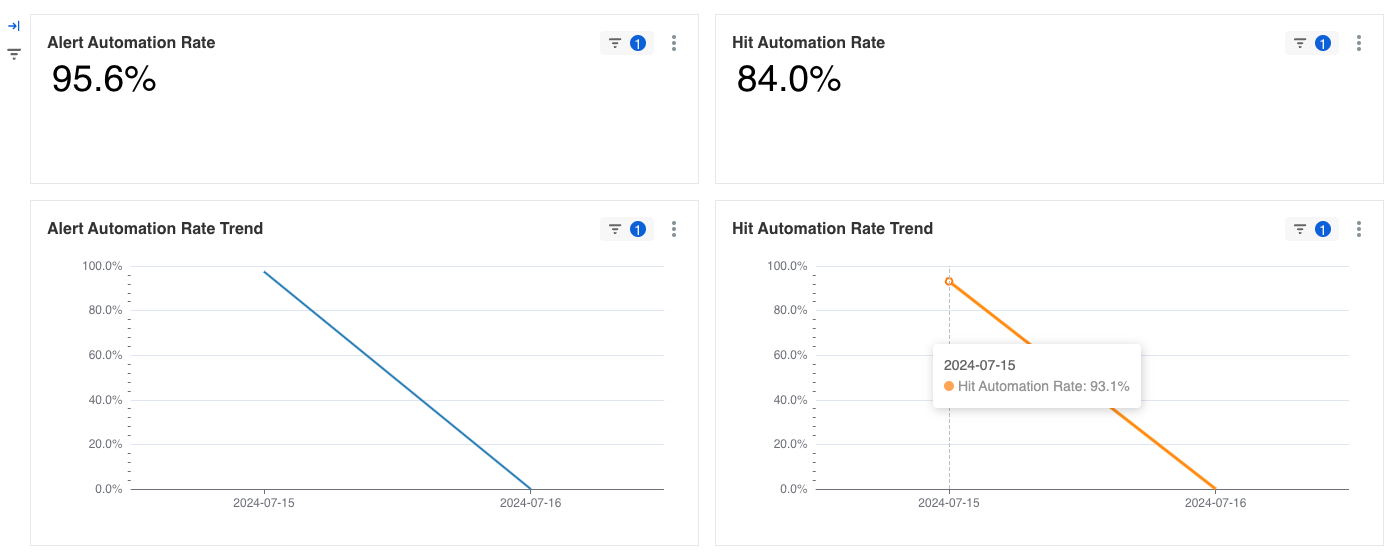
The view covers the following metrics:
Alert Automation Rate: how many alerts were automatically dispositioned by Evelyn.
Percentage: the percentage of alerts processed automatically
Trend: a line graph showing the trend of alert automation rates over time
Hit Automation Rate: how many hits were automatically dispositioned by Evelyn.
Percentage: the percentage of hits processed automatically
Trend: a line graph showing the trend of hit automation rates over time
True and False Positive metrics
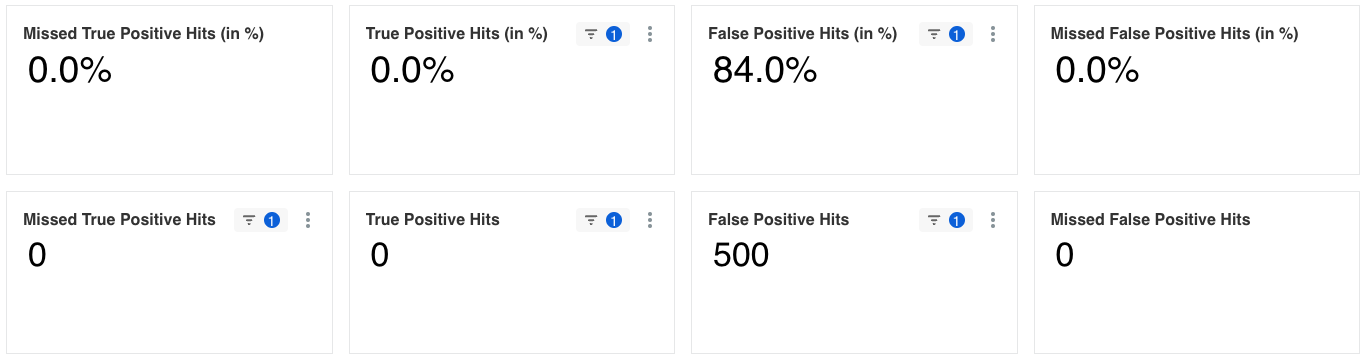
The view covers the following metrics:
Missed True Positive Hits: how many True Positive hits were missed, based on the manual review
Percentage: the percentage of missed True Positive hits relative to total hits, based on the manual review
Count: the number of missed True Positive hits based on the manual review
True Positive Hits
Percentage: the percentage of True Positive hits relative to total hits based on manual review
Count: the number of True Positive hits, based on the manual review
False Positive Hits
Percentage: the percentage of False Positive hits relative to total hits, based on the manual review
Count: the number of False Positive hits, based on the manual review
Missed False Positive hits
Percentage: the percentage of missed False Positive hits relative to total hits, based on the manual review
Count: the number of missed False Positive hits, based on the manual review
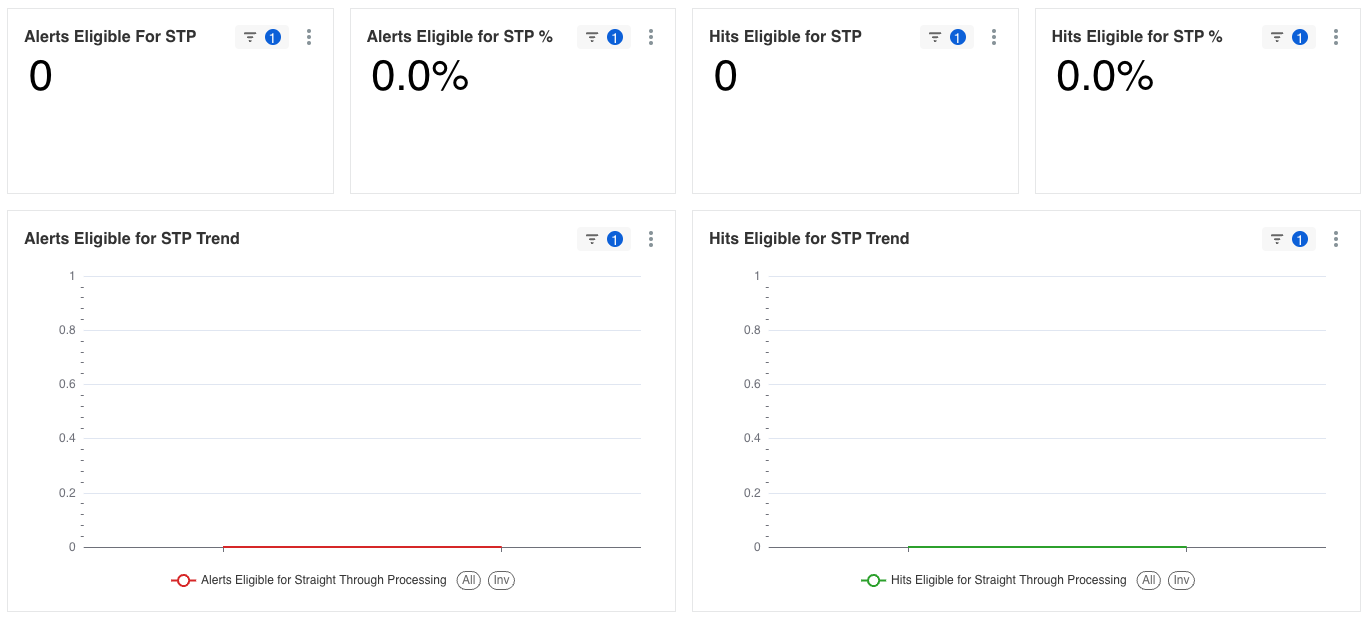
Straight-through processing (STP) metrics
From the view, you can learn how many alerts and hits are processed automatically without manual intervention and how the metrics change over time. A higher percentage suggests more efficient automation.
Alert and hit overview
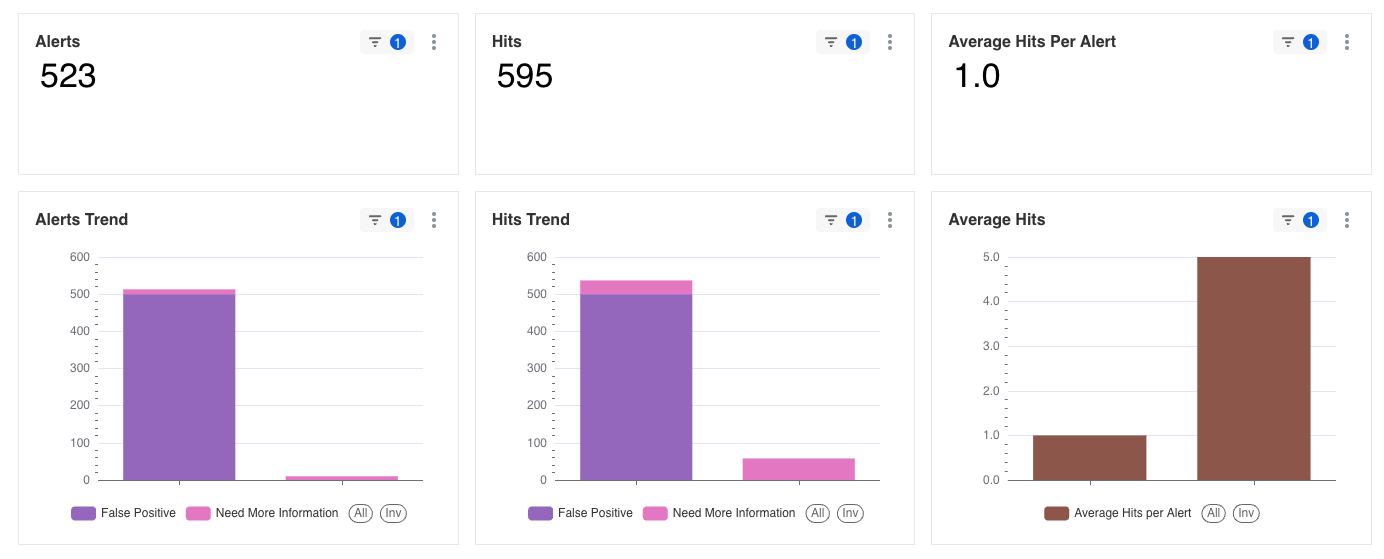
The view shows the following metrics:
Alert Trends and Hit Trends: these graphs show the distribution of alerts and hits categorized into False Positive and Need More Information. This helps in understanding the quality of the screening process.
Average Hits: the metric indicates how many hits, on average, are associated with each alert, providing insight into the screening process precision.
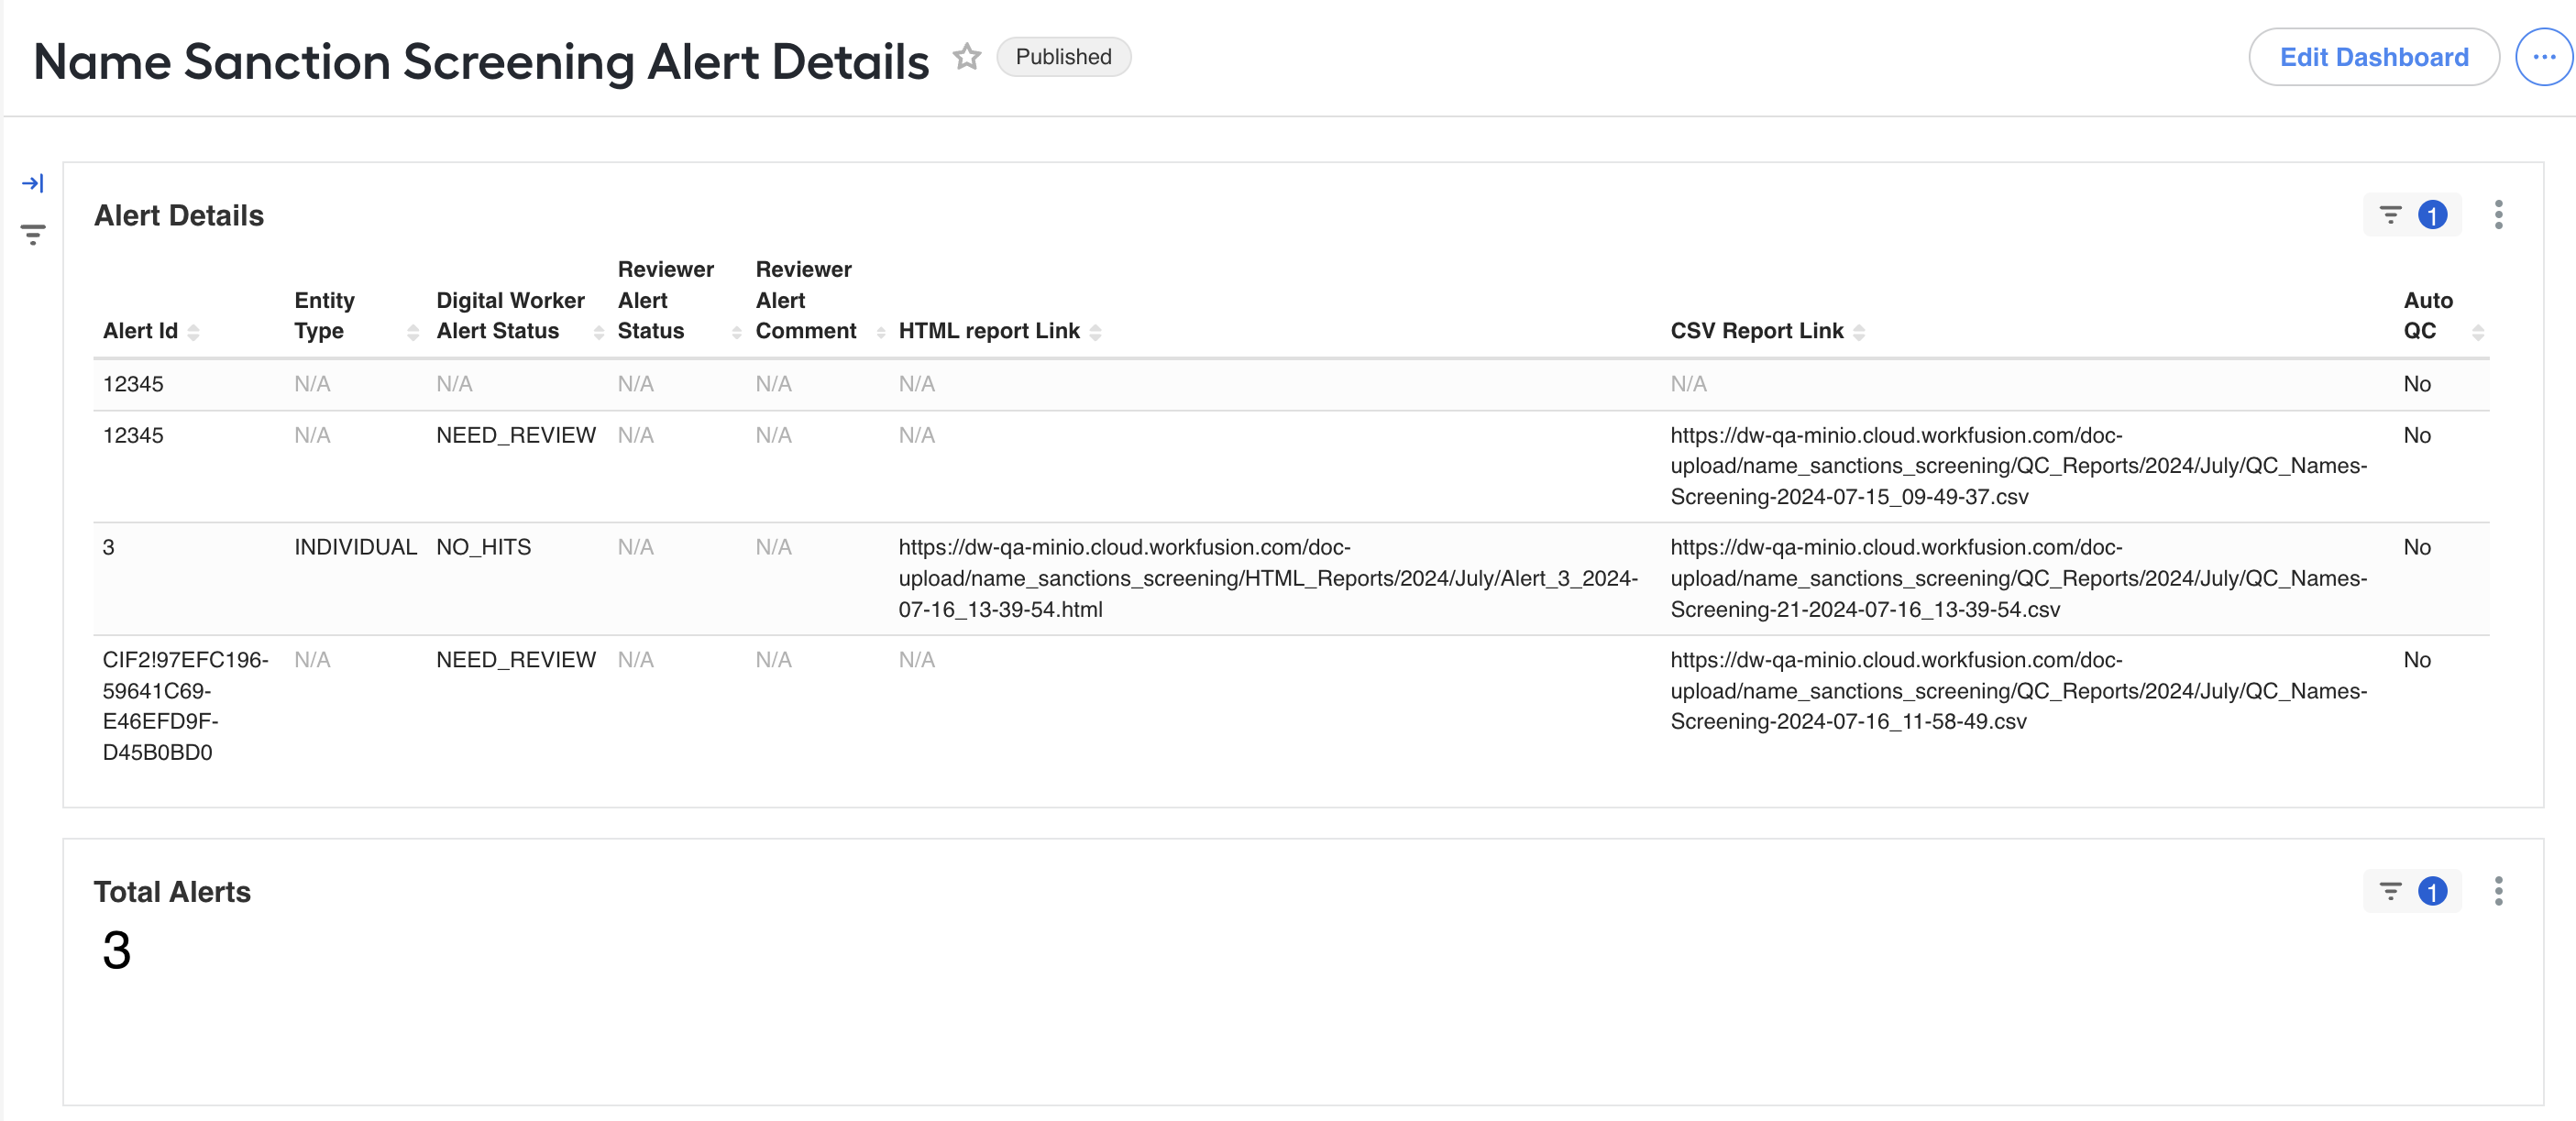
Name Sanction Screening Alert Details
The Name Sanction Screening Alert Details dashboard represents alert information in a table view. The table contains the following alert-associated information:
Alert ID
Entity type
Digital Worker alert status
Reviewer alert status
Reviewer alert comment
Reviewer name
HTML report link
CSV report link
Auto QC
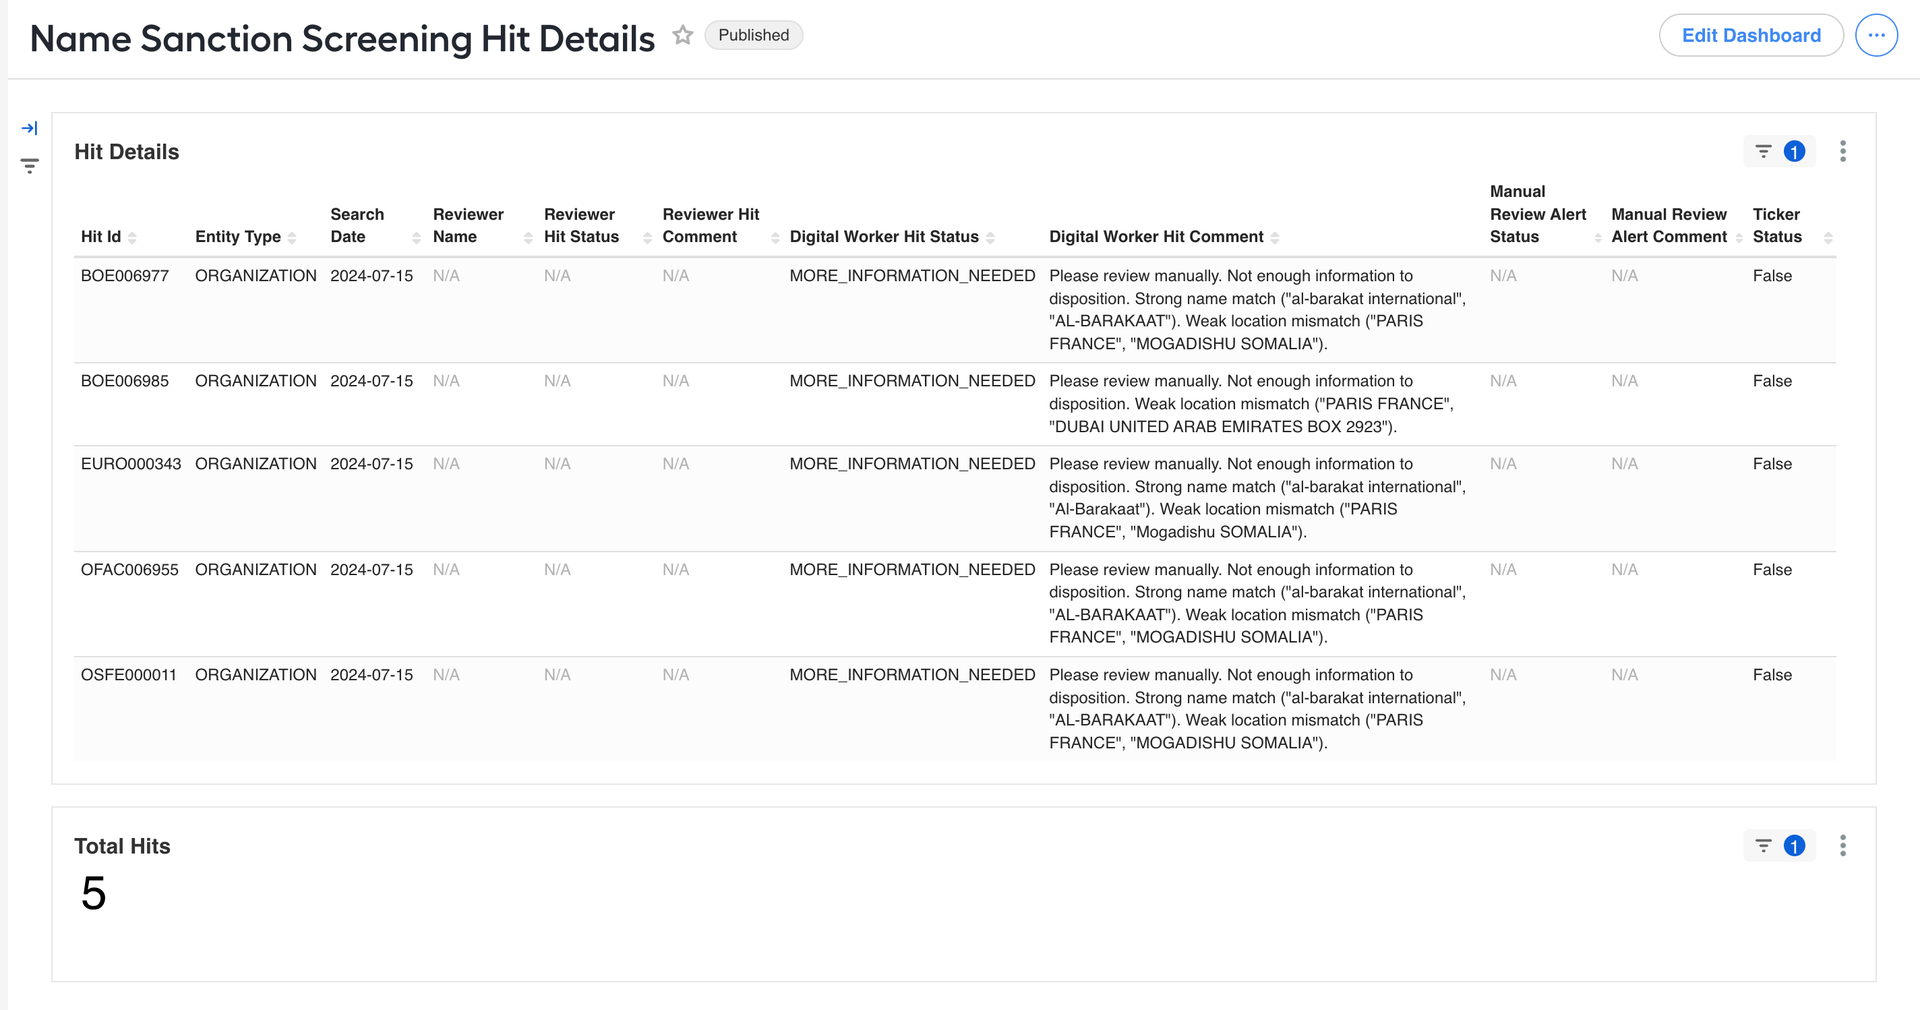
Name Sanction Screening Hit Details
The Name Sanction Screening Hit Details dashboard represents hit information in a table view. The table contains the following hit-associated information:
Hit ID
Entity type
Search date
Reviewer hit status
Reviewer hit comment
Reviewer name
Digital Worker hit status
Digital Worker hit comment
Manual review alert status
Manual review alert comment
Ticker status from the used Names Screening Ticker Lookup Business Process