
Business Process troubleshooting algorithms
EGID
EGID is the experiment group ID. You can find it in the WF WFML_Job_Data Data Store. Also, you can find EGID as described below:
Open your Automation Training Business Process.
Go to Data.
Find the _sys_automation_experiment_group column in the data grid that contains EGID for your train:

EGID includes the BP UUID. It can be found in the link to the Automation BP (/workfusion/secure/business-process/edit/0e6aab2e-bbc3-4745-b326-dc5cc8053aeb). The BP UUID can be used for searching EGID.
note
In Marthon and Mesos, char _ is replaced with - (message_0e6aab2e-bbc3-4745-b326-dc5cc8053aeb →message-0e6aab2e-bbc3-4745-b326-dc5cc8053aeb).
From VDS version 8.5.7 (WF version 8.5.1 and above), for extract jobs, the _ character is replaced with --.
MESOS task states:
RUNNING: the task is now active.
KILLED: the task was completed successfully.
FAILED: the task was unexpectedly stopped because an error occurred.
SIGTERM and SIGKILL: in Mesos, every successfully completed job contains these signals in logs.
"VDS eval service unavailable" or "Automation extract service available" errors
The "VDS eval service unavailable" error can be caused by many reasons. To investigate, follow the steps below:
Open Marathon. The default link is <ML_DNS>:8480.
Check the eval application list.
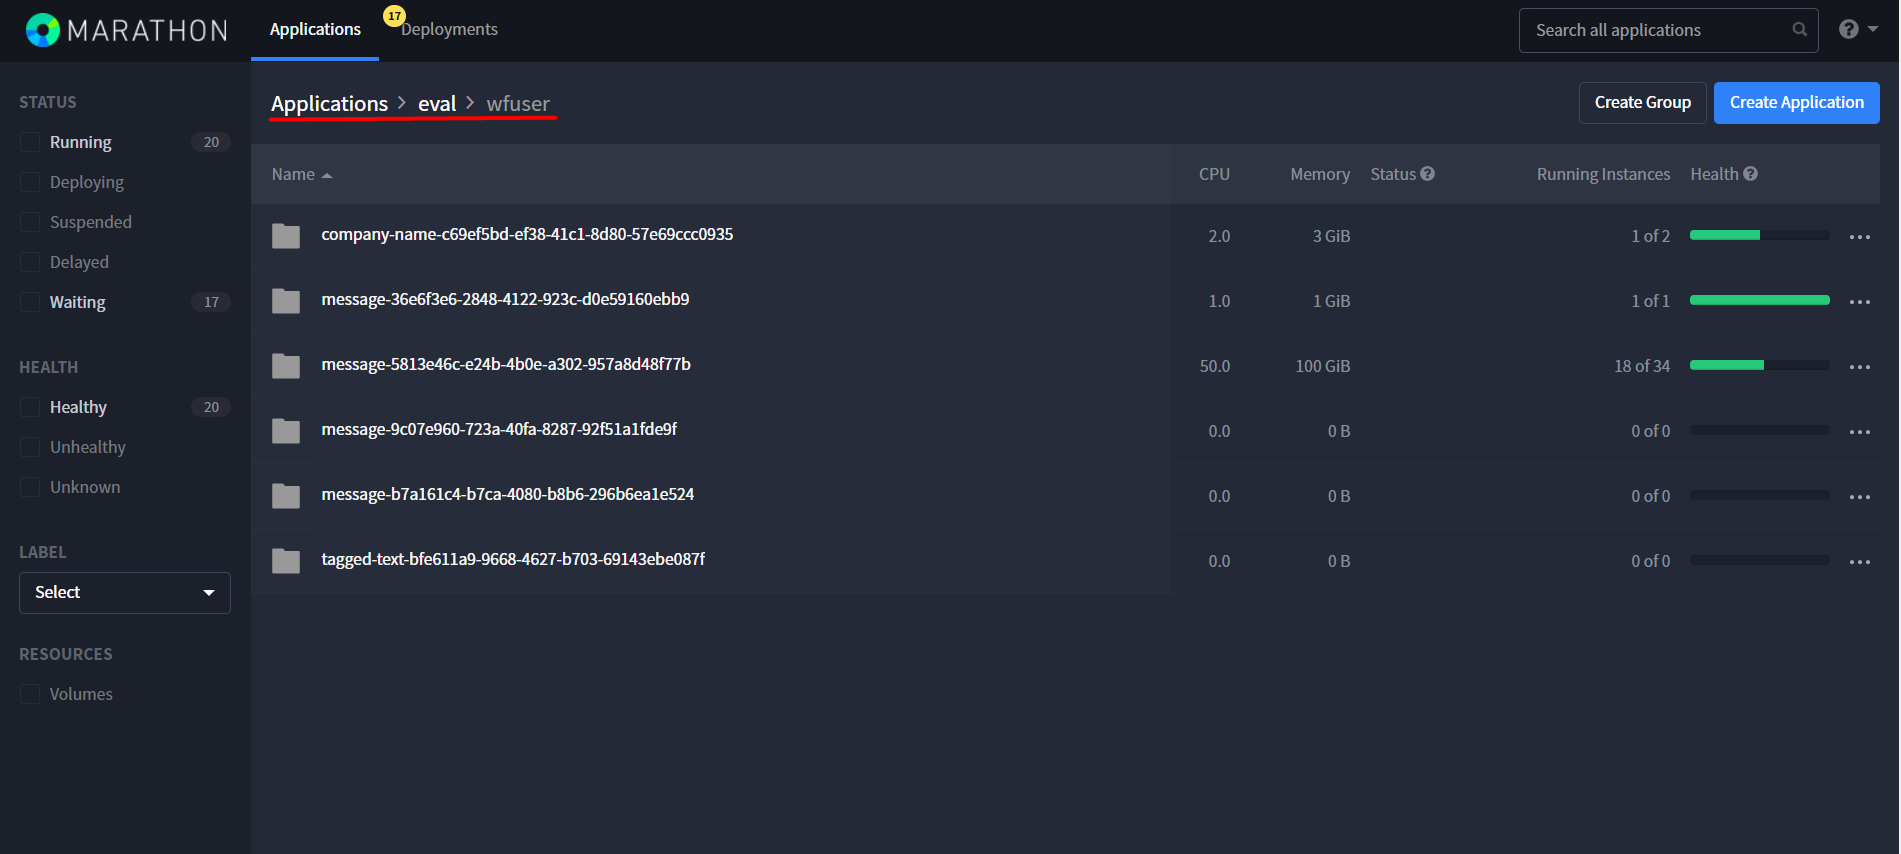
If the eval application list is EMPTY, then proceed as follows:
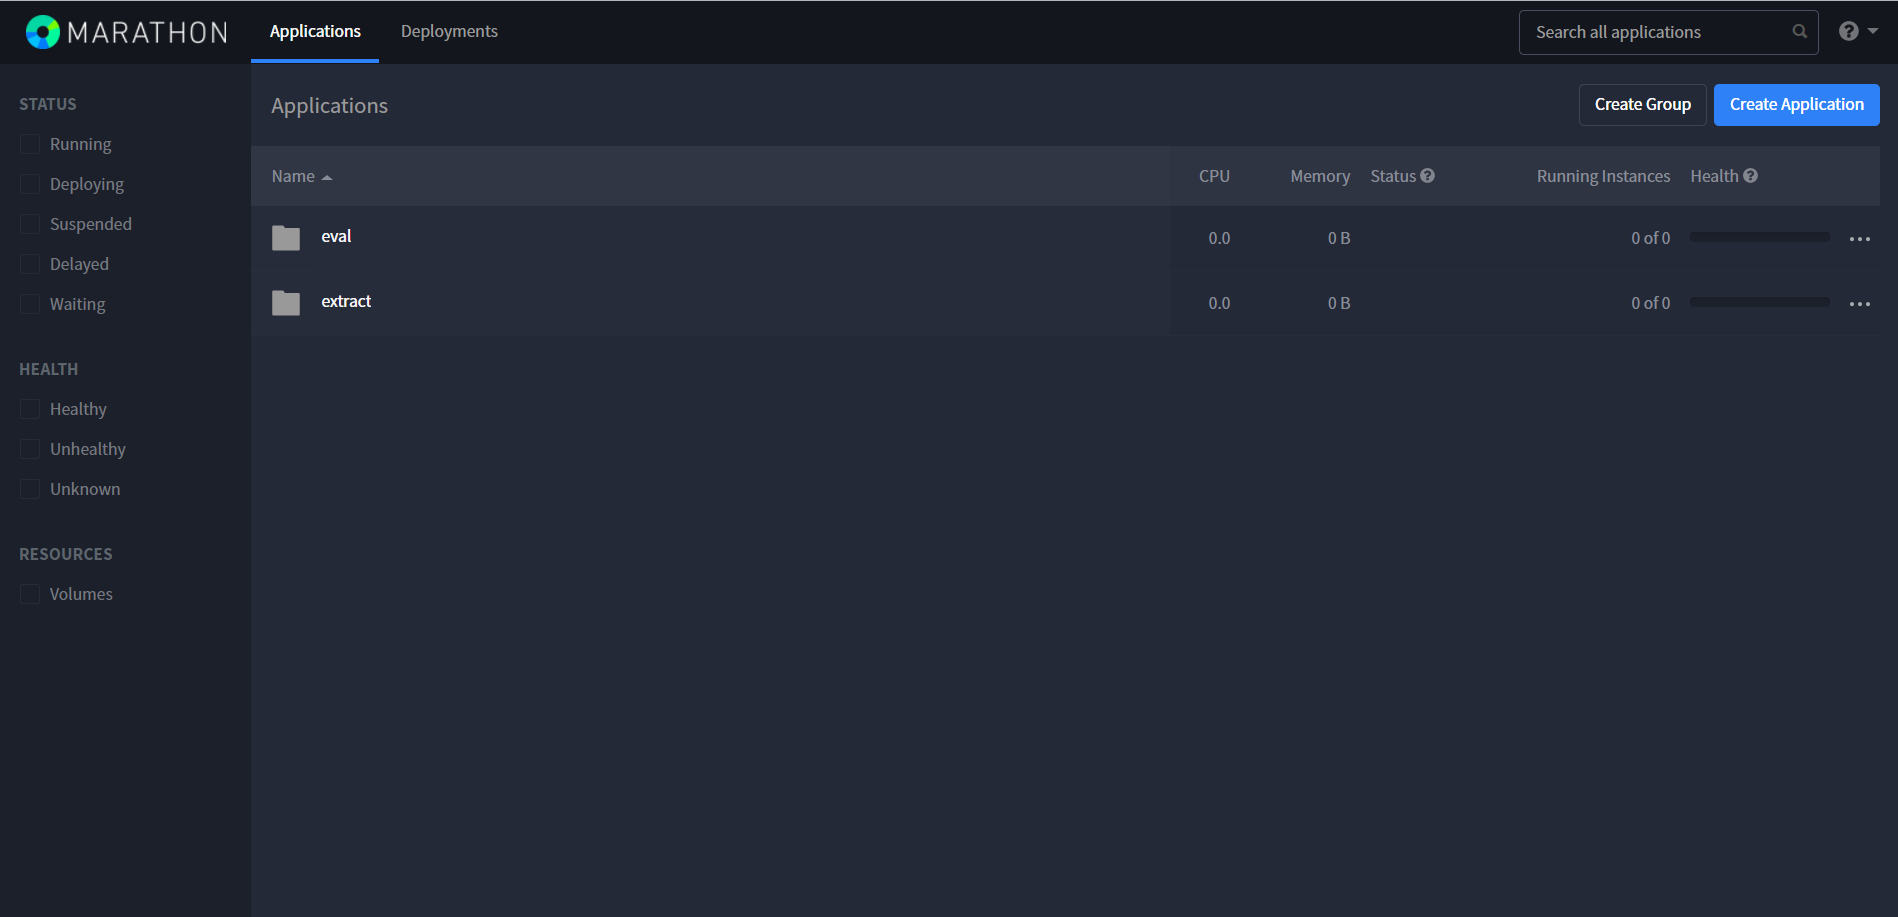
- Check the
vds-mesos-adapterlog. The path to thevds-mesos-adapterlog is/supervisord/log/vds-mesos-adapter.out.log. In the log, look for errors related to EGID. - If there are no such errors in the
vds-mesos-adapterlog, check thevds-gatewaylog. The path to thevds-gatewaylog is/supervisord/log/vds-gateway-service.out.log. In the log, look for any information related to EGID. - If there is no such info in the
vds-gatewaylog, check Nginx logs. The path to Nginx logs is/supervisord/log/nginx.out.logand/supervisord/log/nginx.err.log. In the logs, look for requests from WF. - If there are no requests, check the connection to WF. Most likely, WF can't connect to the VDS server.
- Check the
If the
vds-gatewaylog contains any such info, but those are not errors, proceed as described below:To check consumers, open RabbitMQ. The default link is :45672.
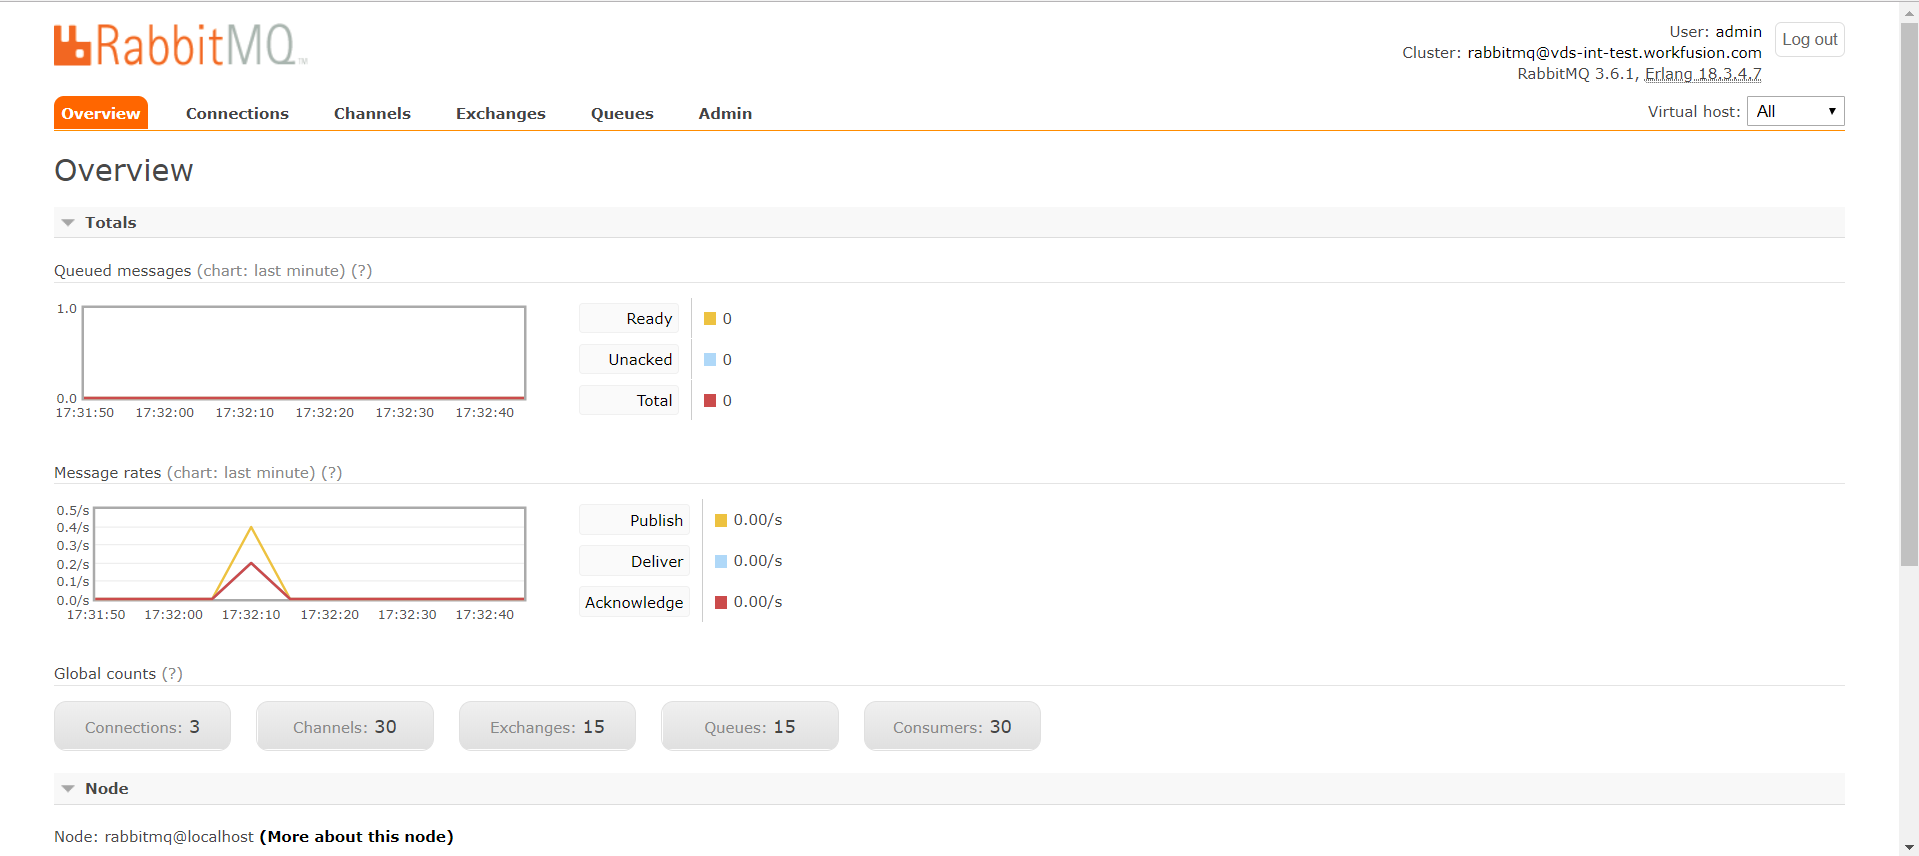
Go to the Queues tab and open the MESOS_START_EVAL queue.
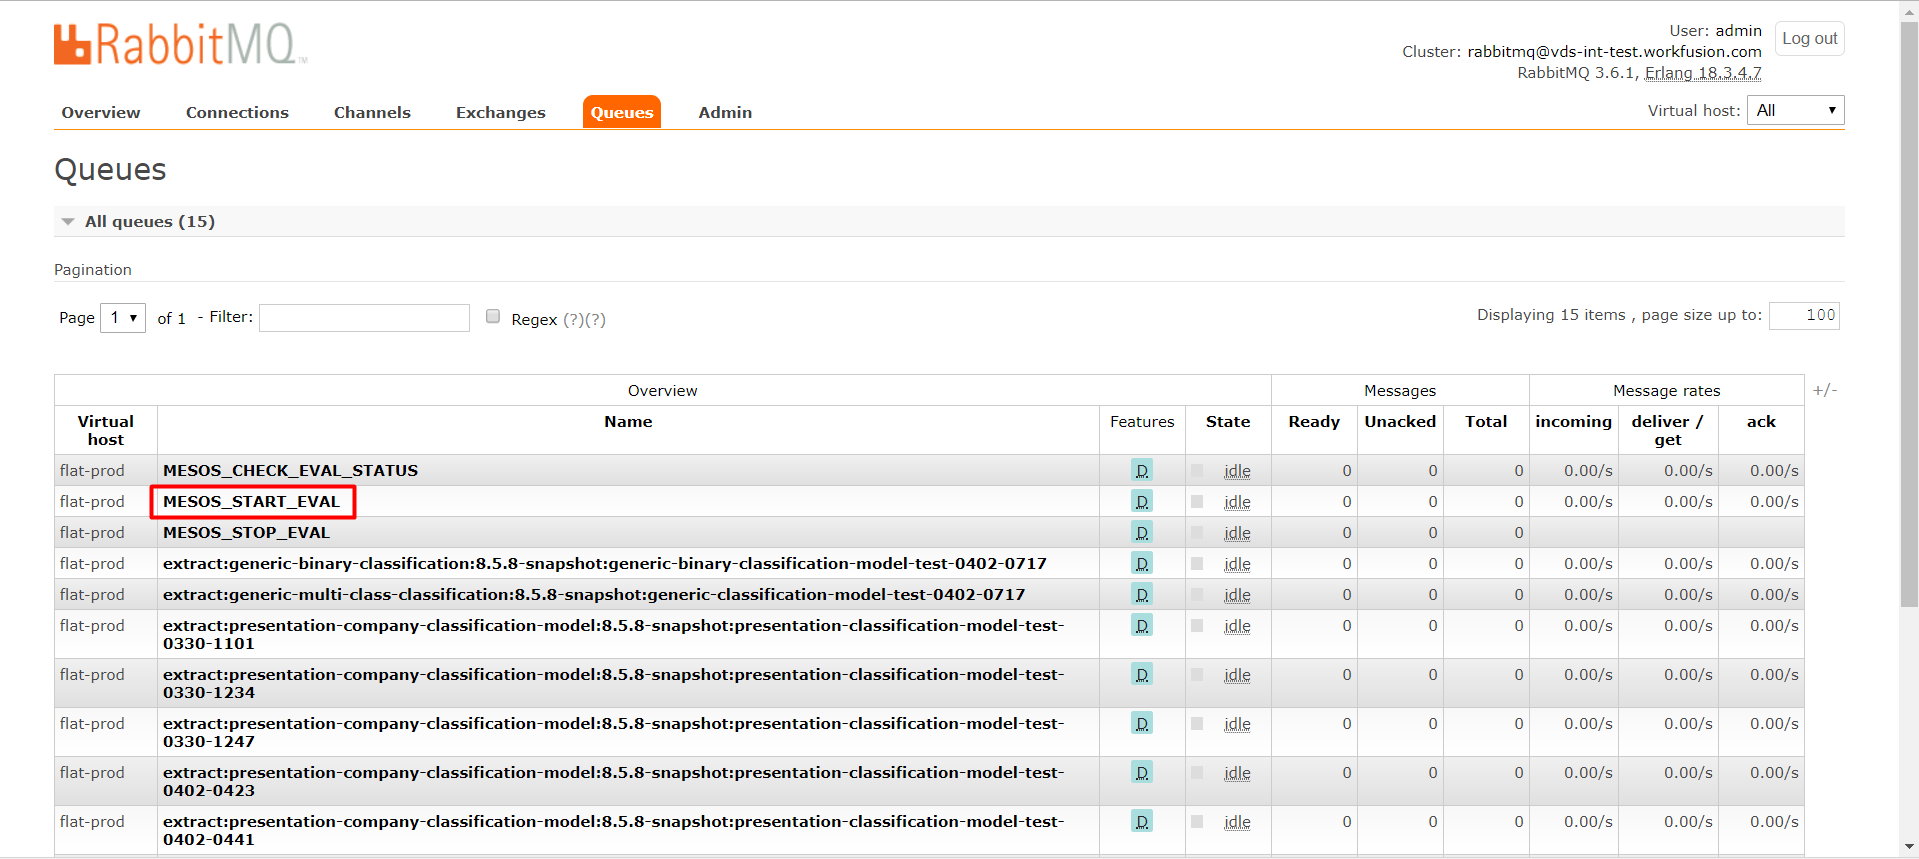
Review the Consumers table.
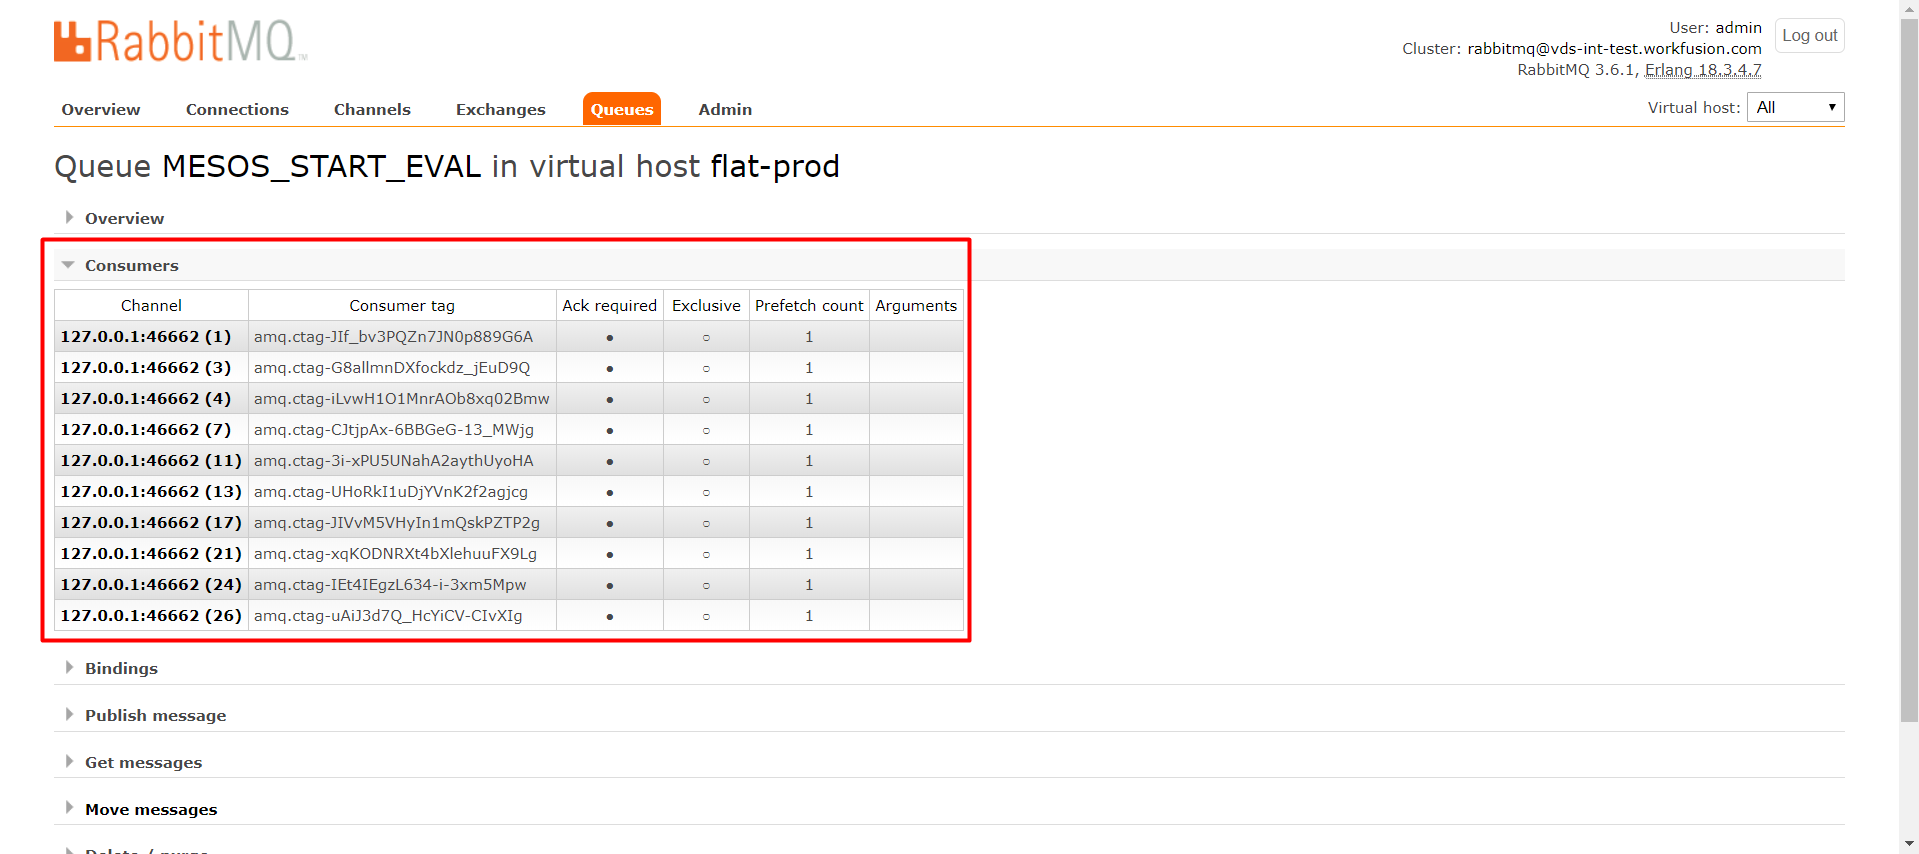
If this table is empty, restart
vds-mesos-adapter. Most likely,vds-mesos-adapteris down or does not respond. You need to restart it:wfmanager restart mesos-adapterIf this table is not empty, restart
vds-mesos-adapter.If there are any errors related to EGID, analyze them. If this is not helpful, submit a ticket requesting support for further investigation.
If there are applications in the RUNNING status, open Mesos (default link :5050) and proceed as described below:
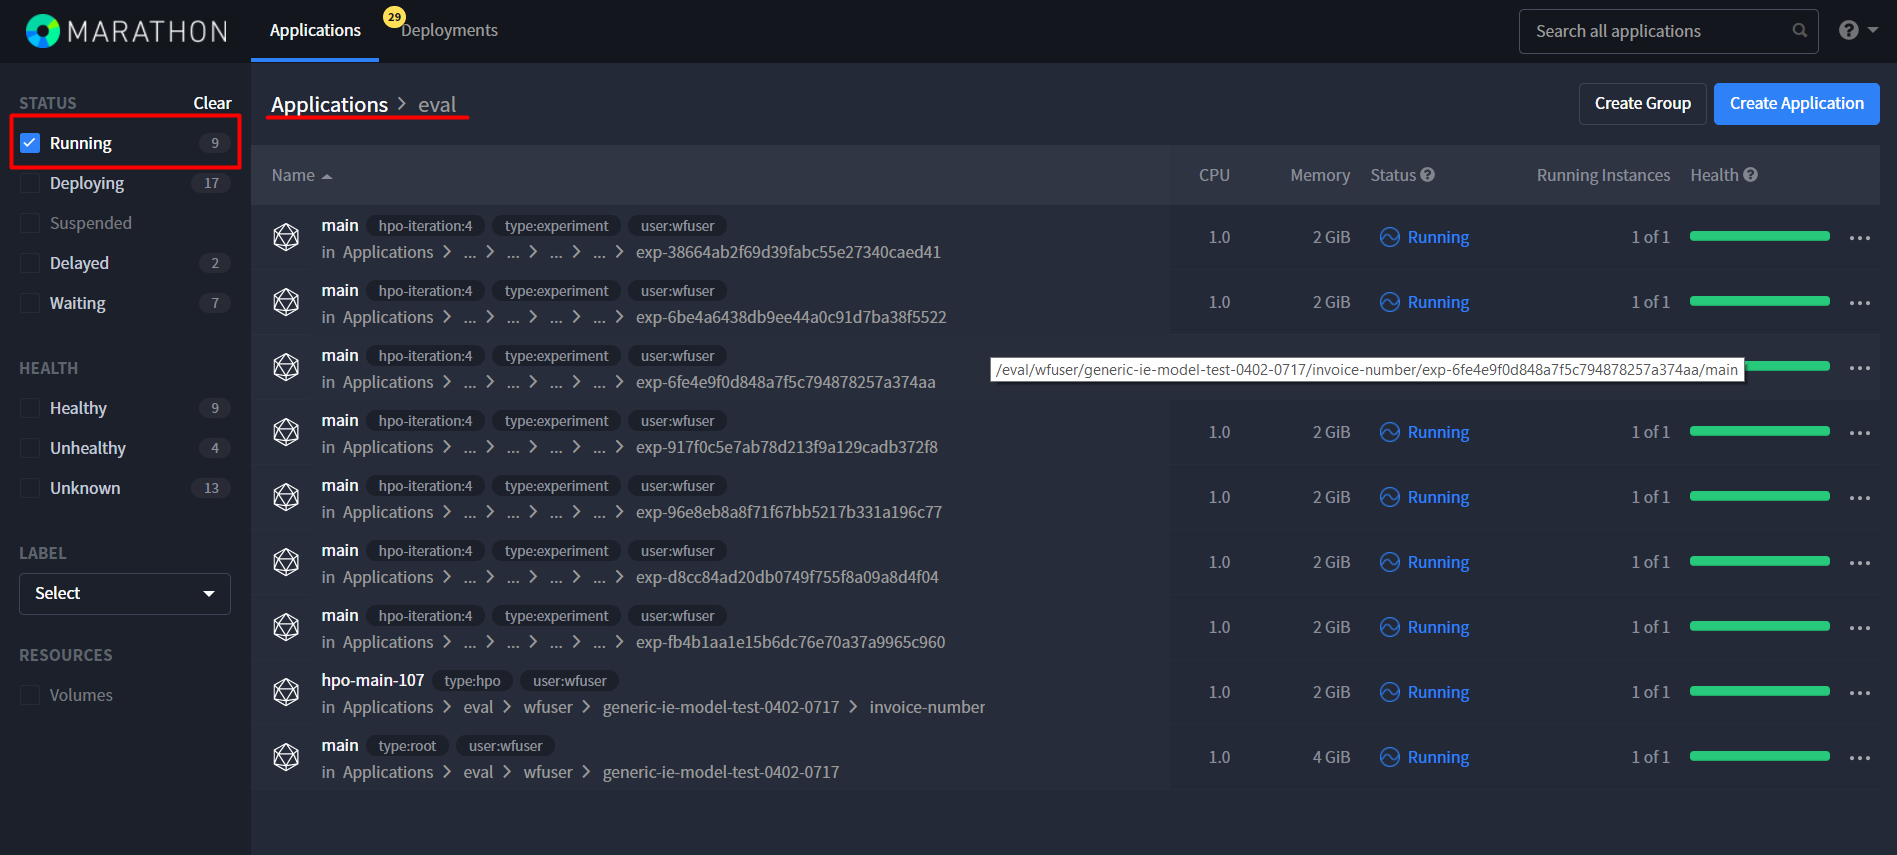
Check Mesos for active and completed tasks.
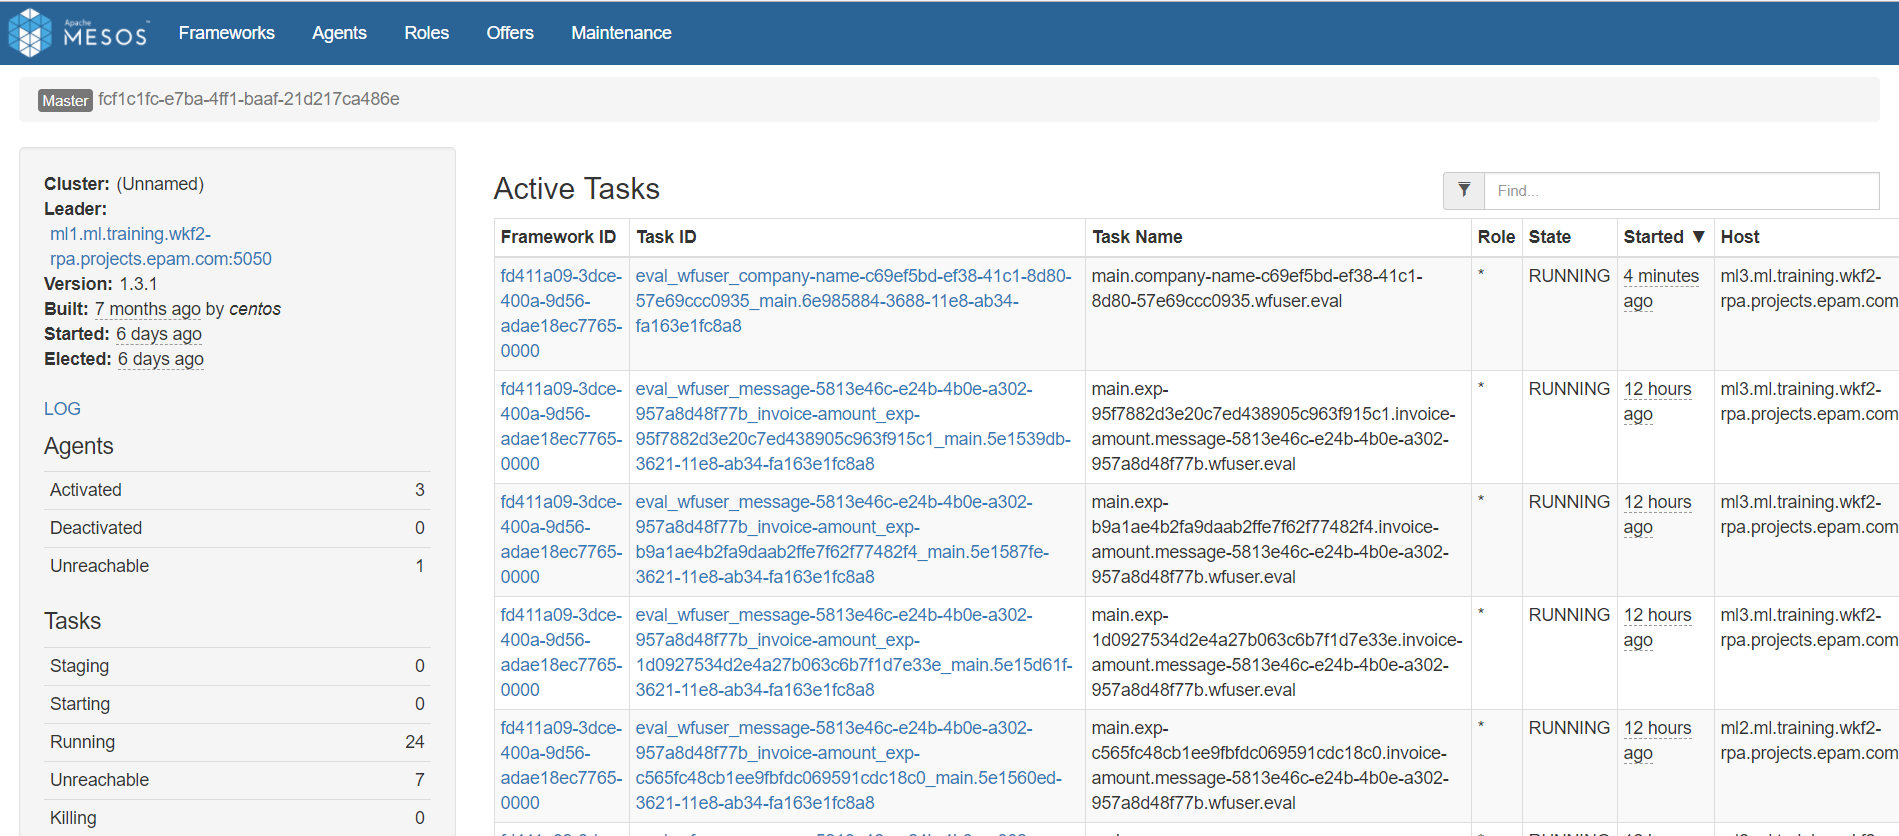
If the Active tasks table is not empty, check the lifetime of active tasks.
By default, the Active tasks table is sorted by the Started time. Find the first task where the Task Name is not starting with hpo-main or main. If the task has a lifetime of more than 12 hours, copy Task ID, for instance, eval_wfuser_presentation-ie-model-test-0405-0527_fold3_pe-evaluate-267.aaade8e8-38b5-11e8-a04c-000c2999ff98.
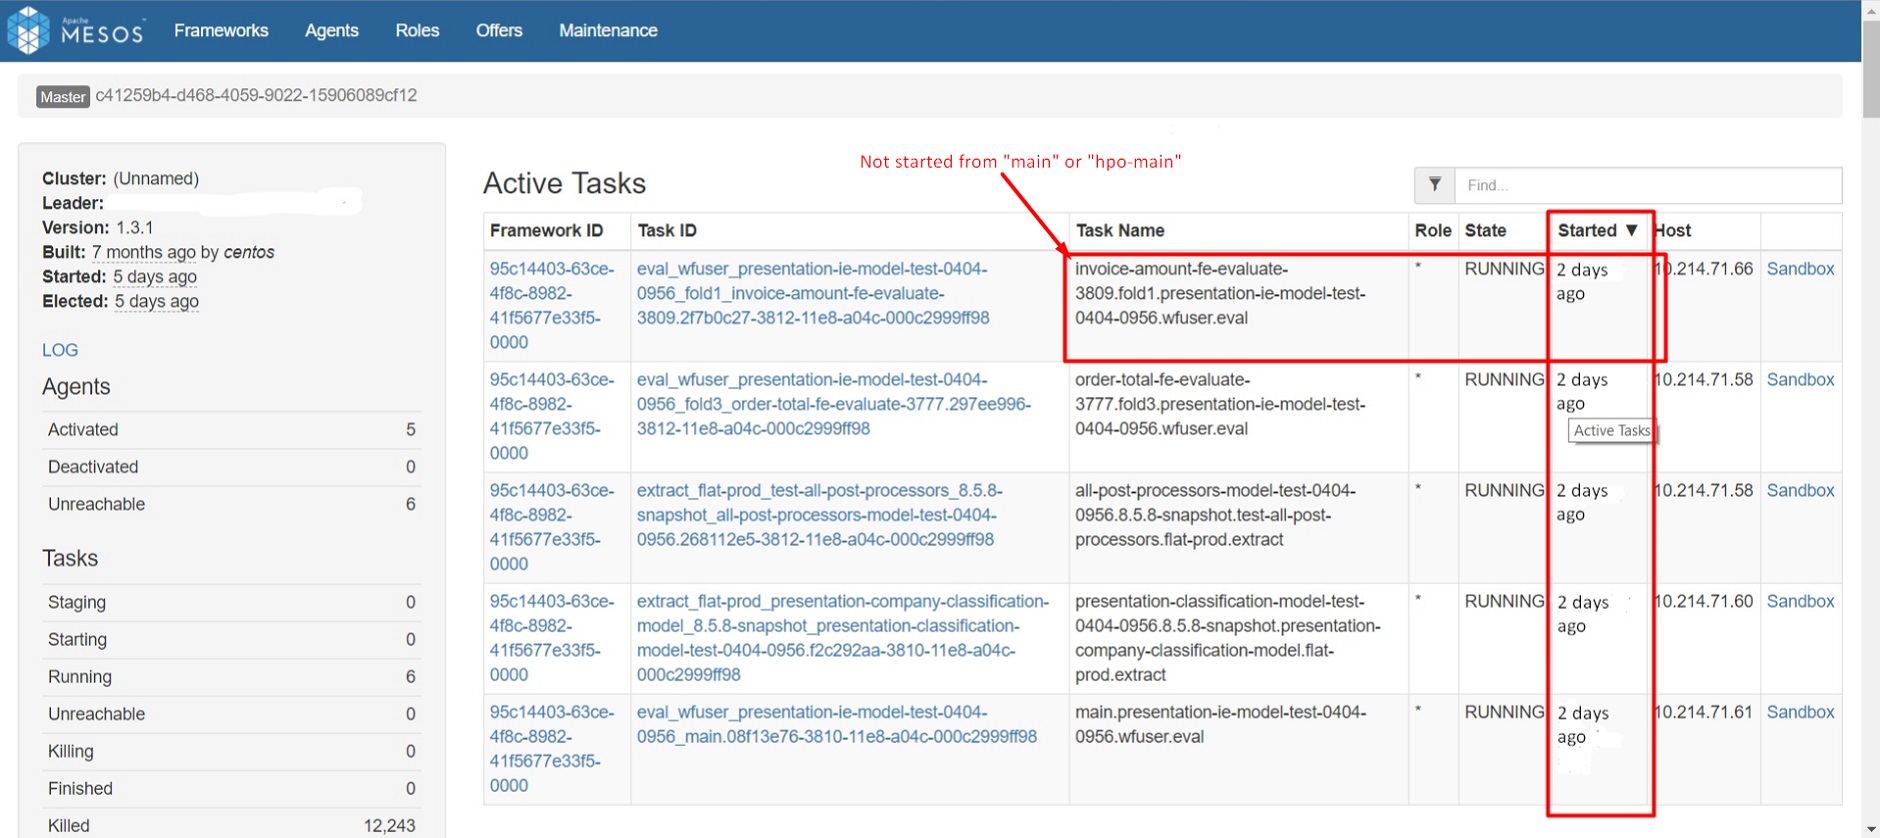
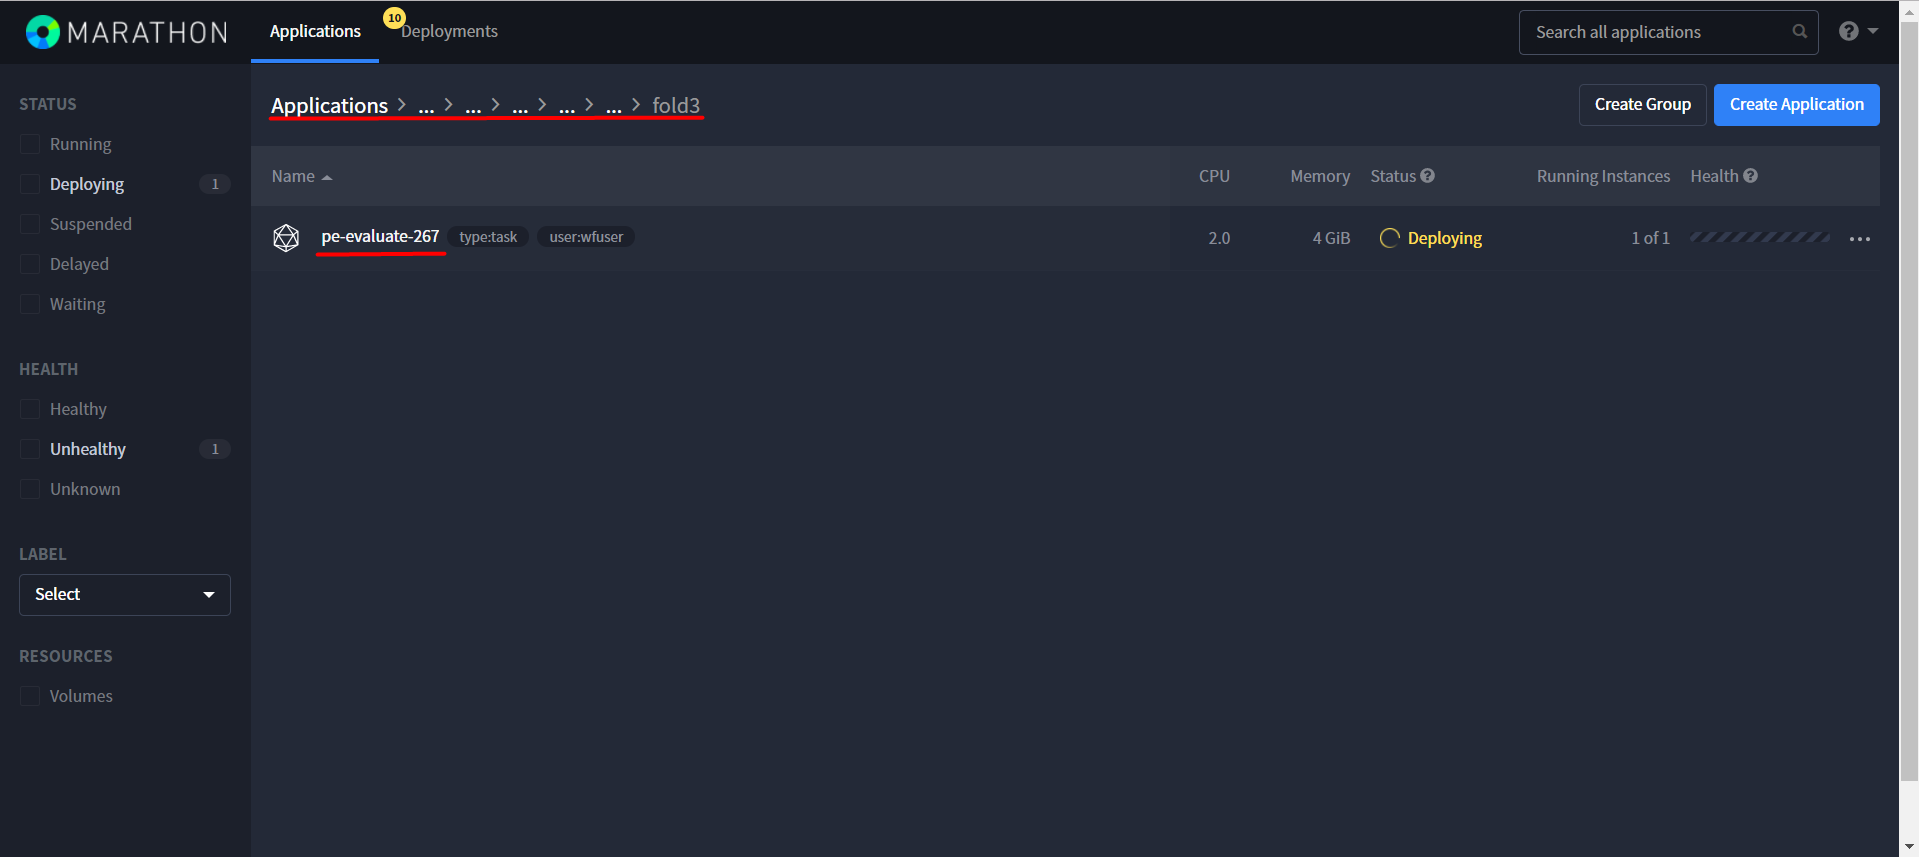
Open Marathon (default link :8480). From Task ID, you can get the path to the application. You need the part of the Task ID before the dot. For example, eval_wfuser_presentation-ie-model-test-0405-0604_fold3_pe-evaluate-267.aaade8e8-38b5-11e8-a04c-000c2999ff98.
Replace the _ character with /. For example, eval_wfuser_presentation-ie-model-test-0405-0604_fold3_pe-evaluate-267 gives the following path: eval/wfuser/presentation-ie-model-test-0405-0604/fold3/pe-evaluate-267. The last part of the path is the application name (for instance, pe-evaluate-267).
In this folder (eval/wfuser/presentation-ie-model-test-0405-0604/fold3), click the application name.
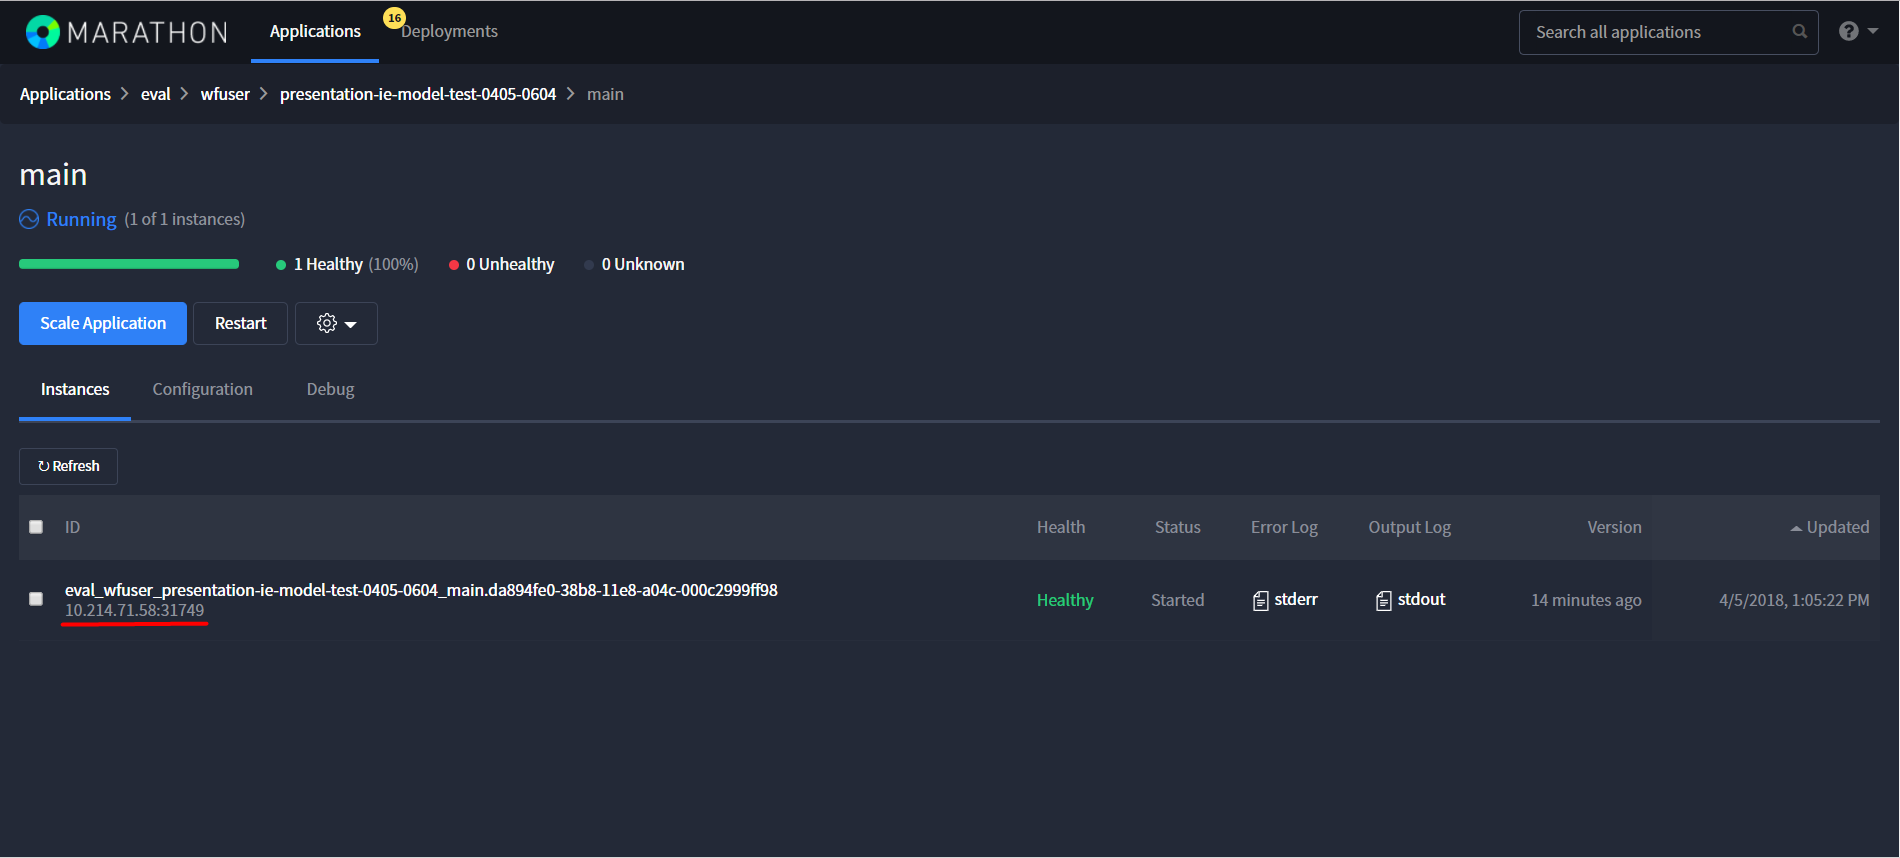
On the next page, click the link under the application ID to open the actuator.
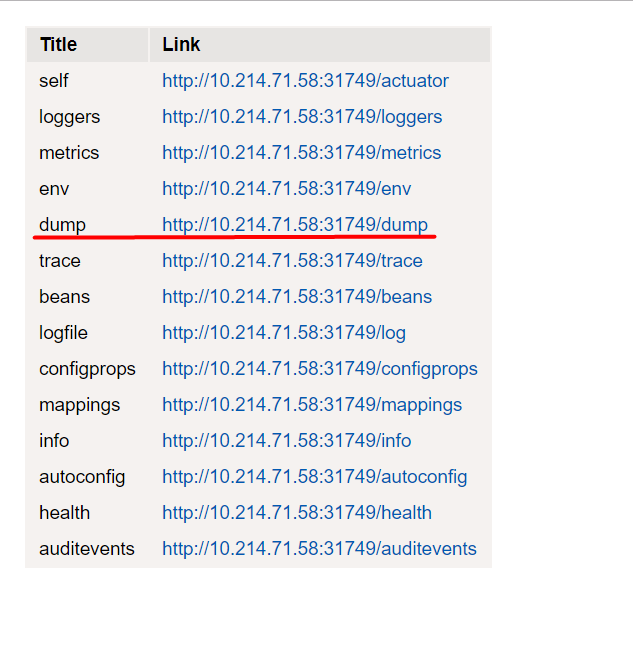
Download the dump and analyze it or attach it to the ticket for further investigation.
If the task has a lifetime of less than 12 hours, open the sandbox by clicking the Sandbox link in the Active Tasks table.
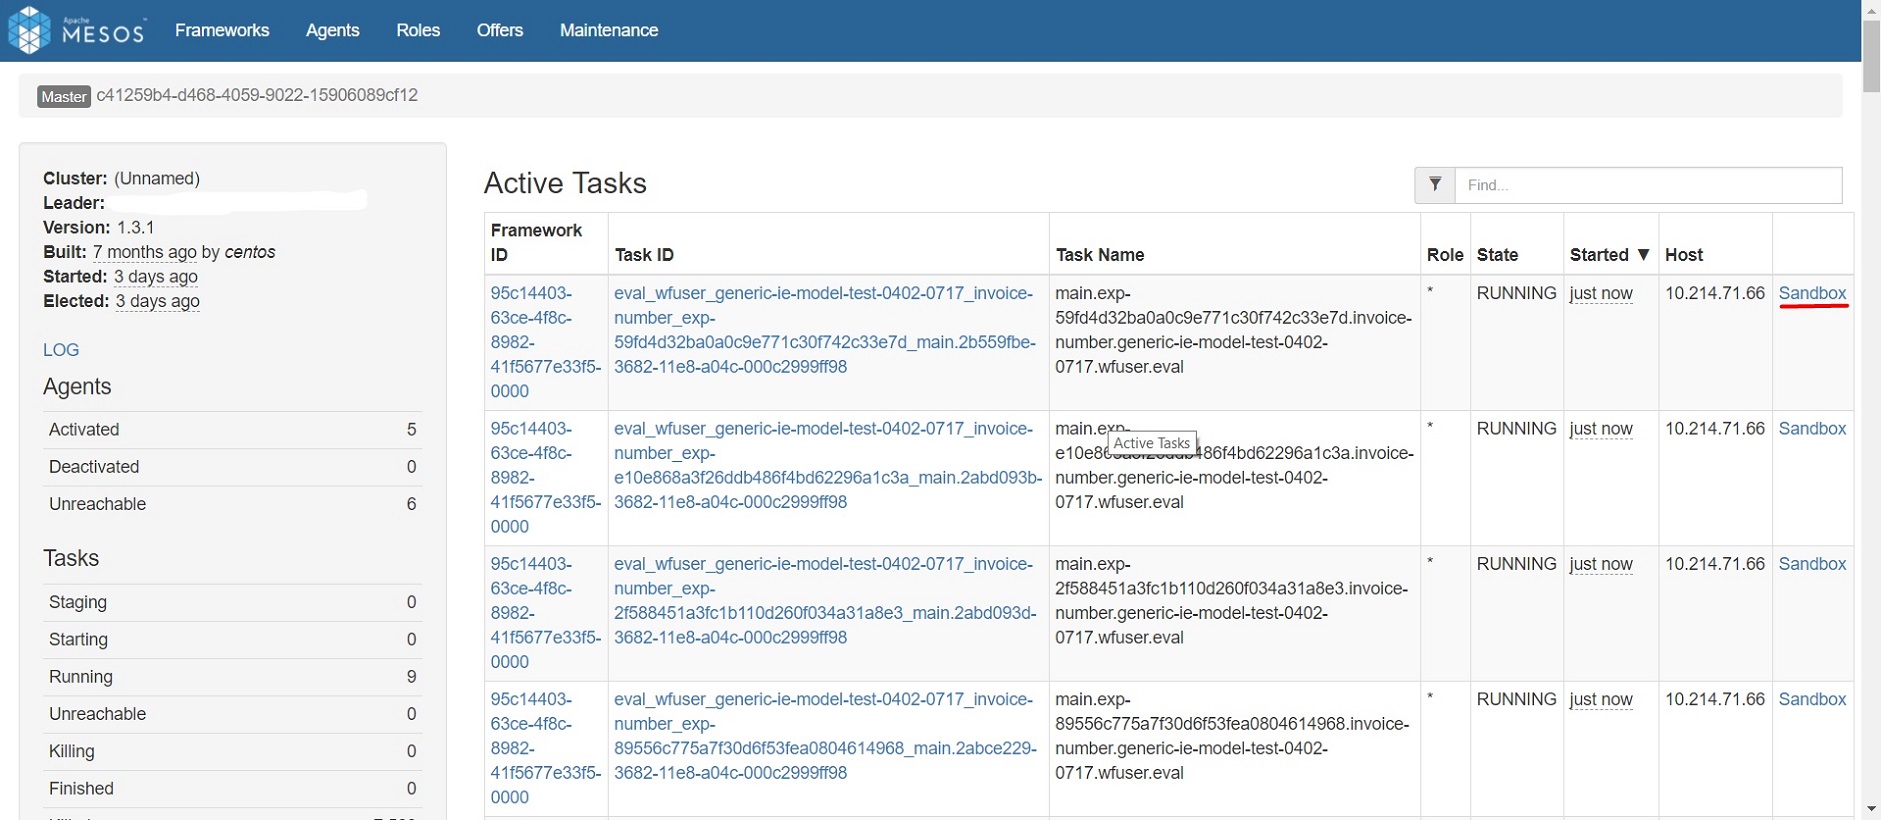
On the page that follows, open the stdout and stderr logs. If this is not helpful, submit a ticket requesting support for further investigation.
If the Completed tasks table contains tasks in the FAILED status, open the sandbox by clicking the Sandbox link in the table.
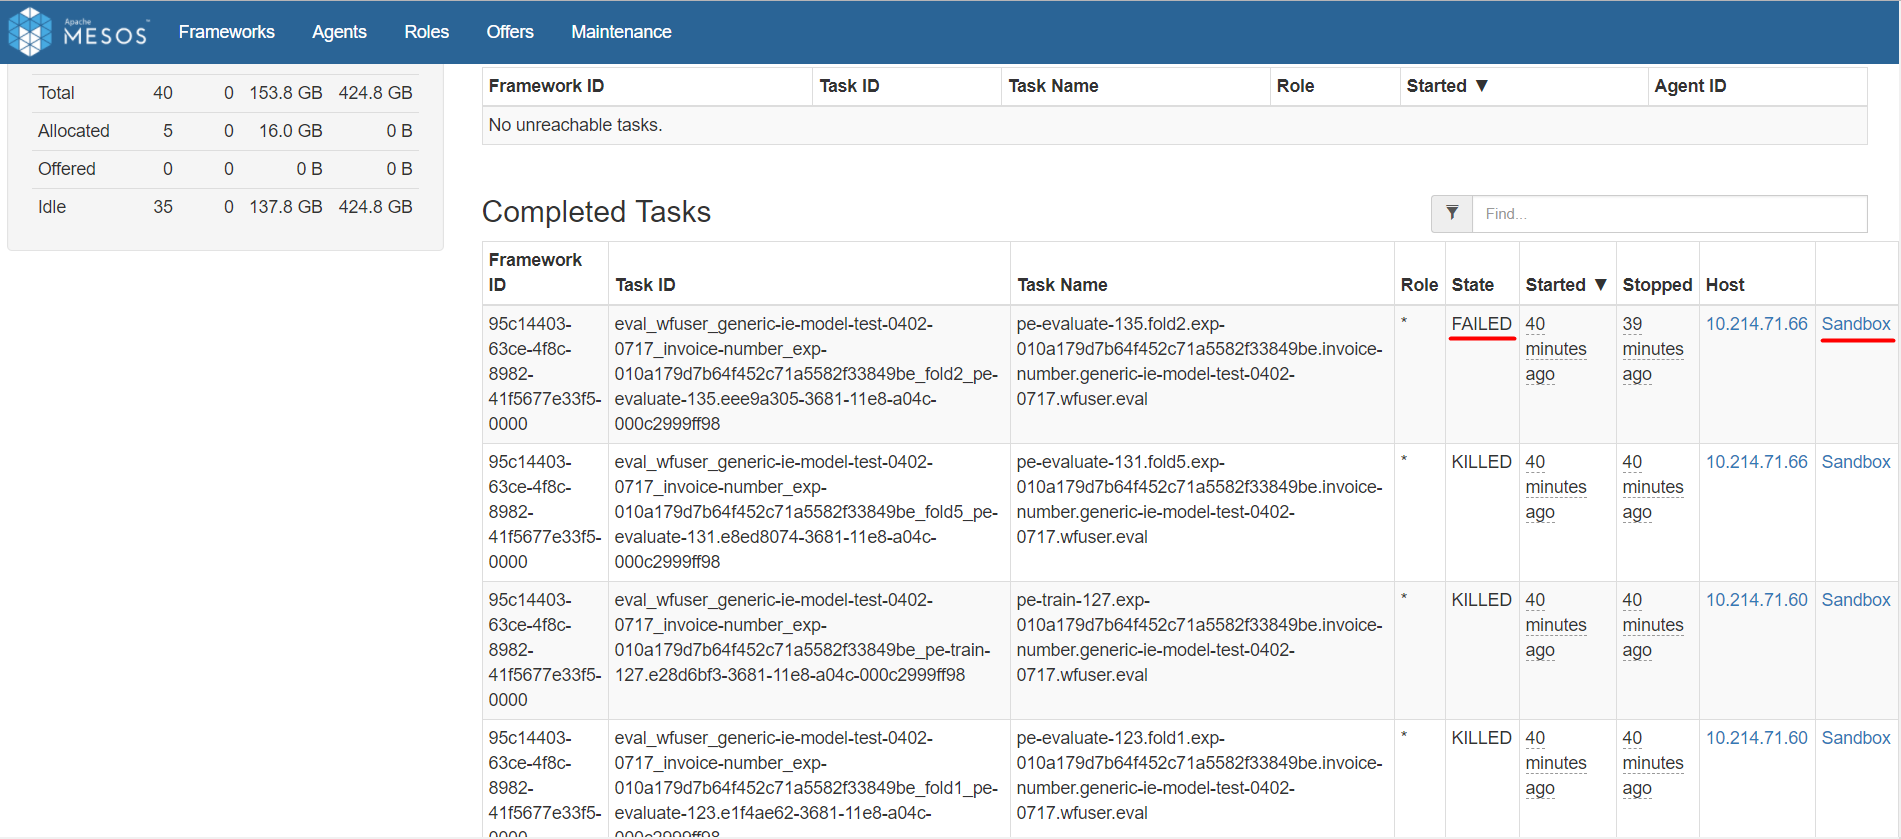
On the page that follows, stdout and stderr logs. open the stdout and stderr logs. If this is not helpful, submit a ticket requesting support for further investigation.
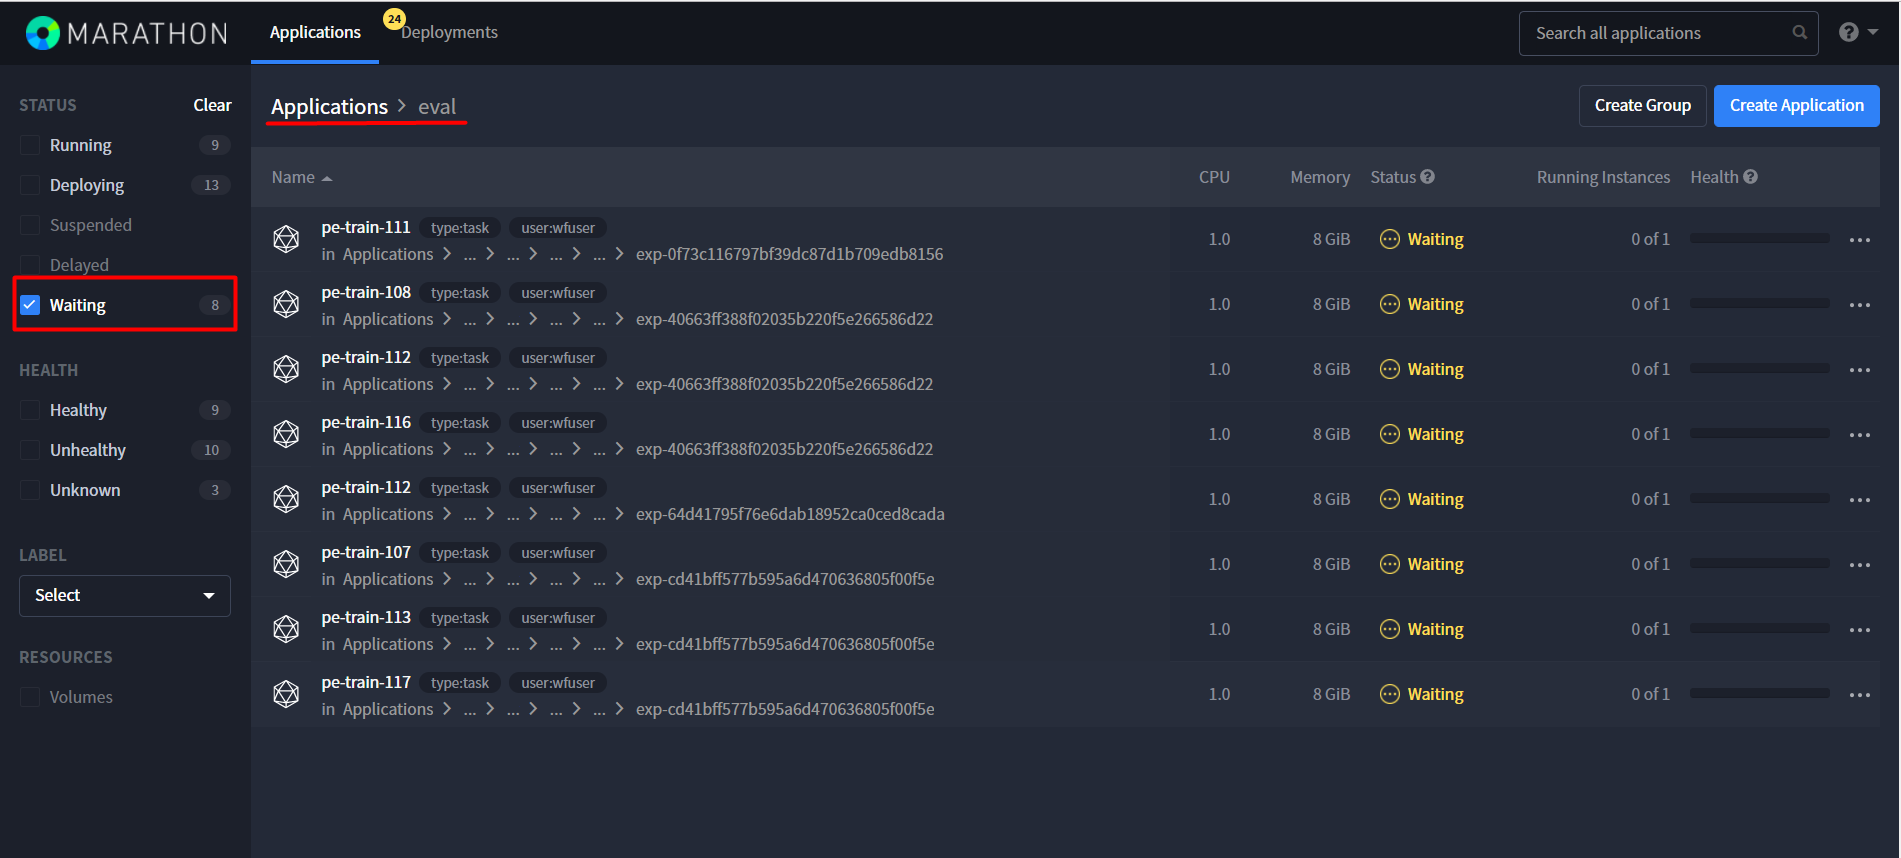
If there are applications in the WAITING status, open Mesos (default link :5050) and check Mesos for active tasks.
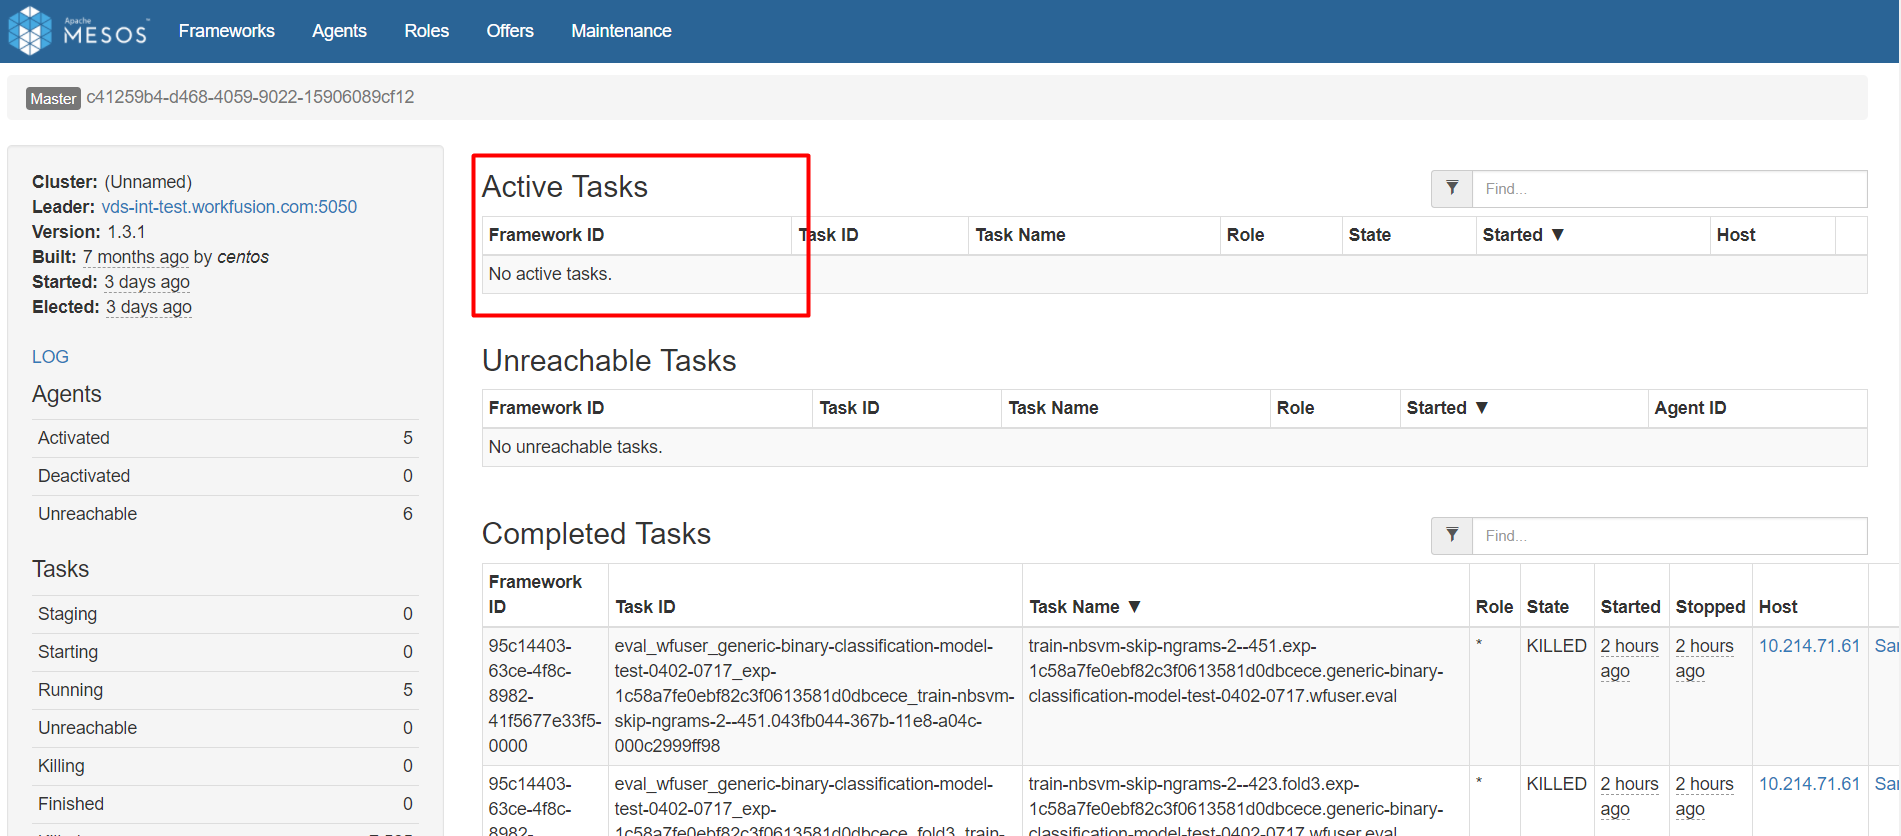
If the Active tasks table is empty, check available resources.
In the Resources table, the Total row displays all resources for jobs. If the values are less than 8 CPU and 32GB RAM, the root cause of the issue can be as follows: available resources are below the min recommended settings and should be increased.
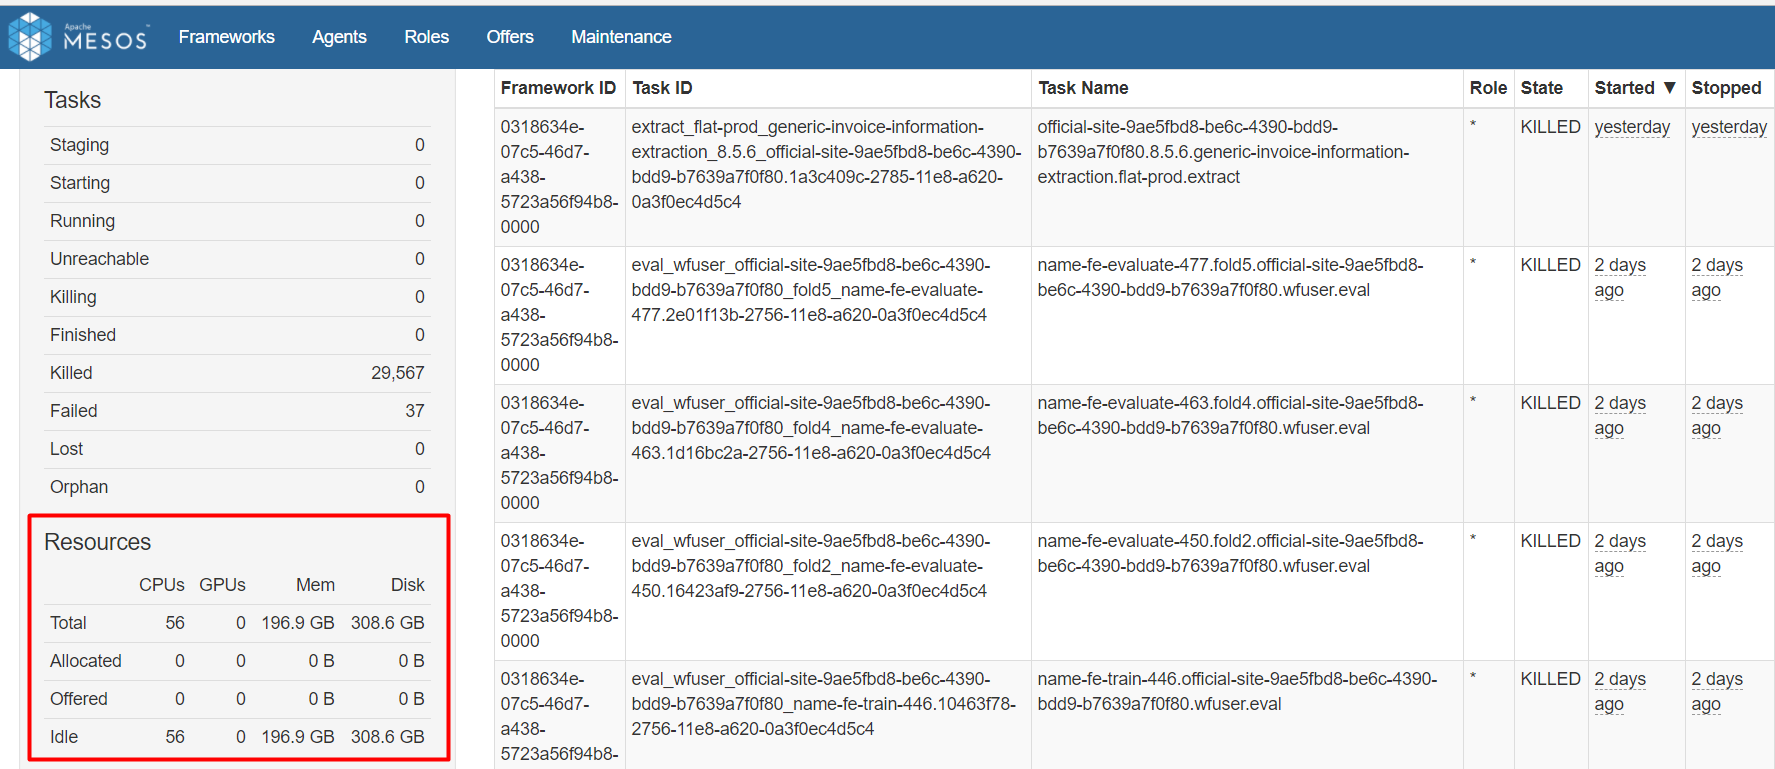
The Idle row displays available resources for jobs. If there are available resources, proceed as follows:
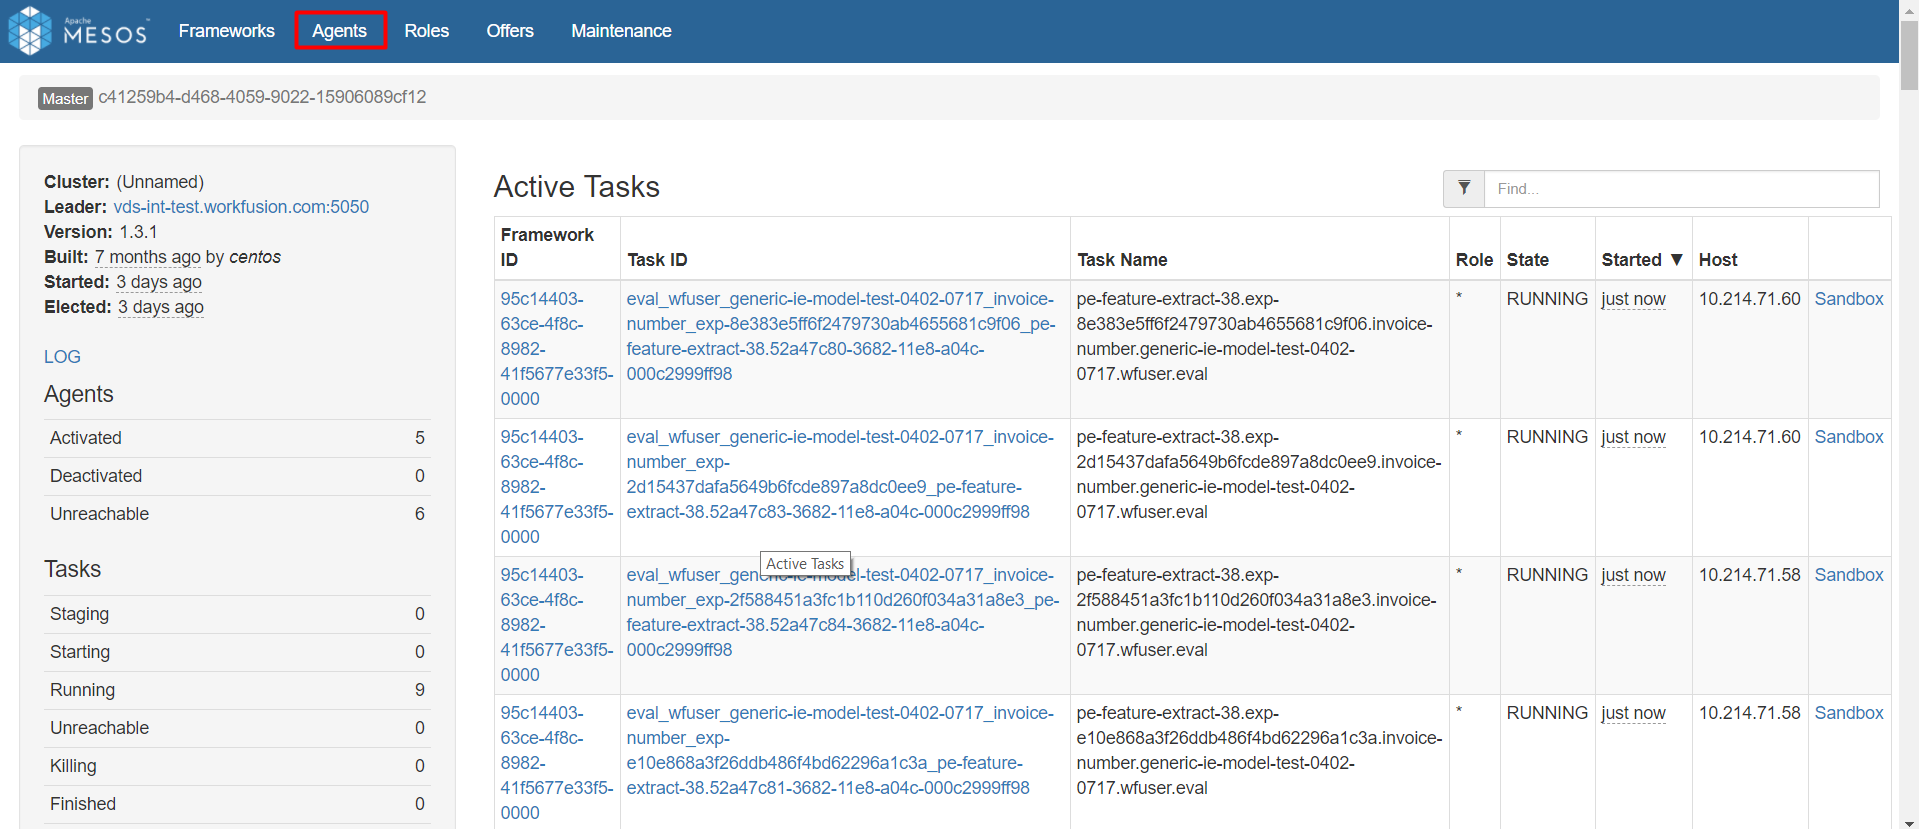
On the Agents tab.
Find the Registered column. The value in this column should be more than one minute.
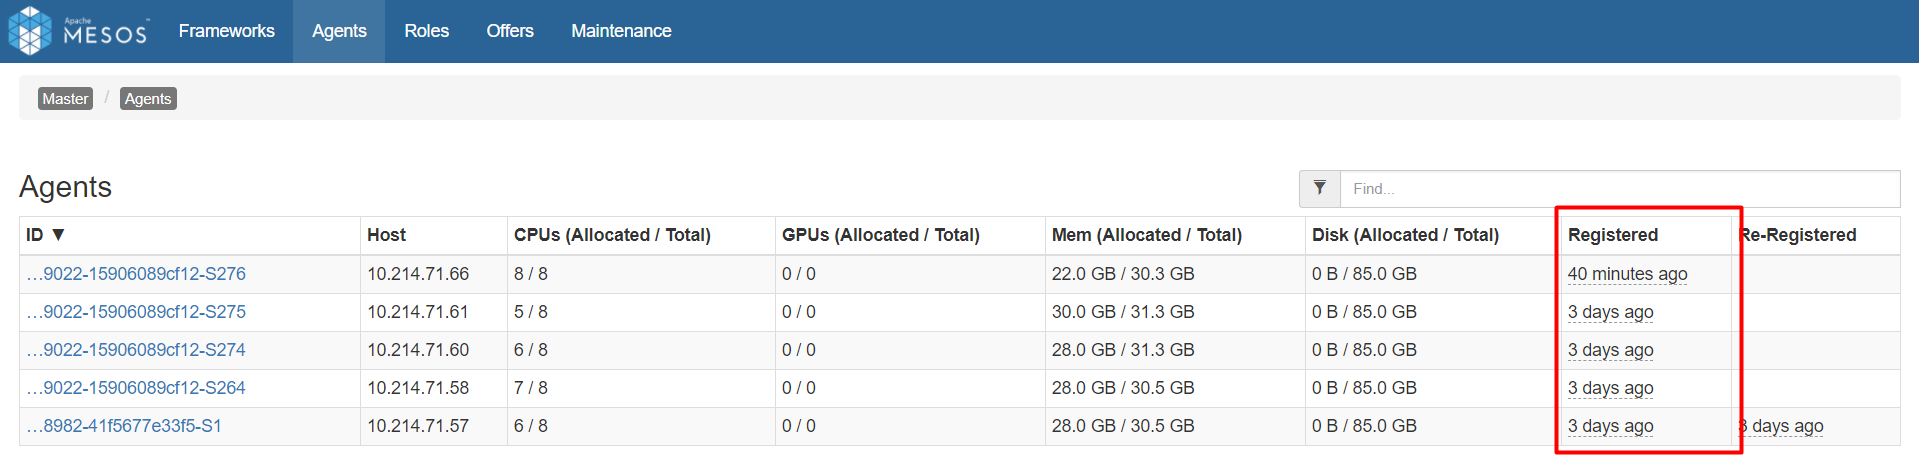
If the value is less, wait for some time. If the value does not grow, check port 5051 on the slave. If the port is unreacheble, check the network settings.
The Automation extract service unavailable error can be caused by many reasons. To investigate, follow the steps below:
Open Marathon. The default link is <ML_DNS>:8480.
Check the extract applications list.
If the extract application list is EMPTY, check the scaling service log. The path to the
vds-scaling-servicelog is/supervisord/log/vds-scaling-service.out.log. In the log, look for errors related to EGID.If there are no such errors in the
vds-scaling-servicelog, check thevds-gatewaylog. The path to thevds-gatewaylog is/supervisord/log/vds-gateway-service.out.log. In the log, look for any information related to EGID.If there is no such info in the
vds-gatewaylog, check Nginx logs. The paths to the Nginx logs are/supervisord/log/nginx.out.logand/supervisord/log/nginx.err.log. In the logs, look for requests from WF.If there are no such requests, check the connection to WF. Most likely WF can't connect to the VDS server. Y
If there is any such info in the
vds-gatewaylog, but those are not errors, proceed as below:To check queues, open RabbitMQ. The default link is :45672.
Go to the Queues tab and find the queue that contains EGID in its name. Try to filter queues by EGID.
If the table is empty, restart the scaling service. Most likely, vds-scaling-service is down or does not respond. To restart, execute the following command:
wfmanager restart scaling-service.If the table is not empty, check consumers. Open the queue and review the Consumers table.
If there are no consumers, but the queue has messages, open Mesos (default link <ML_DNS>:5050) and check active tasks.
If the Active tasks table is not empty, delete the task containing EGID in Mesos and wait for five minutes.
If there are any errors related to EGID, analyze them. If this is not helpful, submit a ticket requesting support for further investigation.
If there are applications in the RUNNING status, open Mesos (default link <ML_DNS>:5050) and check active and completed tasks.
If the Active tasks table is not empty, check the lifetime of active tasks. By default, the Active tasks table is sorted by the Started time.
Find the first task where Task Name is not starting with hpo-main or main.
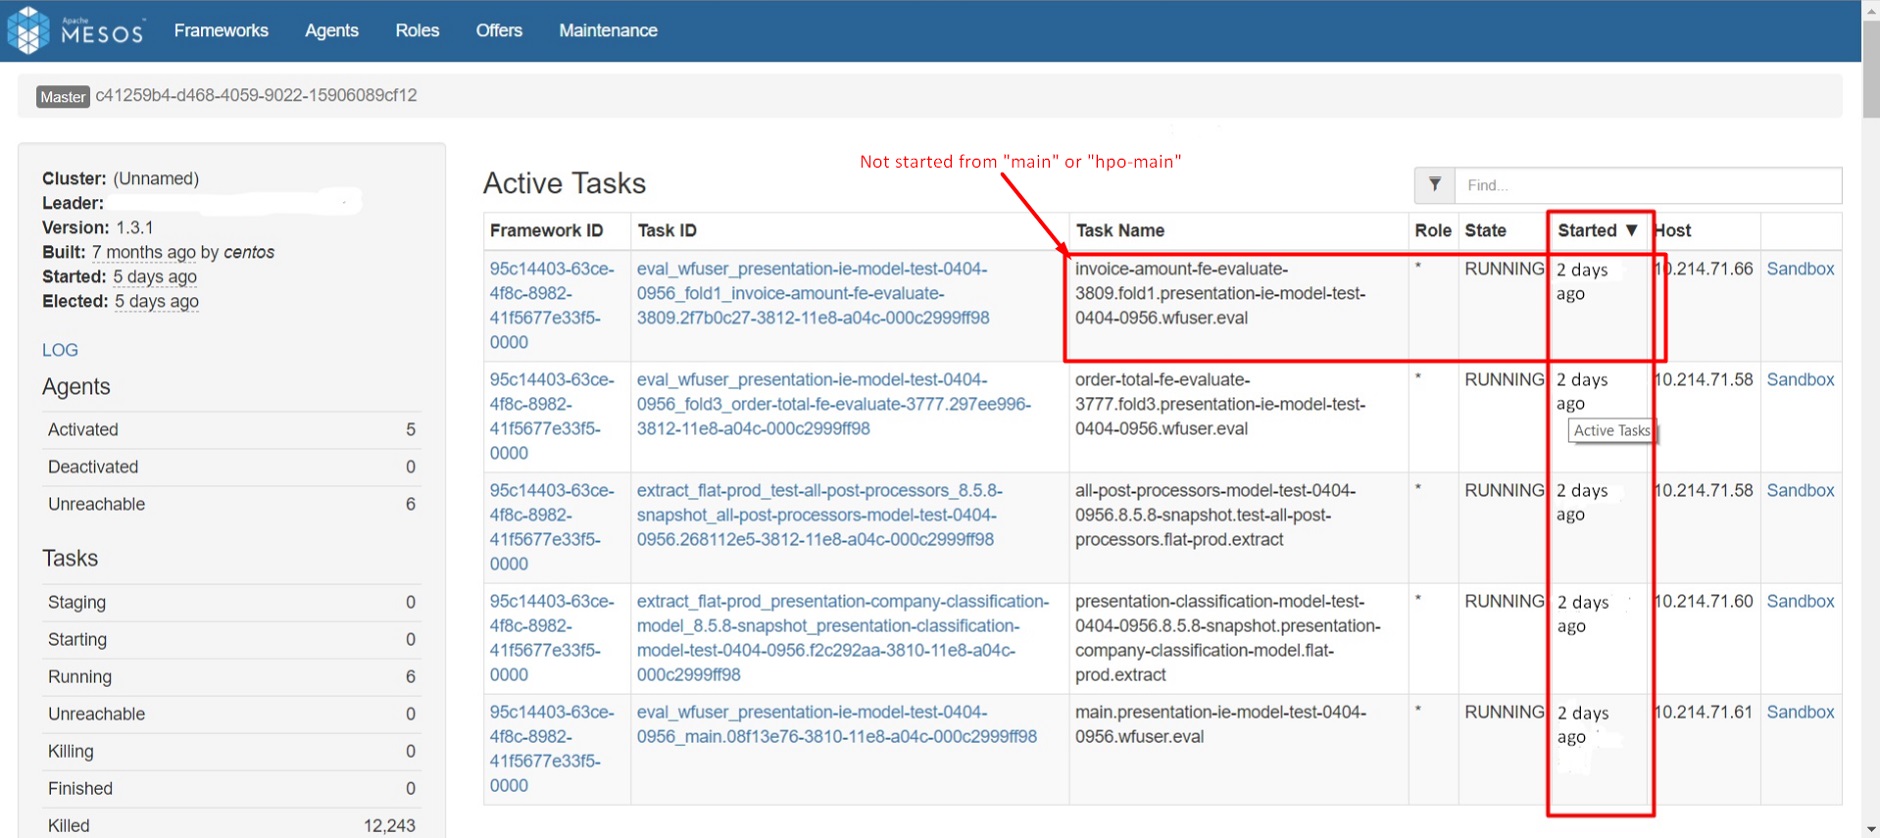
If this task has a lifetime of more than 12 hours, copy Task ID (for instance, extract_flat-prod_presentation-information-extraction_8.5.5.1_message-177a8e47-272b-4150-943a-52482dfdf21c.f8e88885-3263-11e8-ab34-fa163e1fc8a8).
Open Marathon (default link <ML_DNS>:8480). From Task ID, you can get the path to the application. You need the Task ID part before the dot. For example, extract_flat-prod_presentation-information-extraction_8.5.5.1_message-177a8e47-272b-4150-943a-52482dfdf21c.f8e88885-3263-11e8-ab34-fa163e1fc8a8.
Replace the _ character with /. For example,extract_flat-prod_presentation-information-extraction_8.5.5.1_message-177a8e47-272b-4150-943a-52482dfdf21c gives the following path: extract/flat-prod/presentation-information-extraction/8.5.5.1/message-177a8e47-272b-4150-943a-52482dfdf21c. The last part of the path is the application name, for instance, message-177a8e47-272b-4150-943a-52482dfdf21c.
In this folder, for instance, extract/flat-prod/presentation-information-extraction/8.5.5.1, click the application name.
On the page that follows, click the link under the application ID to open the actuator.
Download the dump and analyze it or attach it to a ticket for further investigation.
If the task has a lifetime of less than 12 hours, click the Sandbox link in the Active tasks table to open the sandbox.
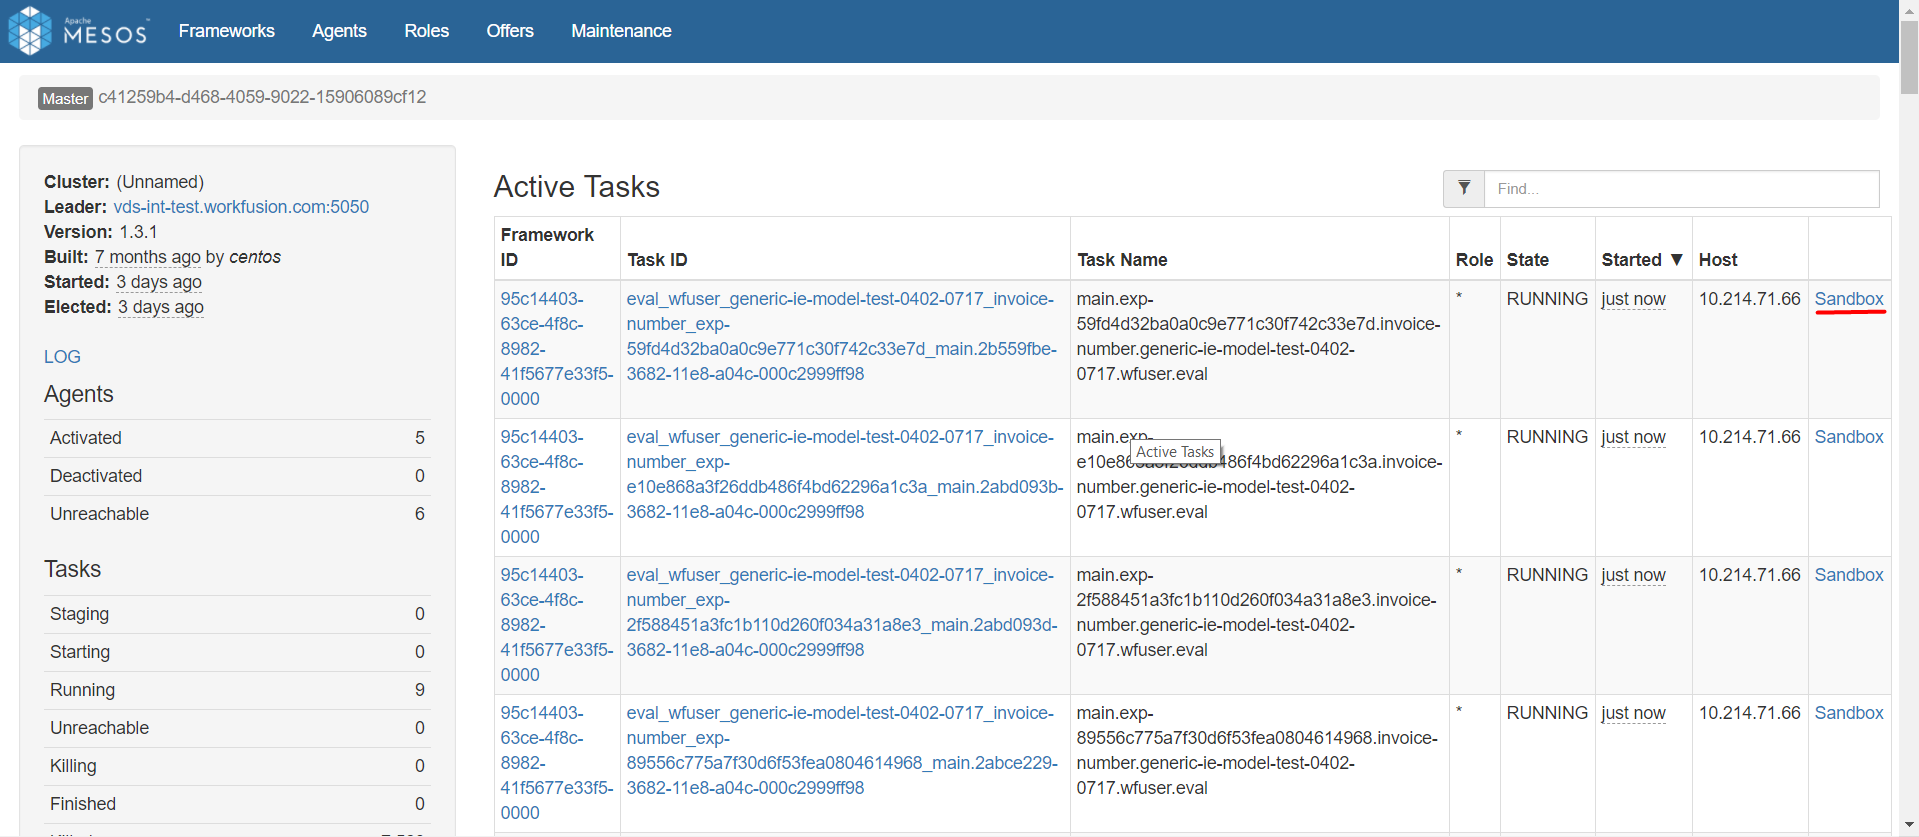
On the page that follows, open the stdout and stderrlogs.
If there are errors in thes files, analyze them. If this is not helpful, submit a ticket requesting support for further investigation.
If the Completed tasks table contains tasks in the FAILED status, click the Sandbox link in the table to open the sandbox.
On the page that follows, open the stdout and stderrlogs.
If there are errors in thes files, analyze them. If this is not helpful, submit a ticket requesting support for further investigation.
If there are applications in the WAITING status, proceed as follows:
Open Mesos (default link <ML_DNS>:5050) and check active tasks.
If the Active tasks table is empty, check available resources in the Resources table.
The Total row displays all resources for jobs. If the values are less than 8 CPU and 32GB RAM, the root cause of the issue can be as follows: available resources are below the min recommended settings and should be increased.
The Idle row displays available resources for jobs. If there are available resources, proceed as follows:
Open the Agents tab.
Find the Registered column. The value in this column should be more than one minute.
If less, then wait for some times. If this value does not grow, check port 5051 on the slave. If this port is not available, check the network settings.