Create and manage data pipelines
The Spark Pipelines capability is part of the Work.AI Analytics component and is used for defining, saving, and executing data pipelines. Using the pipelines, you can process large quantities of transaction data for the following purposes:
- Identify patterns
- Compare activity over time
- Detect anomalies
- Generate meaningful analytics insights
The Spark cluster is installed automatically with the ML Ops platform. However, to make the Spark Pipelines capability available in Control Tower, you need to enable Spark as described below.
Enable Spark in installation files
By default, the Spark Pipelines capability is disabled in Control Tower, and no spark-ui bucket is created in S3 to host Spark assets. To enable the Spark pipeline and create a spark-ui bucket, follow the steps below:
Go to
cd /opt/workfusion/wf_installer.Open
config_override.ymland set thespark_ui_enableparameter totrue. The parameter field is already present inconfig_override.yml, so you only need to change its value.Save the changes and close the file.
Run the following command:
./install.sh update init-properties -e @config_overrides.yml -e init_properties=control-towerTo create a
spark-uibucket in S3, run the following command:./install.sh configure init-s3 -e @config_overrides.ymlRun
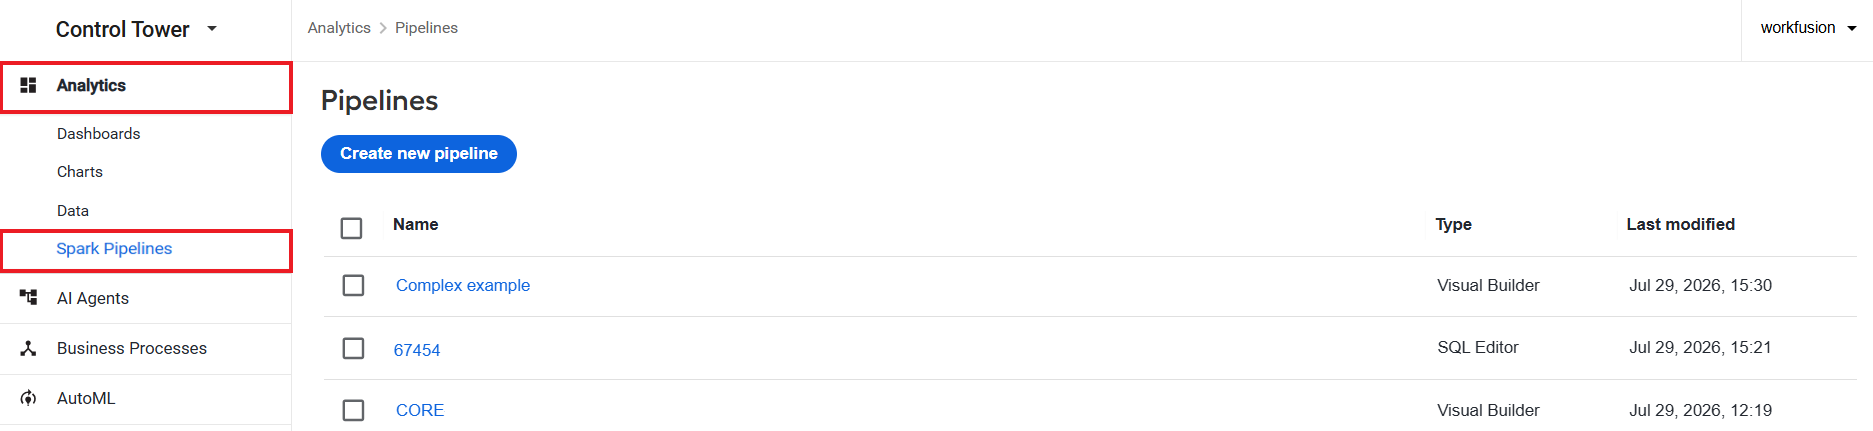
wfmanager restart workfusion.In Control Tower, check that the Spark Pipelines option is visible under the Analytics menu.
Set permissions
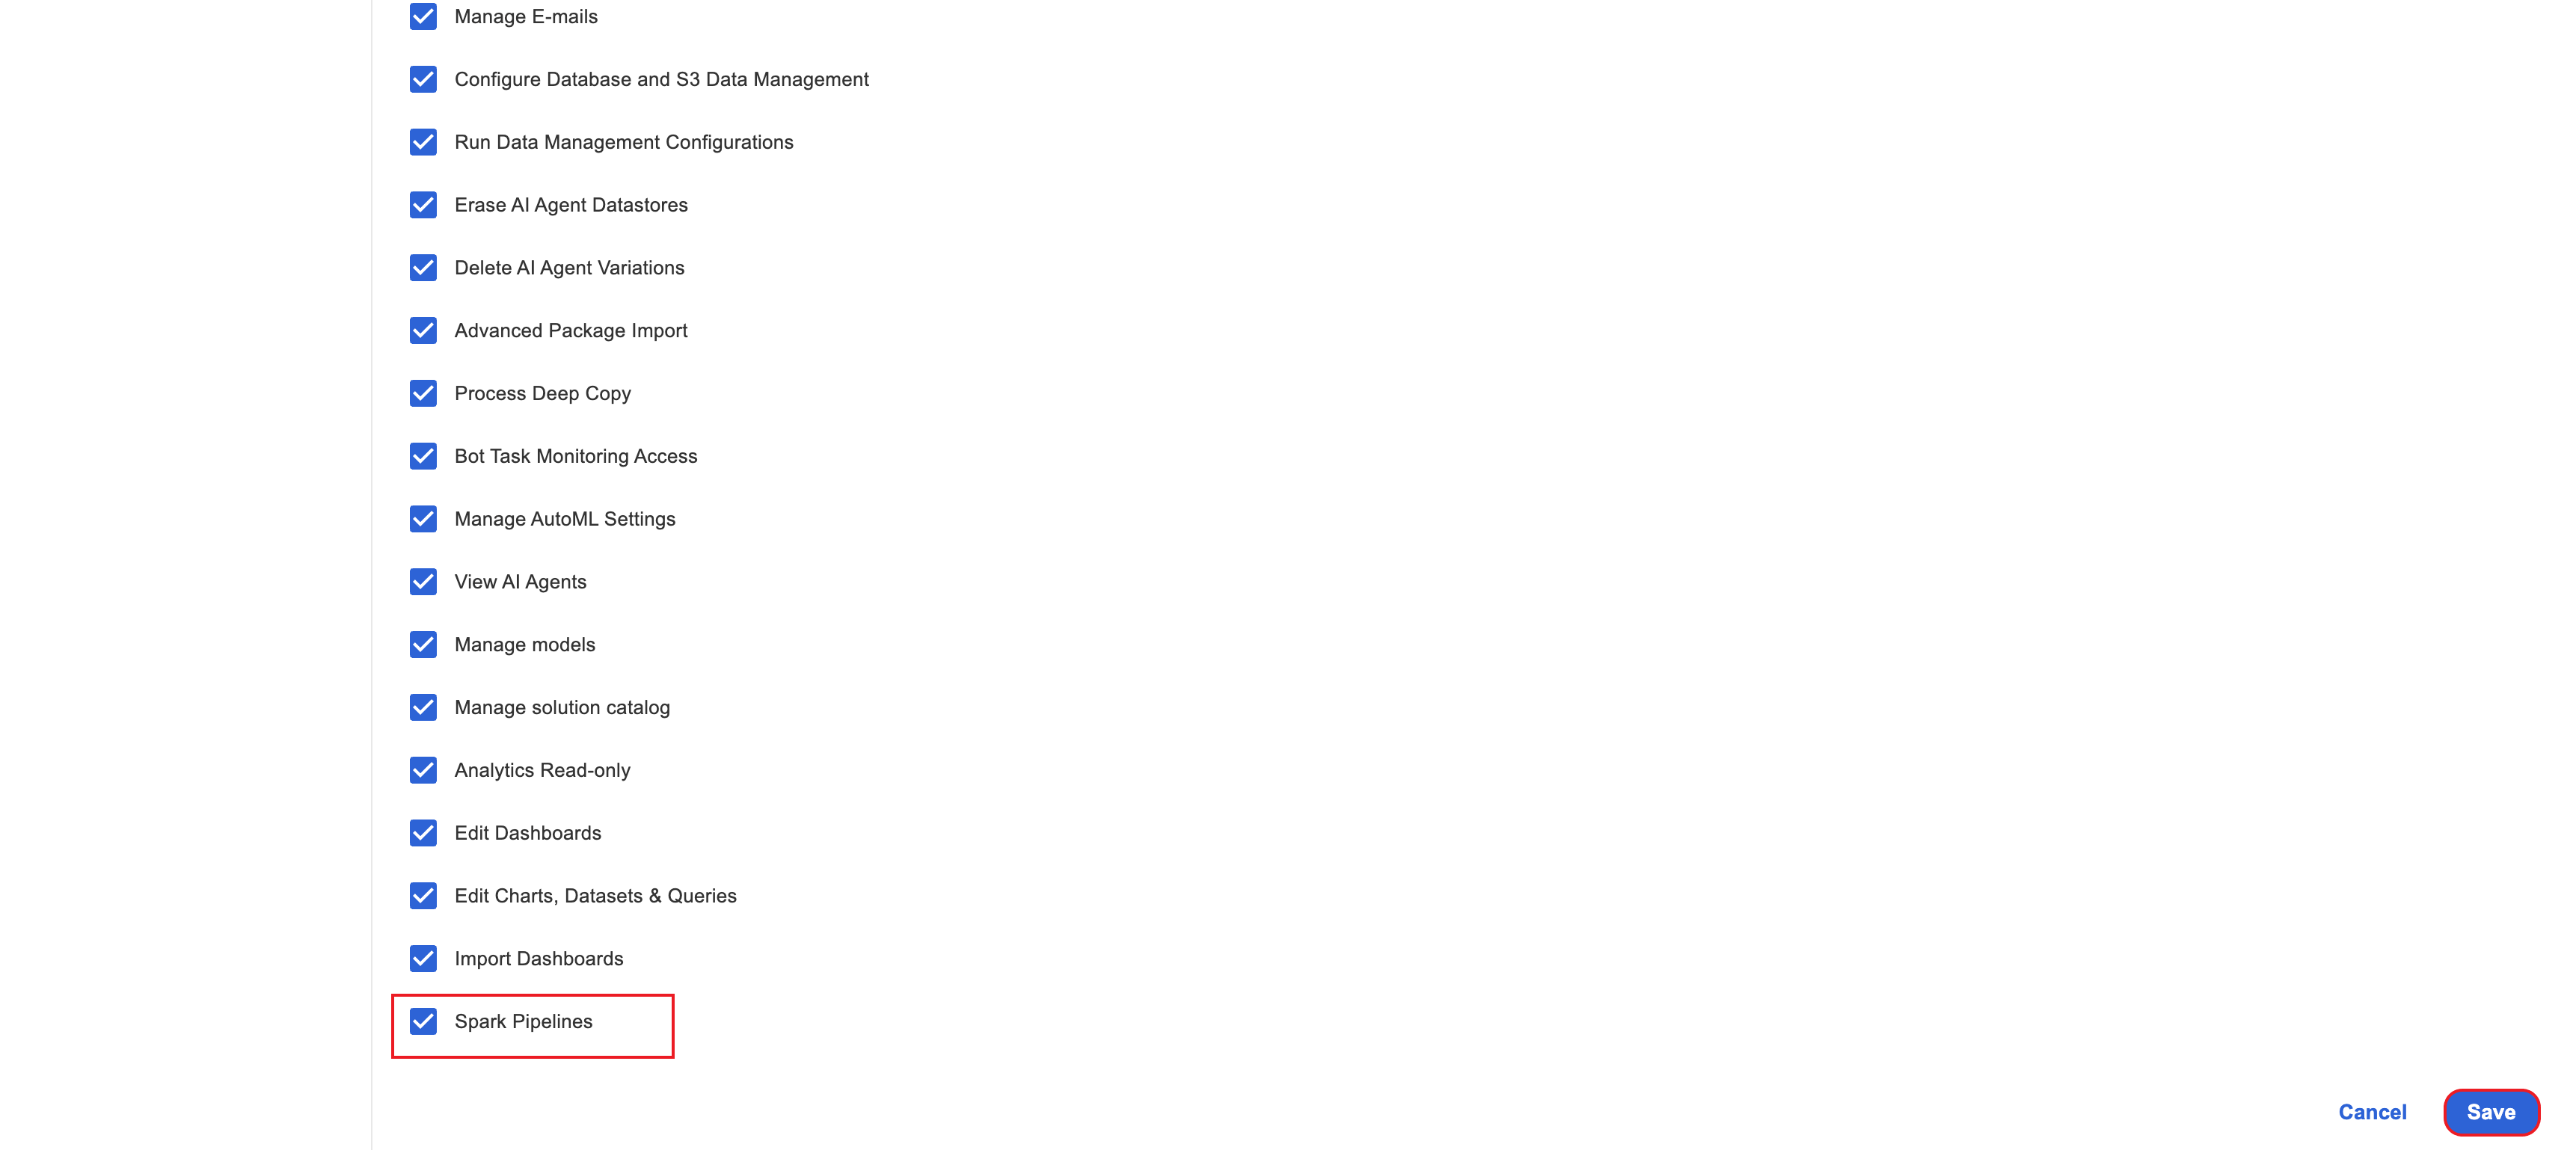
For the Spark Pipelines feature to be available in the Control Tower user interface, you need to have the Spark Pipelines permission. By default, the permission is enabled for the Administrator and Developer roles.
To enable the permission for any other roles, go to System settings > Role Management, click the role, and select the Spark Pipelines option. Then, click Save to save the changes.
Access pipelines
To access the capability, log into Control Tower, select Analytics > Spark Pipelines. The Spark Pipelines page displays a list of existing data pipelines (if any), each accompanied by the following details:
User-defined name
Creation method: SQL Editor or Visual Builder
Last modification date
If you don't see the Spark Pipelines option in the Control Tower menu or the page is unavailable, check if you enabled Spark in installation files and have appropriate access permissions.
Create data pipeline
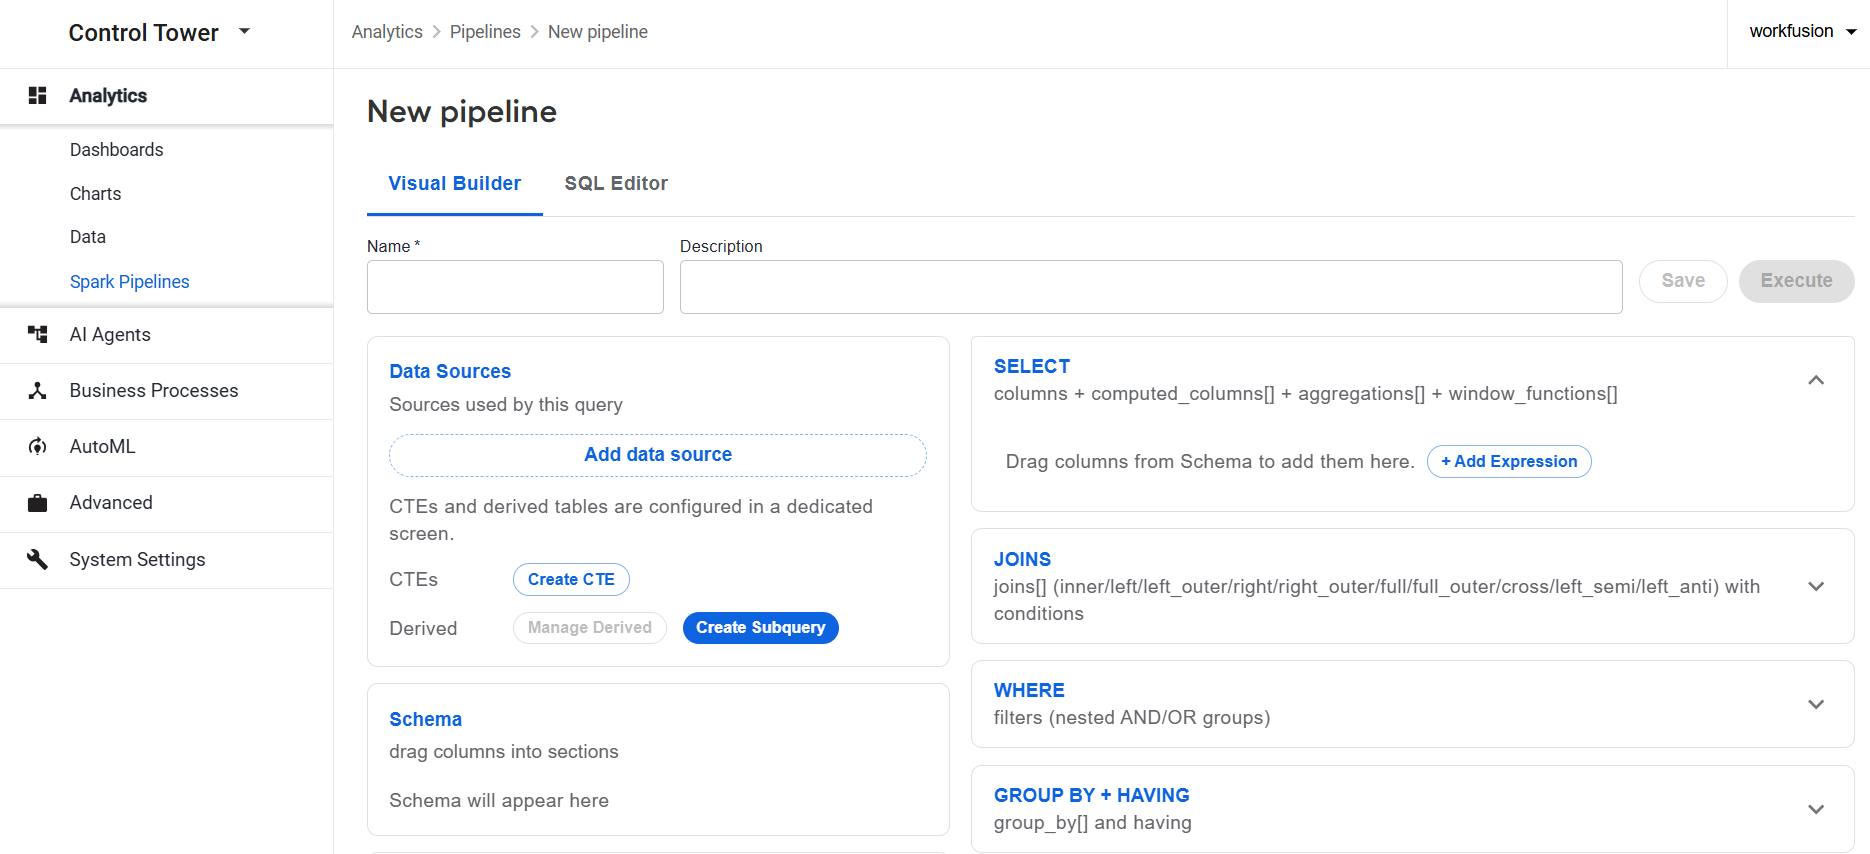
To create a data pipeline, click Create new pipeline on the Spark Pipelines page. On the New pipeline page, continue in one of the following ways:
Use Visual Builder for drag-and-drop pipeline setup.
Switch to SQL Editor to write an SQL script for implementing a pipeline.
Create in Visual Builder
To create a data pipeline in Visual Builder, work on the Visual Builder tab:
In the Name field, add a user-friendly name for the pipeline. The name will be displayed in the Name column on the Spark Pipelines page.

Configure a data source.
Create an SQL query to work with the data source by setting the following operations as appropriate:
Save the created pipeline and review the resulting query.
Configure data source
To configure a storage for sourcing data for the created pipeline, follow the steps below:
In the Data Sources panel, click Add data source.
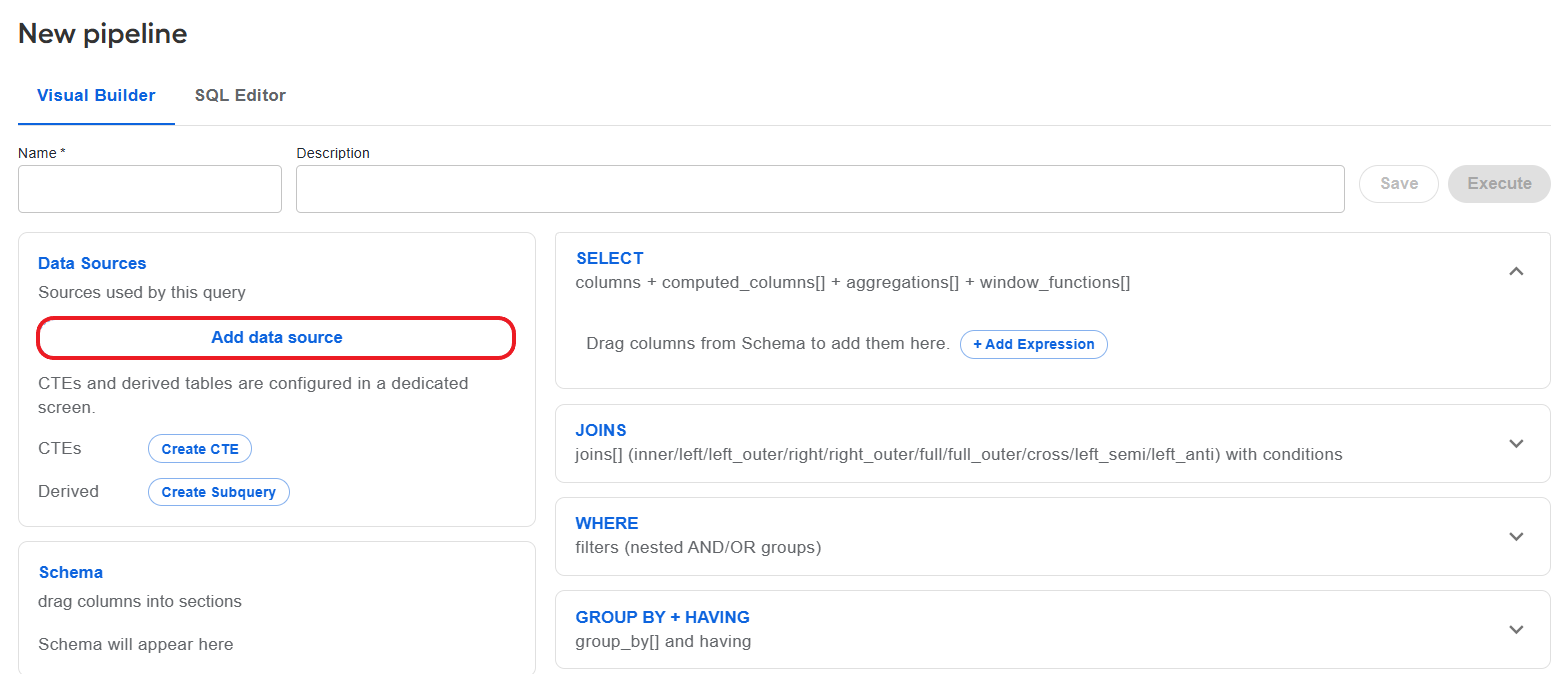
On the Add data source screen, in the Name field, specify a label for the created data source so that you can later find and reuse it easily.
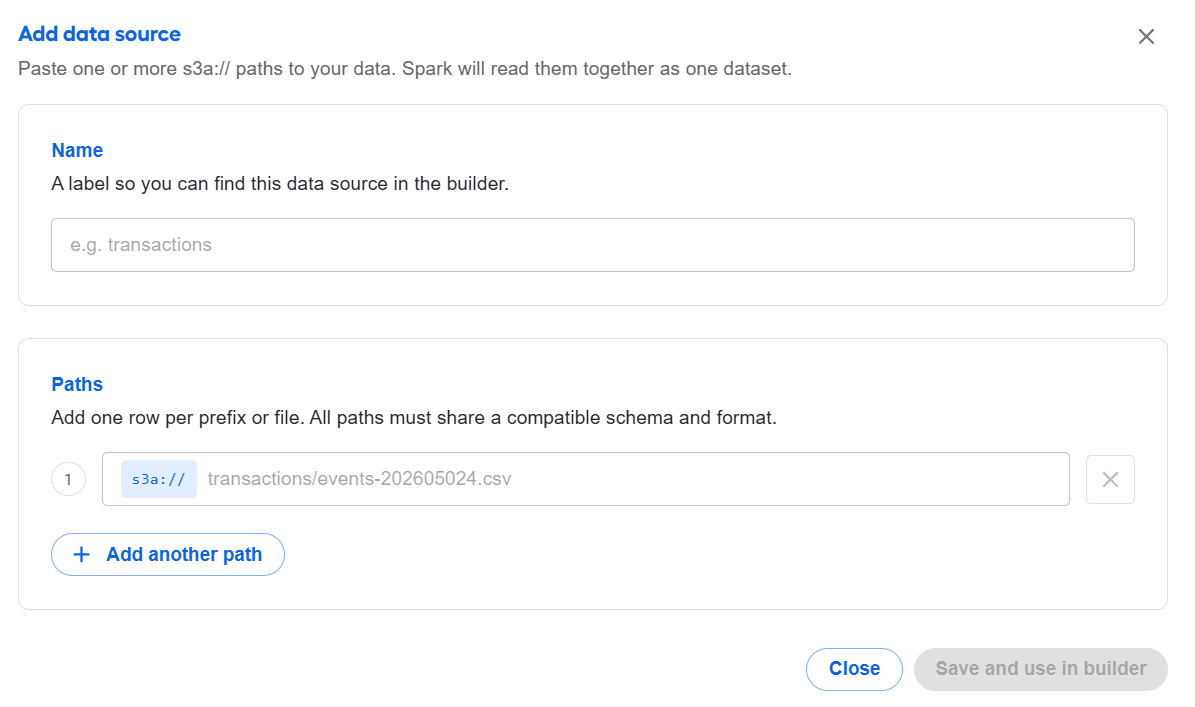
In the Paths section, add one or more paths pointing to the source files in a storage. If you add more than one path, they will be read as a single dataset. Supported paths are
s3a://ands3//.The files you specify in the fields when configuring the source must already be available at the storage path. Supported file formats are as follows:
- Parquet
- JSON
- CSV
- Avro
- ORC
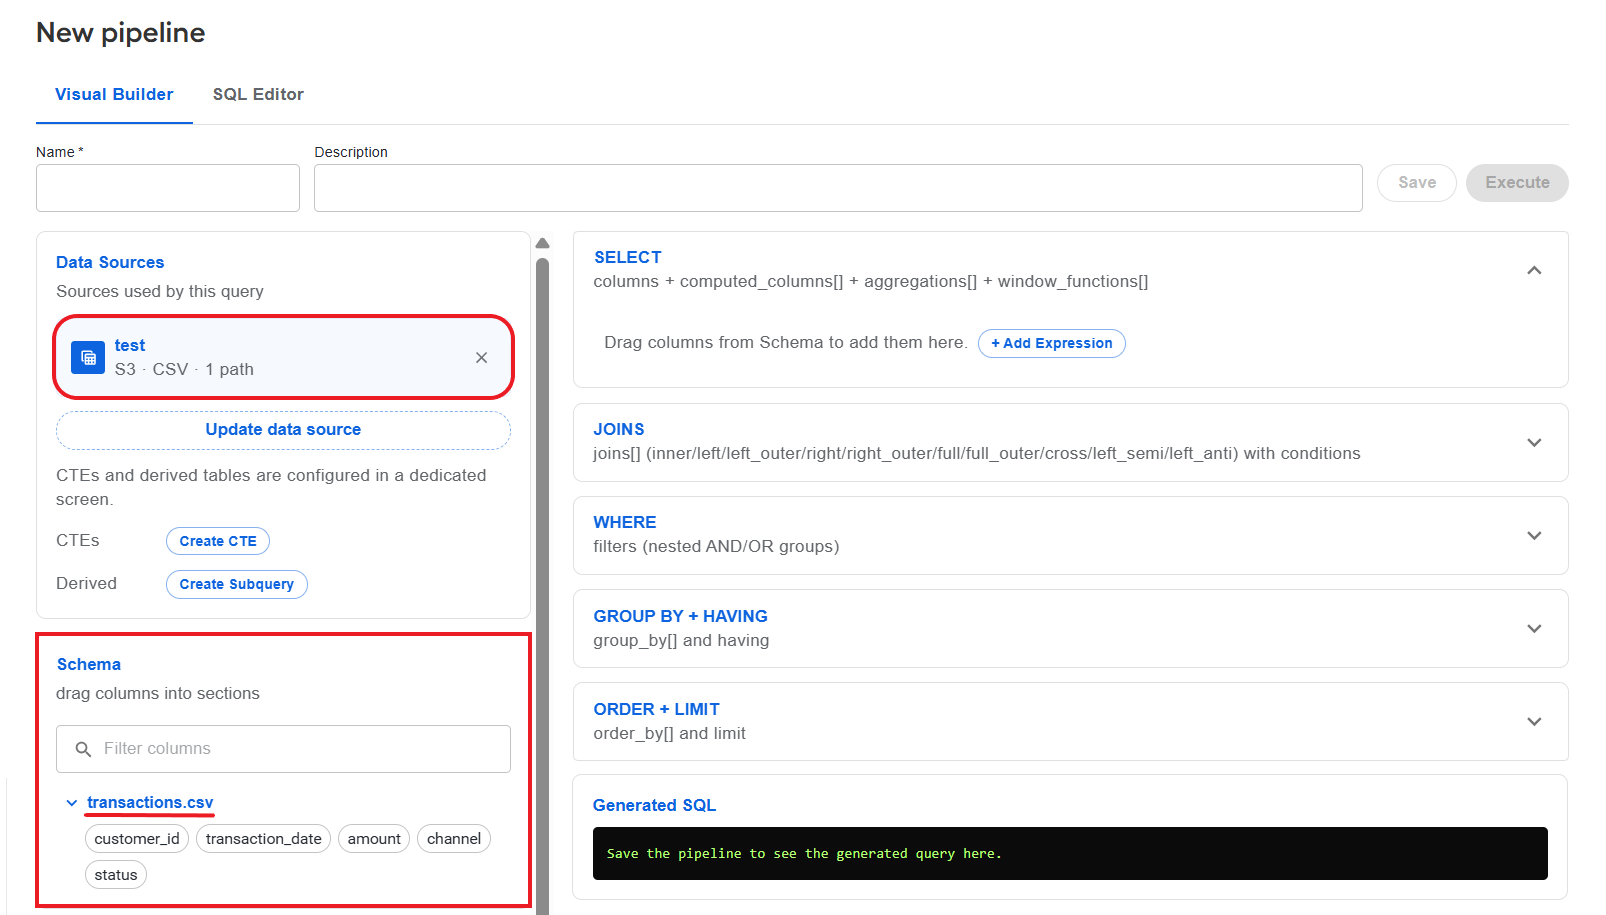
Click Save and use in builder. After a data source is added successfully, it appears in the Data Sources panel on the Visual Builder tab. The Add data source button changes to Update data source.
The Schema panel displays columns from the added data source. If there is more than one file associated with the data source, the columns from each of them are displayed in a separate collapsible section with the name identical to that of the file.
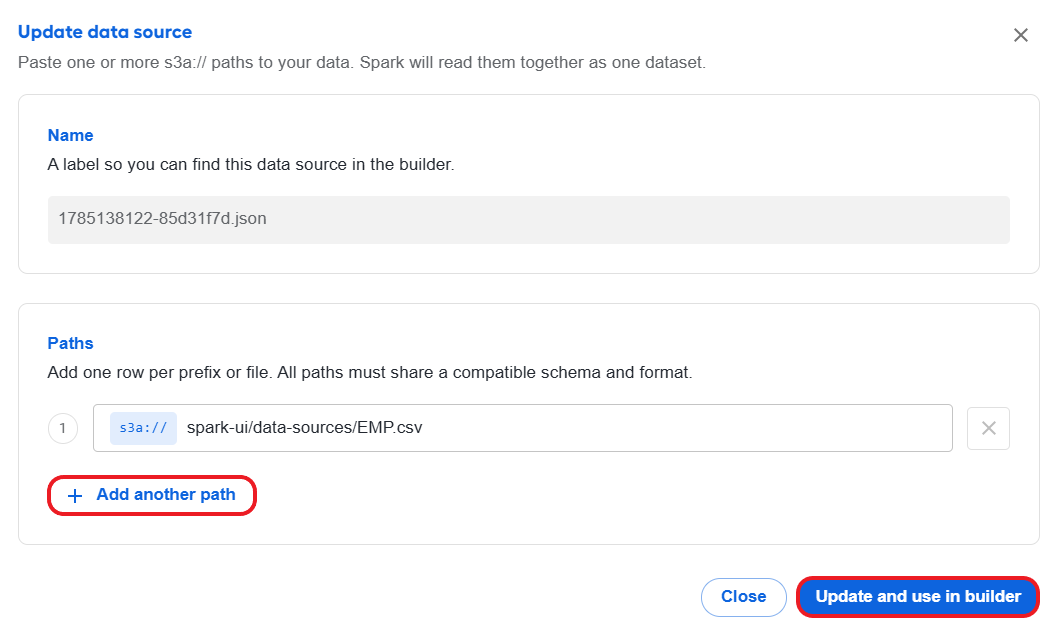
Clicking the Update data source button brings you to the Update data source popup where you can add more paths to the data source or remove those. Once you have made all necessary changes to the data source, click Update and use in builder. You will see the new data points from the updated source in the Schema panel.
Create SQL query
To create an SQL query, set the required SQL operations as described below.
Mind that in the GROUP BY, HAVING, ORDER BY, or WHERE operations computed-column aliases and aggregation aliases are not supported. Use source columns or send the full expression or aggregate AST instead. If an alias is used in those operations, the API returns a validation error.
SELECT
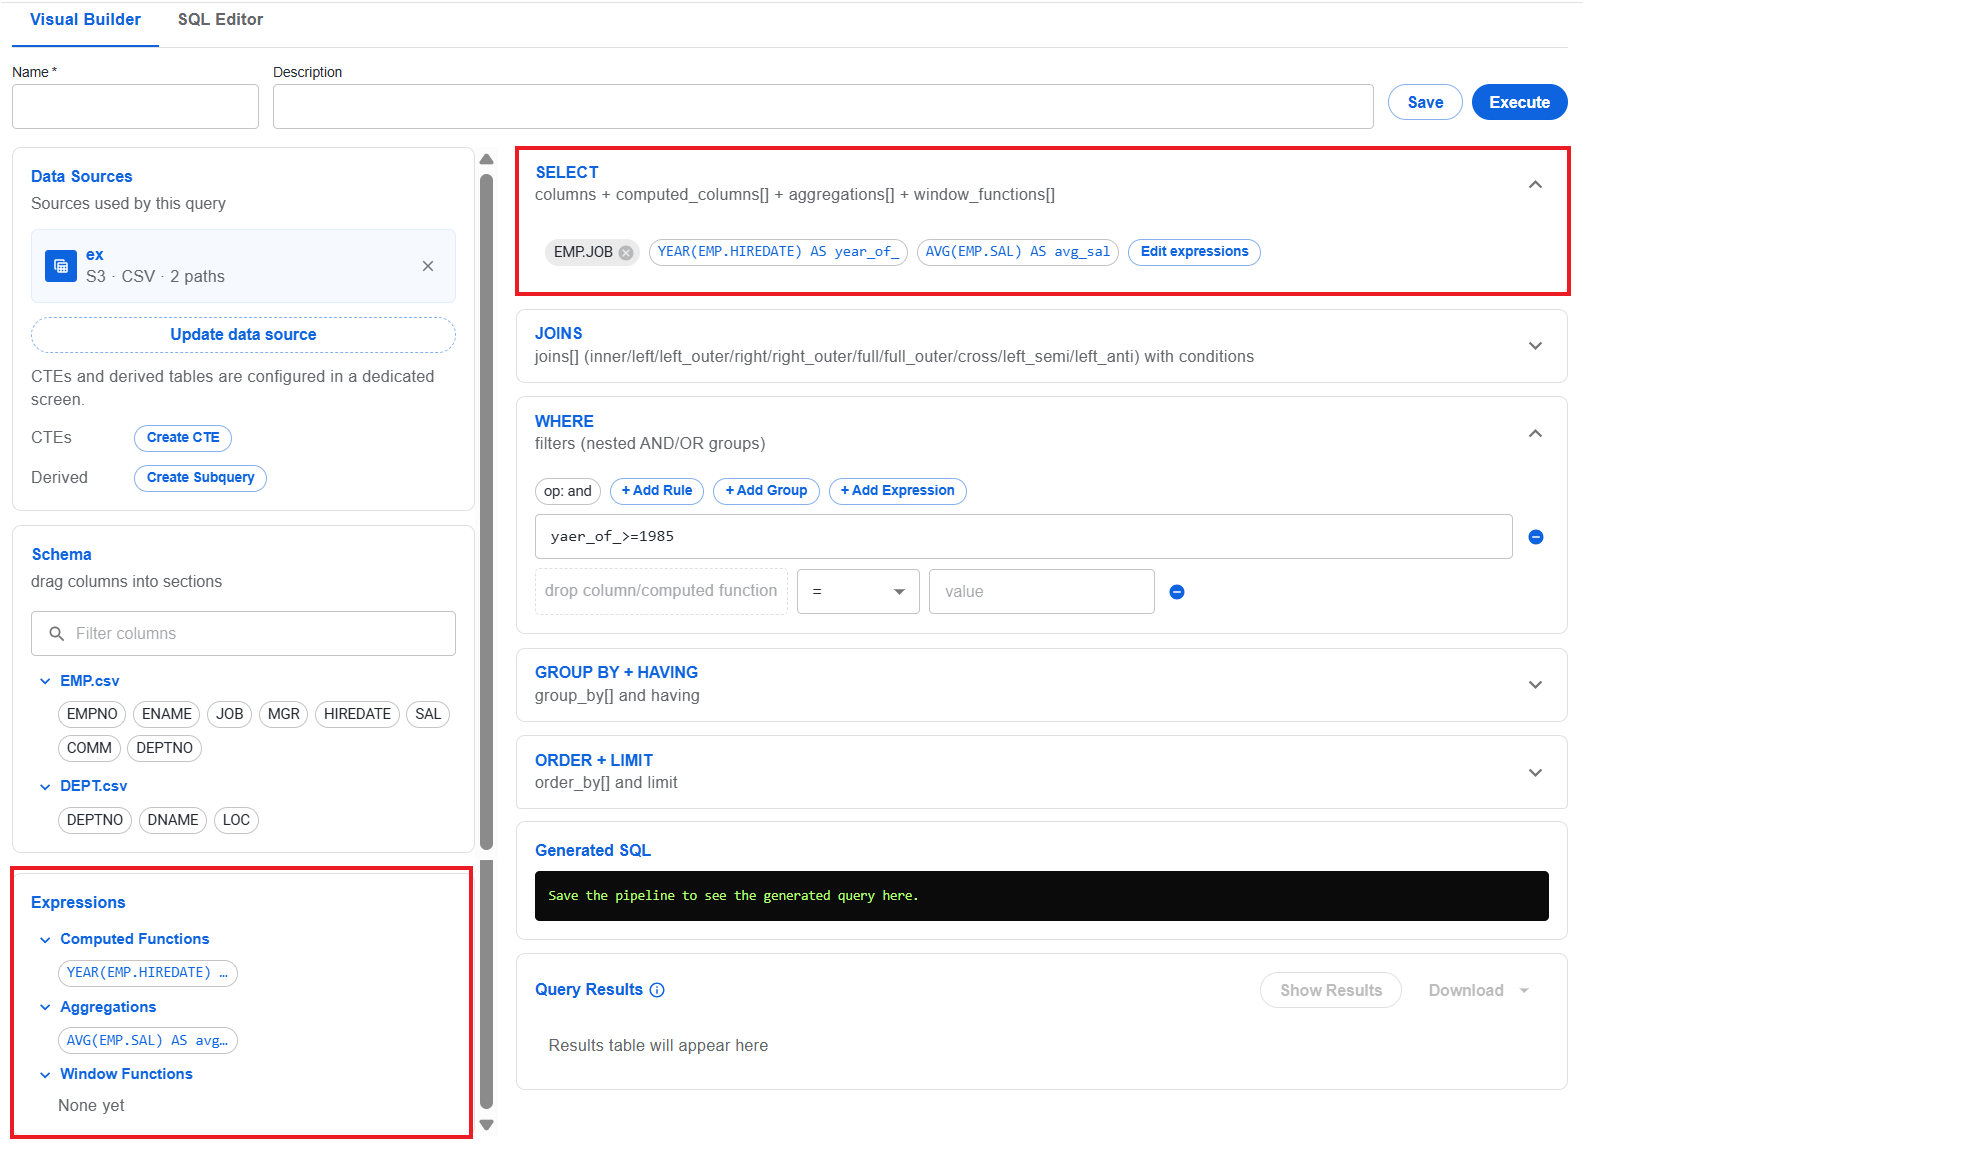
In the SELECT panel, you can set the SELECT SQL operation. To do that, drag and drop the data columns from the Schema panel and define the following expressions:
- Computed Column
- Aggregate
- Window Function
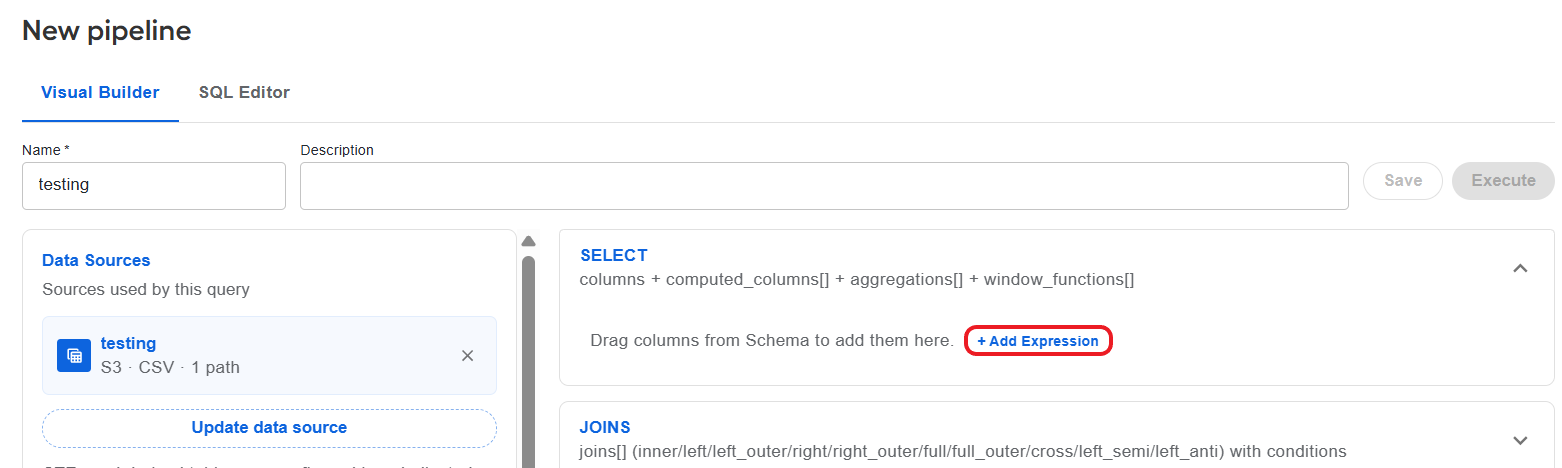
To define the expressions, click Add Expression and proceed as described below.
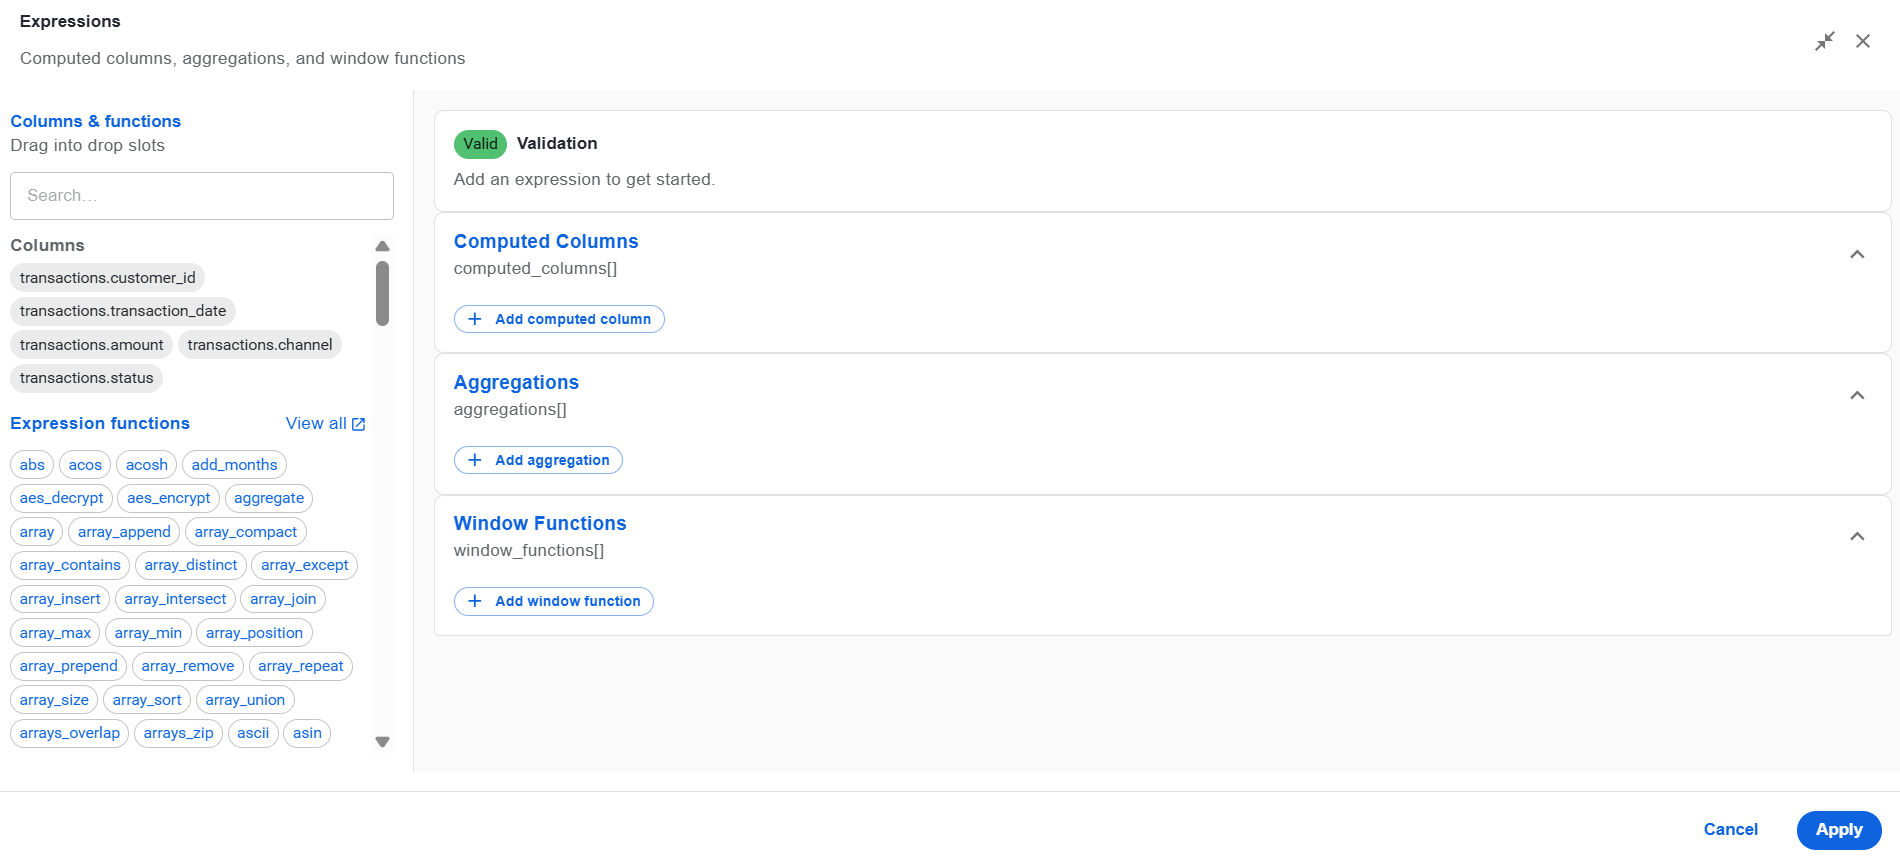
On the right panel of the Expressions screen, you can see the columns from the data source and functions available for defining the SELECT operation expressions. Clicking View all opens a list of built-in Spark functions.
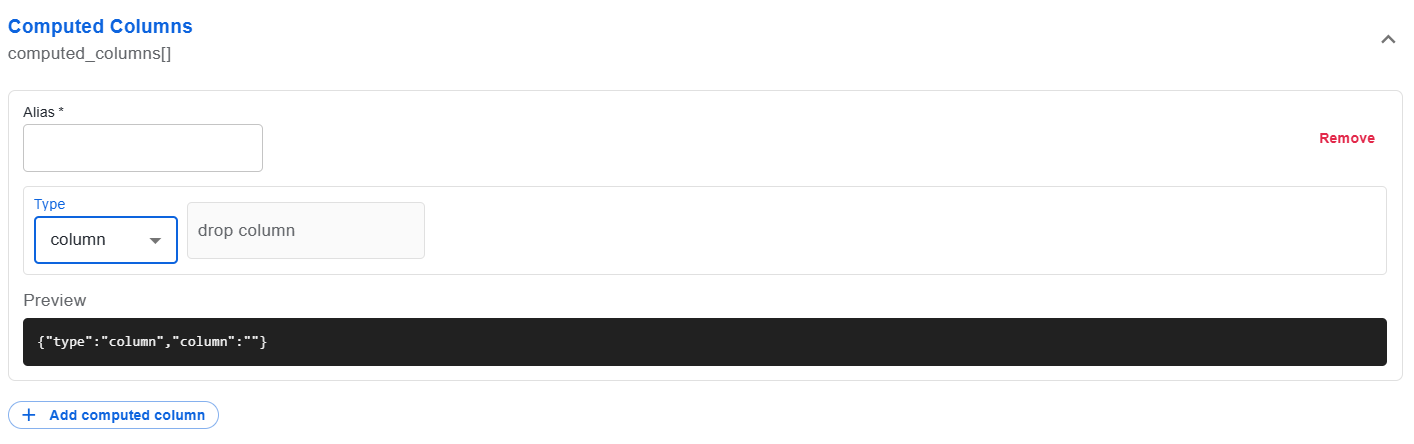
Click Add computed column, specify an alias for the expression, select an expression type, and define the expression type elements. The elements can differ depending on the type selection.
The Preview area displays the resulting expression in the JSON format. To set more computed columns, click Add computed column again.
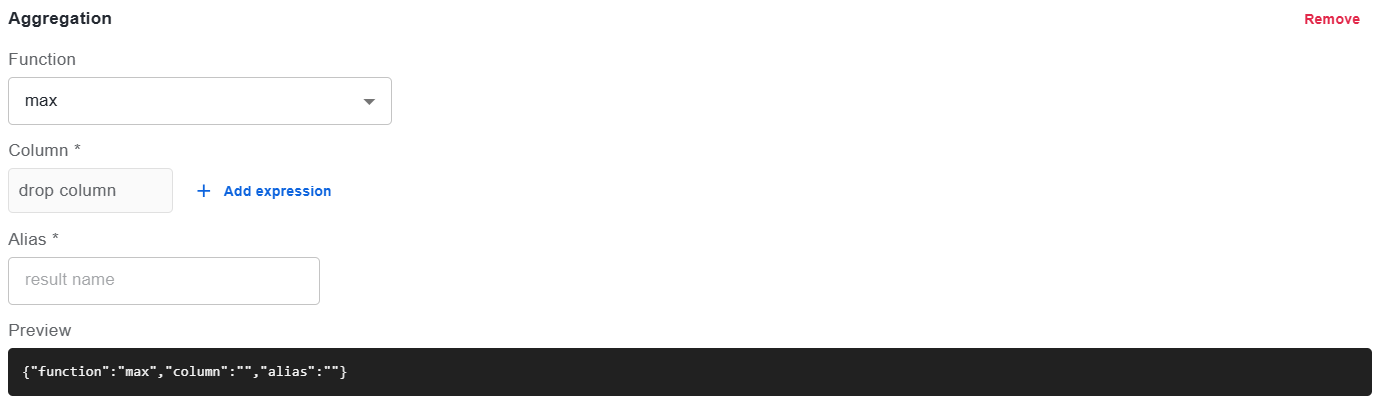
Click Add aggregation, select a function, and define the function elements. The elements can differ depending on the selected function.
The Preview area displays the resulting expression in the JSON format. To set more computed columns, click Add aggregation again.
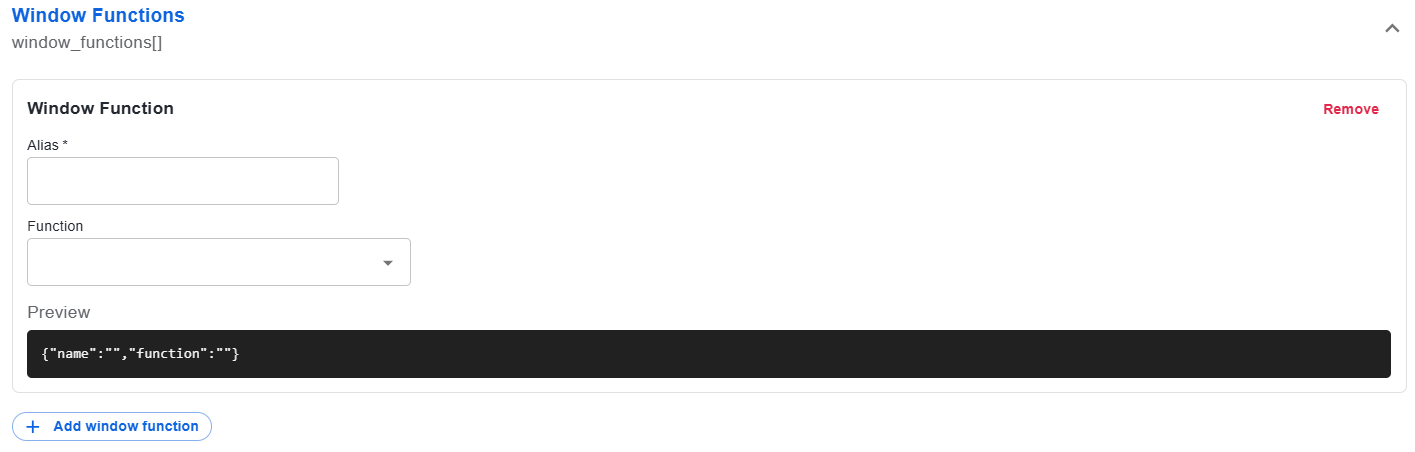
Click Add window function, specify an alias for the expression, select a function, and define the function elements. The elements can differ depending on the selected function.
The Preview area displays the resulting expression in the JSON format. To set more computed columns, click Add window function again.
The defined expressions are validated automatically, and the results are displayed in the Validation area at the top of the page.

All expressions you added are displayed as removable options in the SELECT panel and become visible in the Expressions panel from where you can reuse them in other pipeline configuration panels.
JOINS
To set the JOINS SQL operation, make the following changes in the JOINS panel:
In the table drop-down box, select a table on which to run the
JOINSoperation.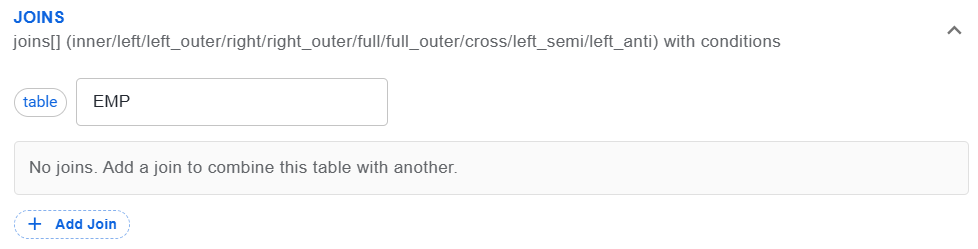
Click Add Join and configure the following:
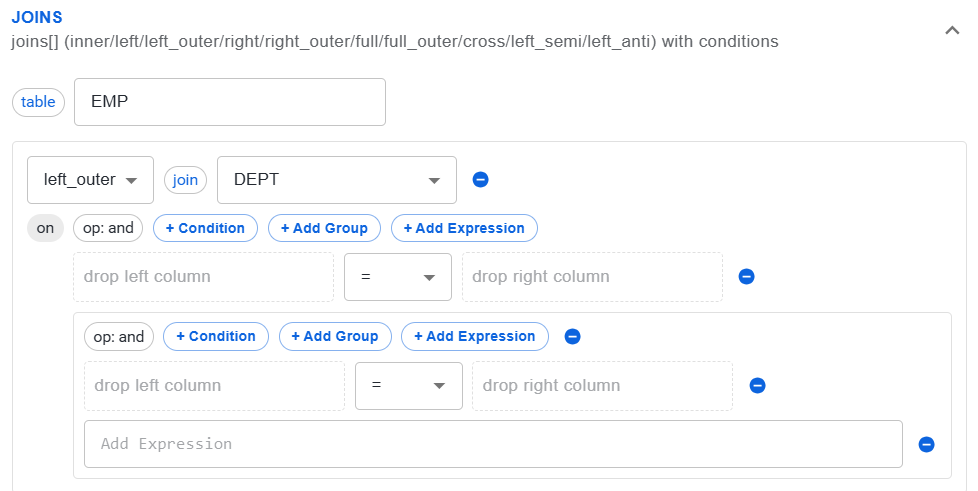
Select a joining method and specify a table to join.
Click Condition and switch the or or and operator. To set a condition for the join operation, drag-and-drop columns from the Schema panel to the corresponding fields in the condition configuration area and specify the relations between the columns by choosing an operator.
Click Add Group and switch the or or and operator. Then, drag-and-drop columns from the Schema panel to the corresponding fields in the group configuration area and specify the relations between the columns by choosing an operator in between.
Click Add Expression and specify an expression.
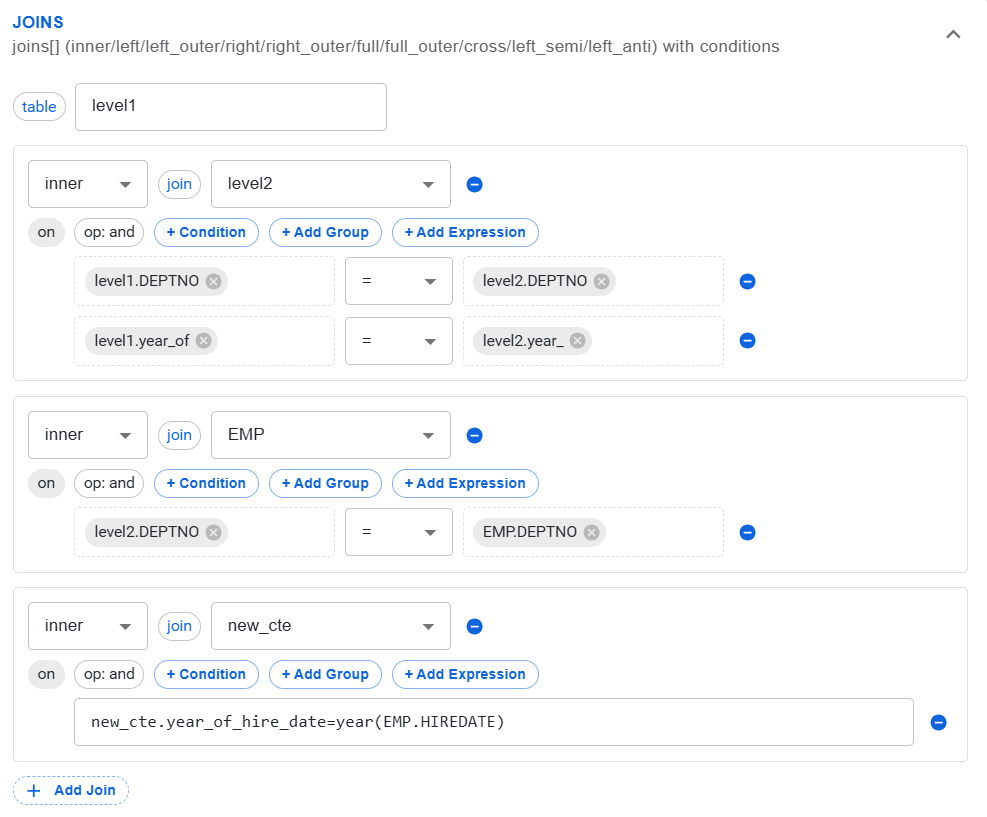
Below is an example of a configured JOINS operation:
WHERE
In the WHERE panel, you can set the WHERE clause by making the following changes:

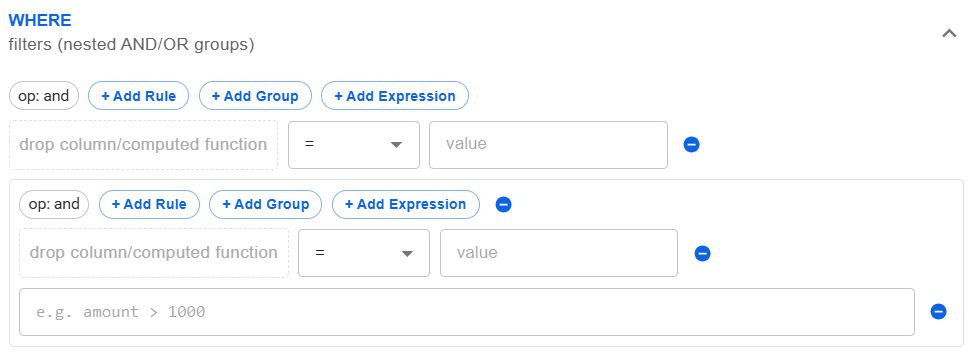
Click Add Rule and switch the or or and operator. To add a nested rule, drag a column from the Schema panel or a computed function from the Expressions panel, choose an operator, and set a value (if needed).
Click Add Group and switch the or or and operator. To set a nested group, drag a column from the Schema panel or a computed function from the Expressions panel, choose an operator, and set a value (if needed).
Click Add Expression and specify an expression.
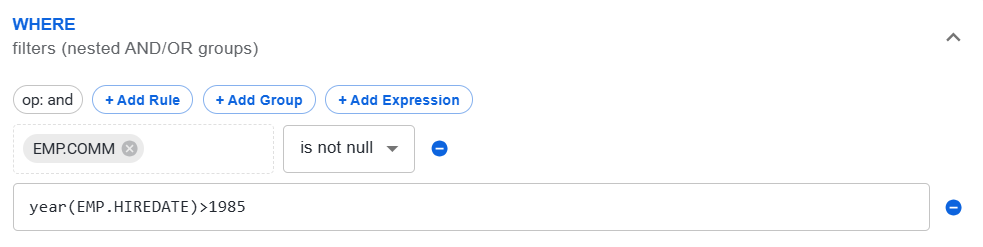
Below is an example of a configured WHERE clause with a nested rule and an expression:
GROUP BY and HAVING
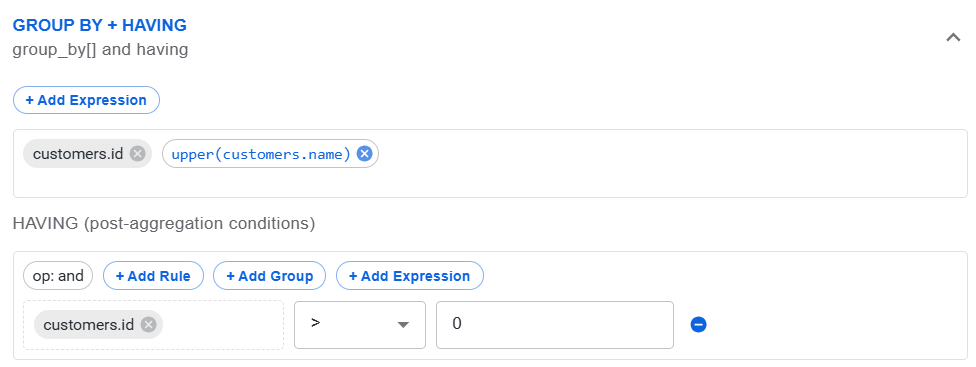
To configure the GROUP BY+HAVING operation, follow the steps below:
Drag a column from the Schema panel or a computed function from the Expressions panel to the grouping condition field.
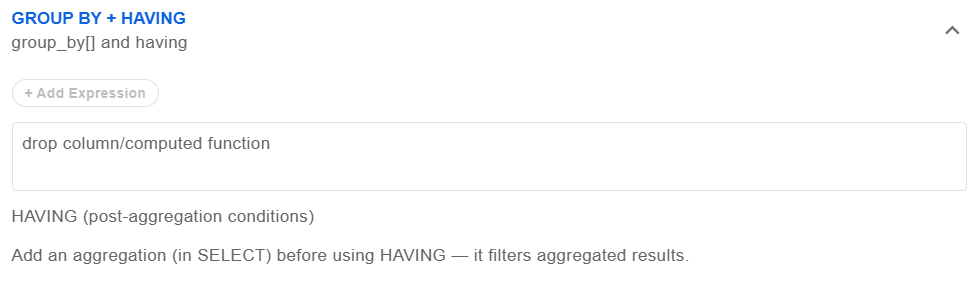
If needed, click Add Expression and specify an expression in the displayed field.
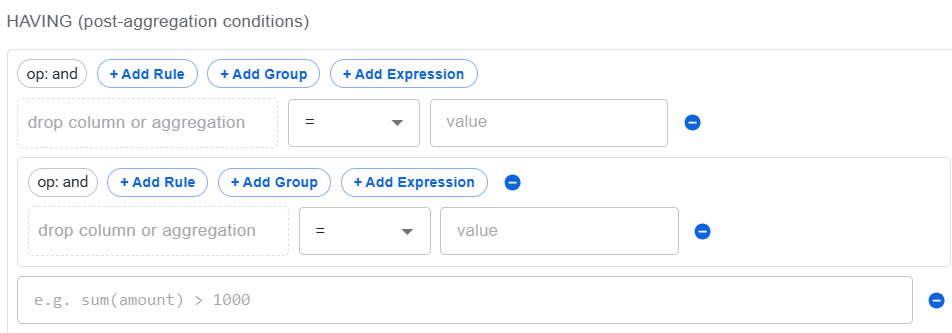
To set the HAVING post-aggregation rules and conditions, do as follows:
Click Add Rule and switch the or or and operator. To add a nested rule, drag a column from the Schema panel or a computed function from the Expressions panel, choose an operator, and set a value (if needed).
Click Add Group and switch the or or and operator. To set a nested group, drag a column from the Schema panel or a computed function from the Expressions panel, choose an operator, and set a value (if needed).
Click Add Expression and specify an expression.
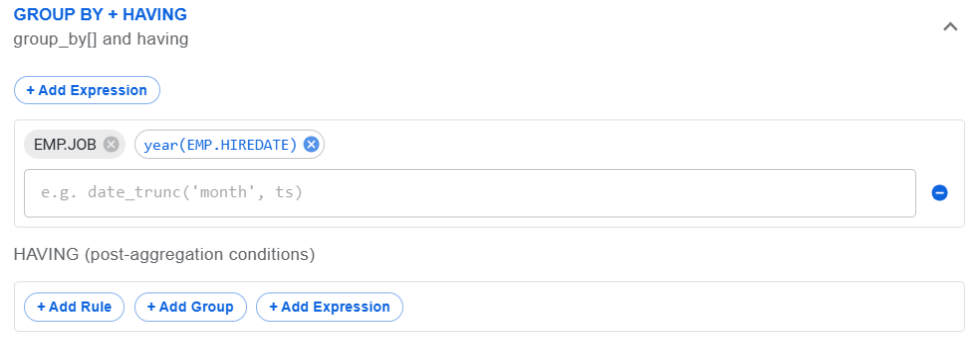
Below is an example of a configured GROUP BY+HAVING operation:
ORDER and LIMIT
In the ORDER+LIMIT panel, you can define the order-by operation and a limit of displayed data rows:
Drag a column from the Schema panel or a computed function, aggregation, or window function from the Expressions panel to the grouping condition field.
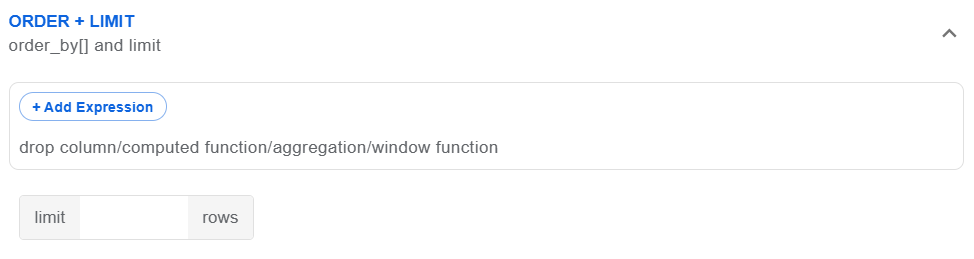
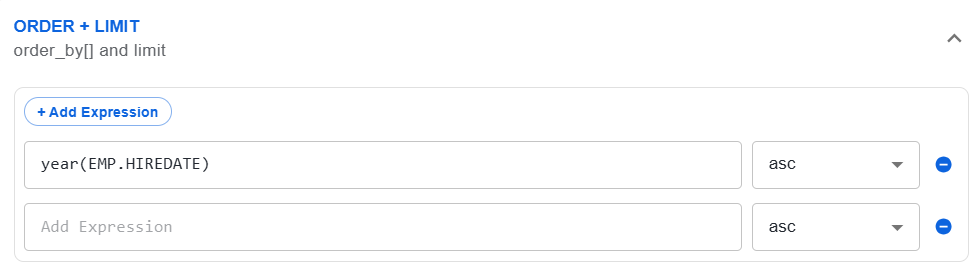
If needed, click Add Expression and specify an expression in the displayed field.
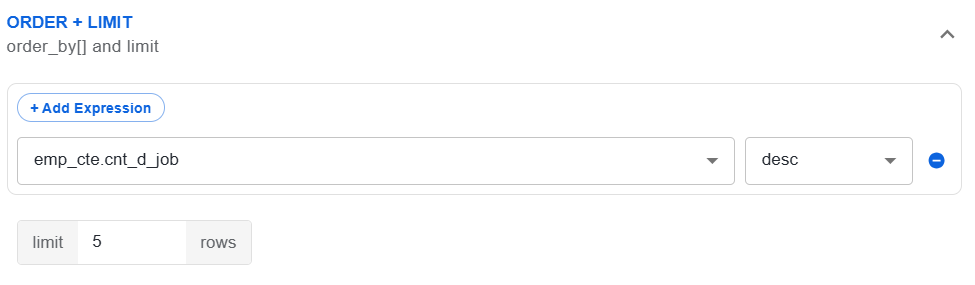
Set a limit of displayed rows.
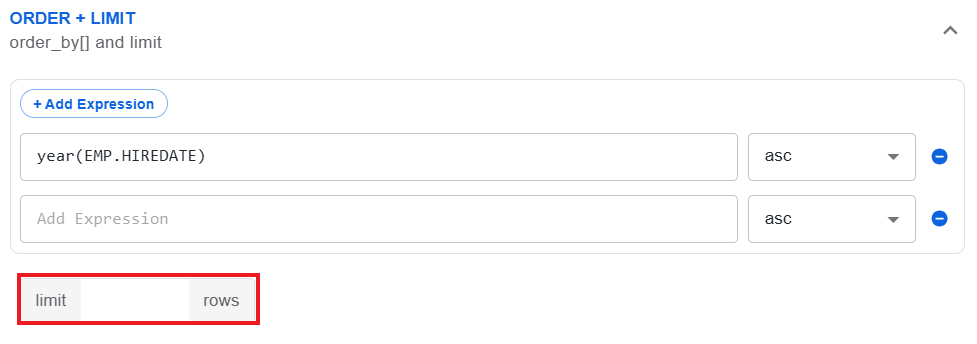
Below is an example of a configured ORDER+LIMIT operation:
Create CTE
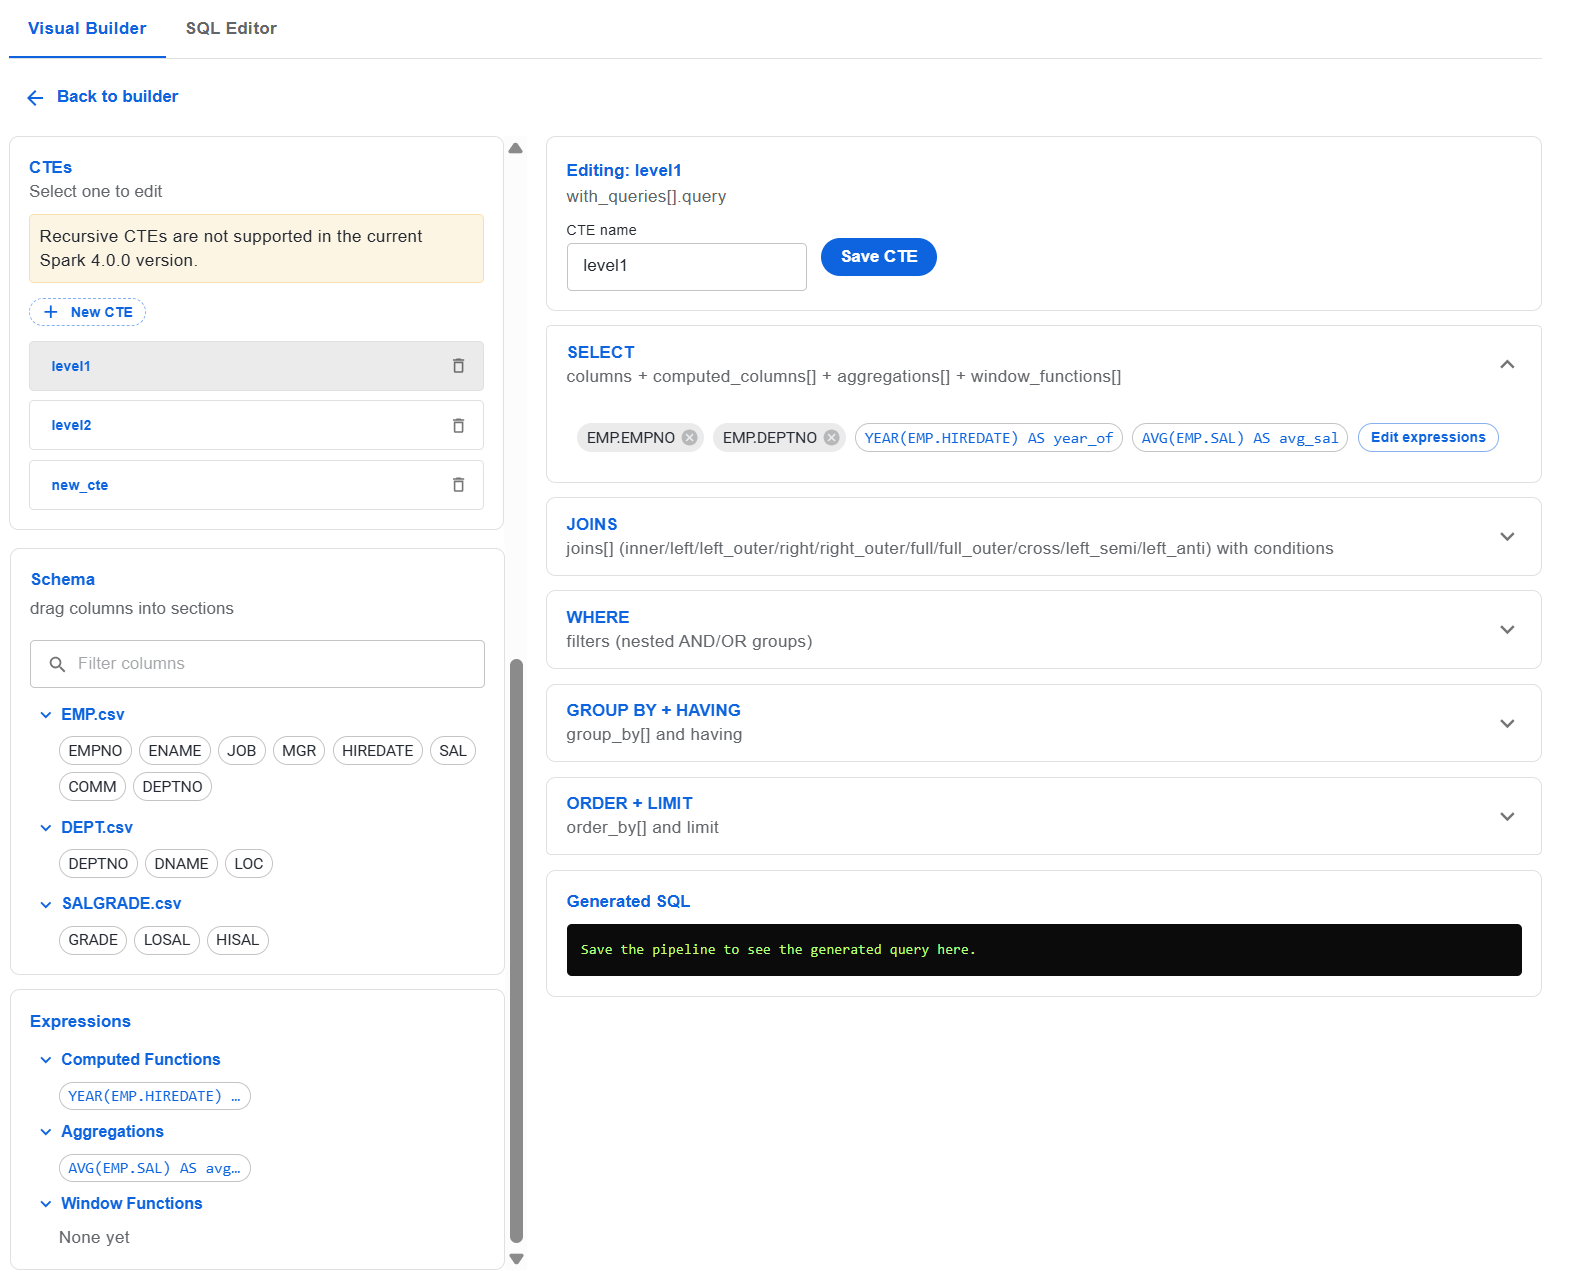
Common Table Expression (CTE) is a named temporary result set that you define inside a query and then reference later in the same query. CTEs are used to build multi-step pipelines. You can create a named CTE, configure it with an own source table, JOINS, SELECT, WHERE, GROUP BY, HAVING, ORDER, and LIMIT, and then use the CTE as a data source in the main query.
To create a new CTE in Visual Builder, follow the steps below:
In the Data Sources panel, click Create CTE.
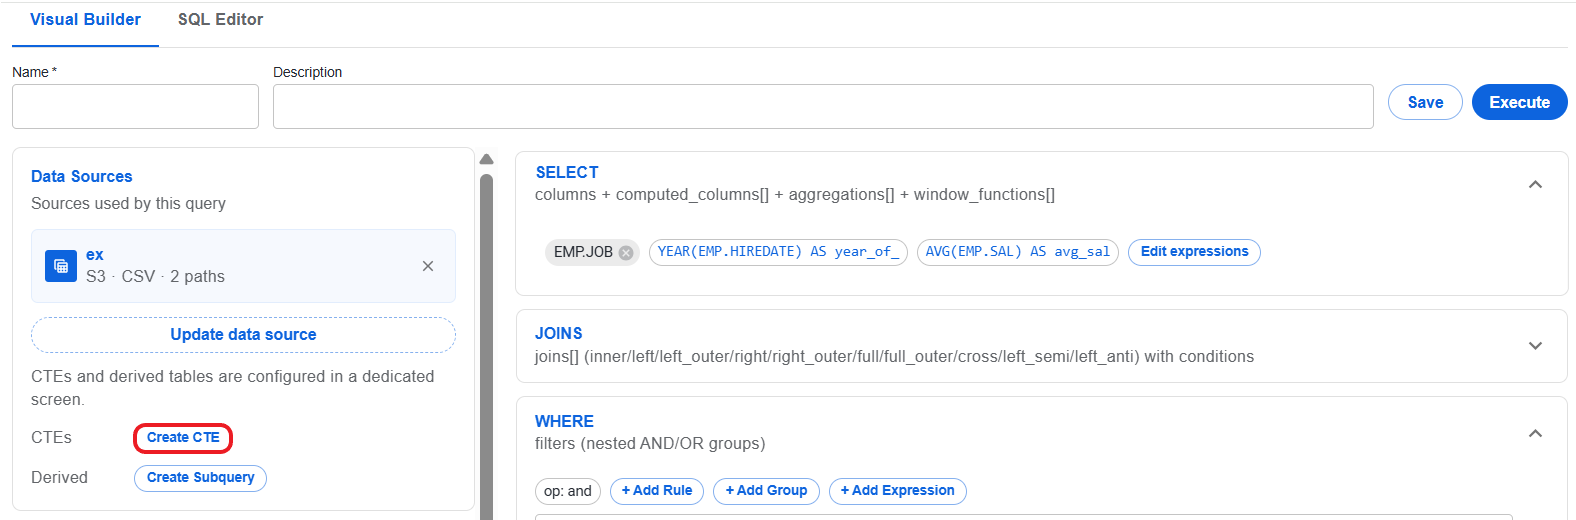
Click New CTE to start creating a CTE. The CTE is assigned the default
new_ctename that appears in the CTE name field in the New CTE panel. You can change the name in the field as needed. In New CTE panel, you can also see the CTE status as Unsaved.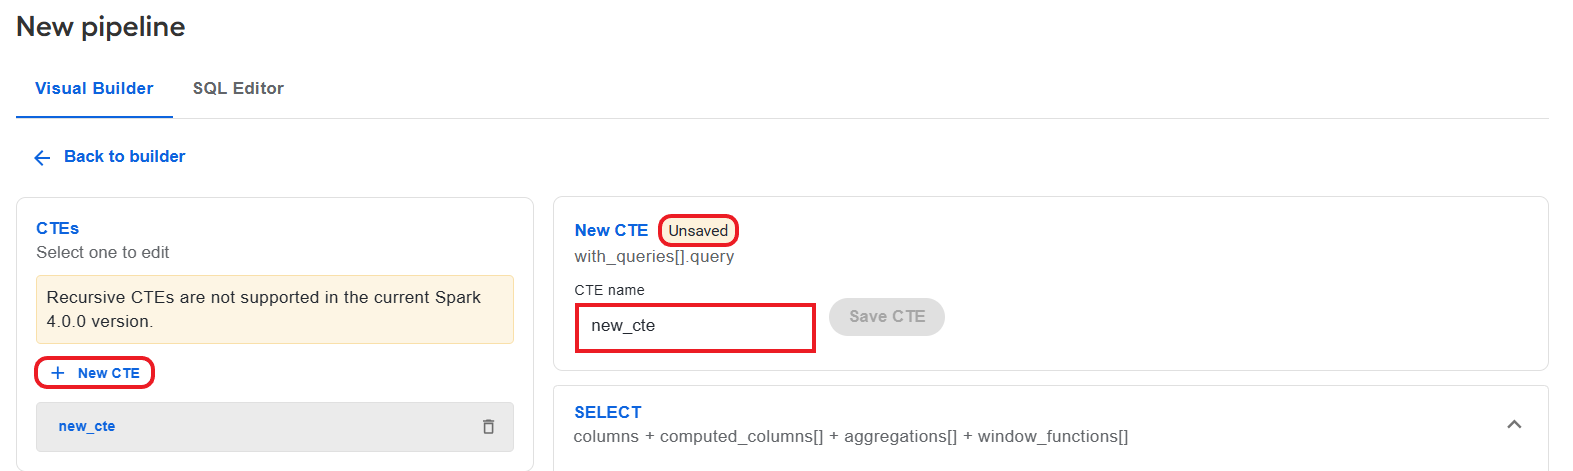
The data source for the CTE is the same as you use for the main query. So, the Schema panel displays the same input columns.
Define the following operations:
 warning
Mind that in the
GROUP BY,HAVING,ORDER BY, orWHEREoperations computed-column aliases and aggregation aliases are not supported. Use source columns or send the full expression or aggregate AST instead. If an alias is used in those operations, the API returns a validation error.Click Save CTE. The resulting query appears in the Generated SQL panel.
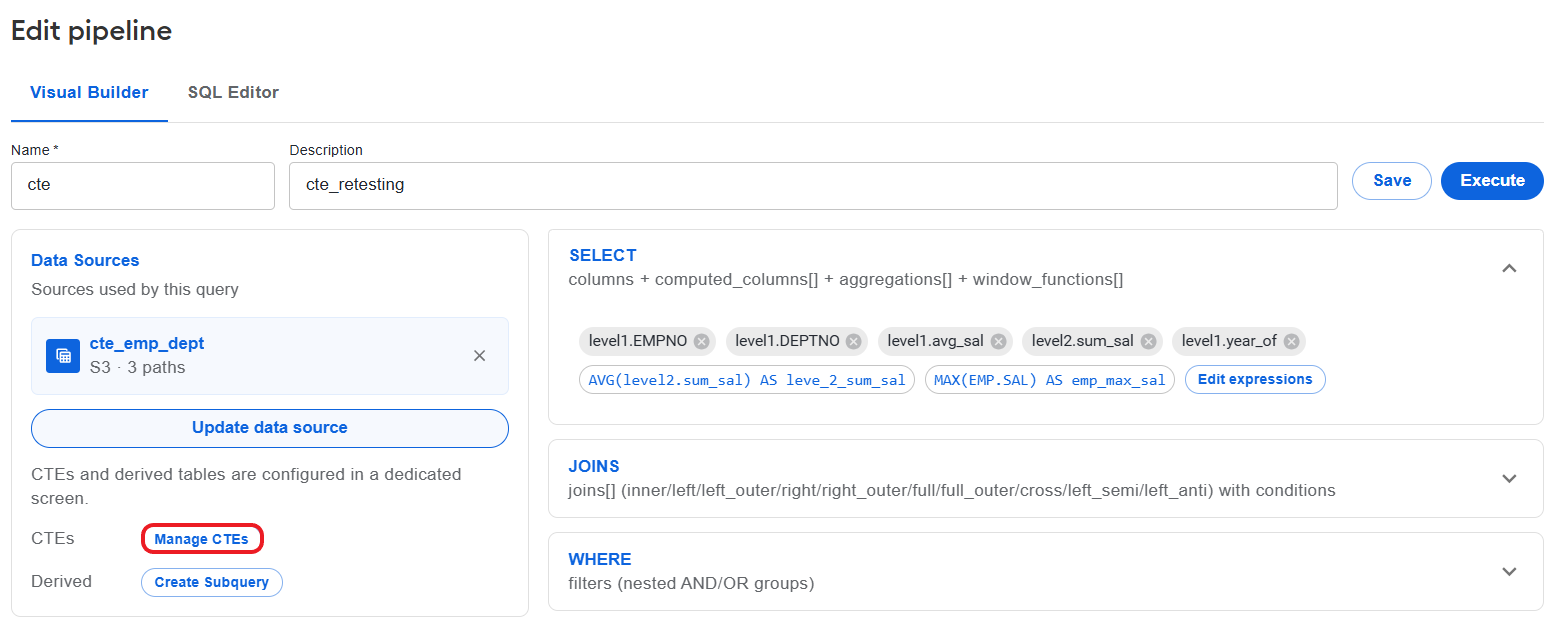
Once the CTE is saved, the Create CTE button in the Data Source panel changes to Manage CTEs. Clicking the Manage CTEs button brings you to the created CTE configuration, where you can make updates as appropriate.
Create subquery
The Subquery Builder is used to define named derived tables for the following SQL actions:
FROMusage throughfrom_subqueryJOINusage with an alias and join type
To create a subquery in Visual Builder for an existing query, follow the steps below:
In the Data Sources panel, click Create Subquery.
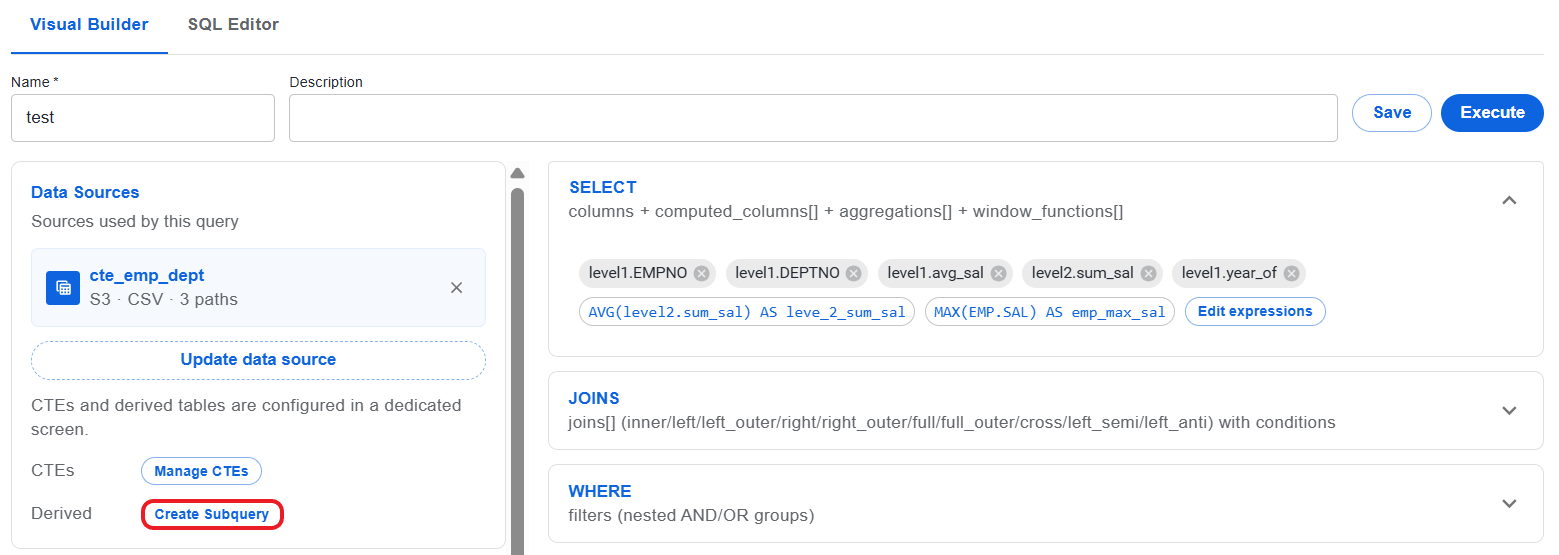
You are redirected to the Subquery Builder page where the first subquery level is already added for you, and you just need to set it up.
The subquery level is assigned the default
subqueryname that you can see in the Subquery levels panel and in the Alias field in the New subquery panel. To change the default name, update the value in the Alias field.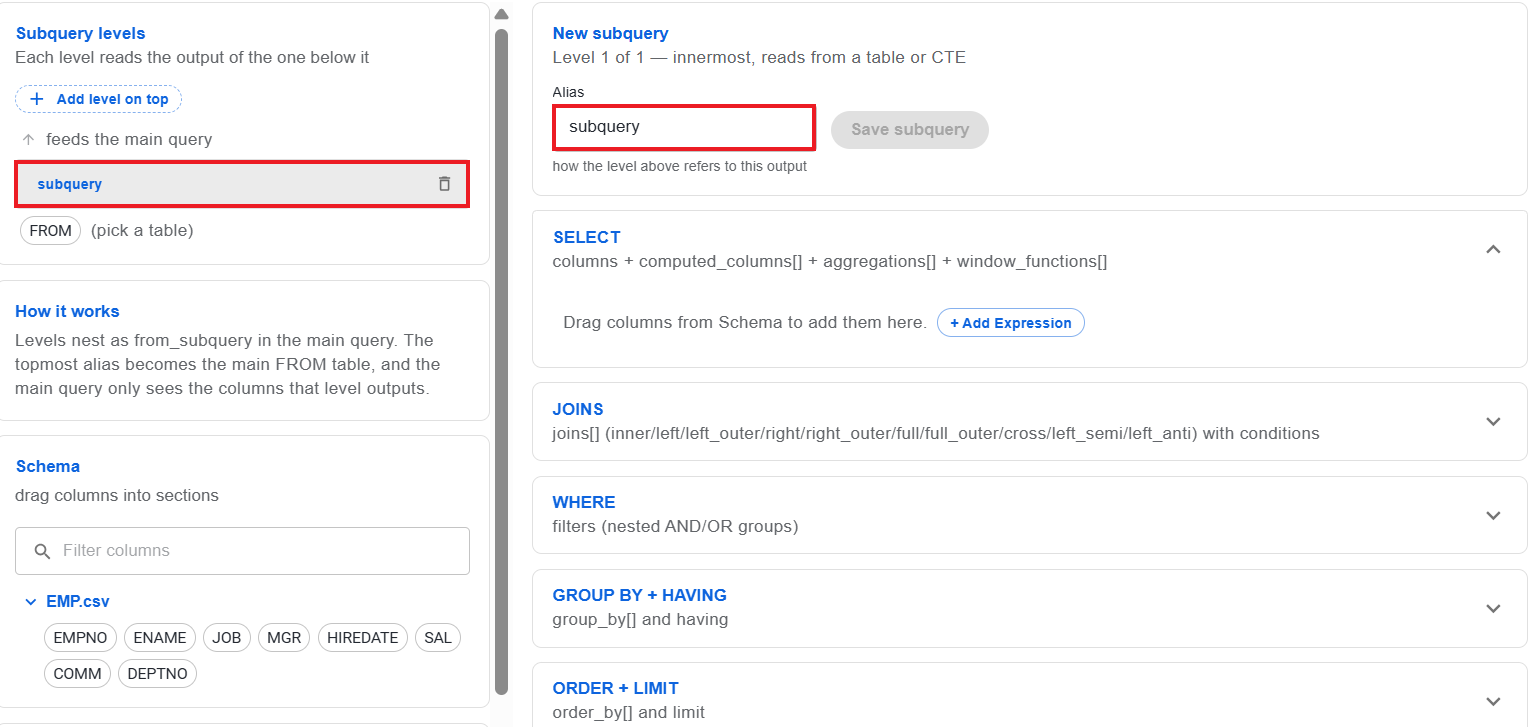
The data source for the subquery is the same as for the main query. So, the Schema section displays the same input columns.
Create an SQL subquery the same way as you created the main query by defining the following operations:
warningMind that in the
GROUP BY,HAVING,ORDER BY, orWHEREoperations computed-column aliases and aggregation aliases are not supported. Use source columns or send the full expression or aggregate AST instead. If an alias is used in those operations, the API returns a validation error.To add another level on top of the subquery, click Add level on top and set it up as a separate subquery by completing the actions described in step 1 to 3 above.
Within the main query, levels nest as
from_subquery. The topmost alias becomes the mainFROMtable, and the main query only sees the columns that the level outputs.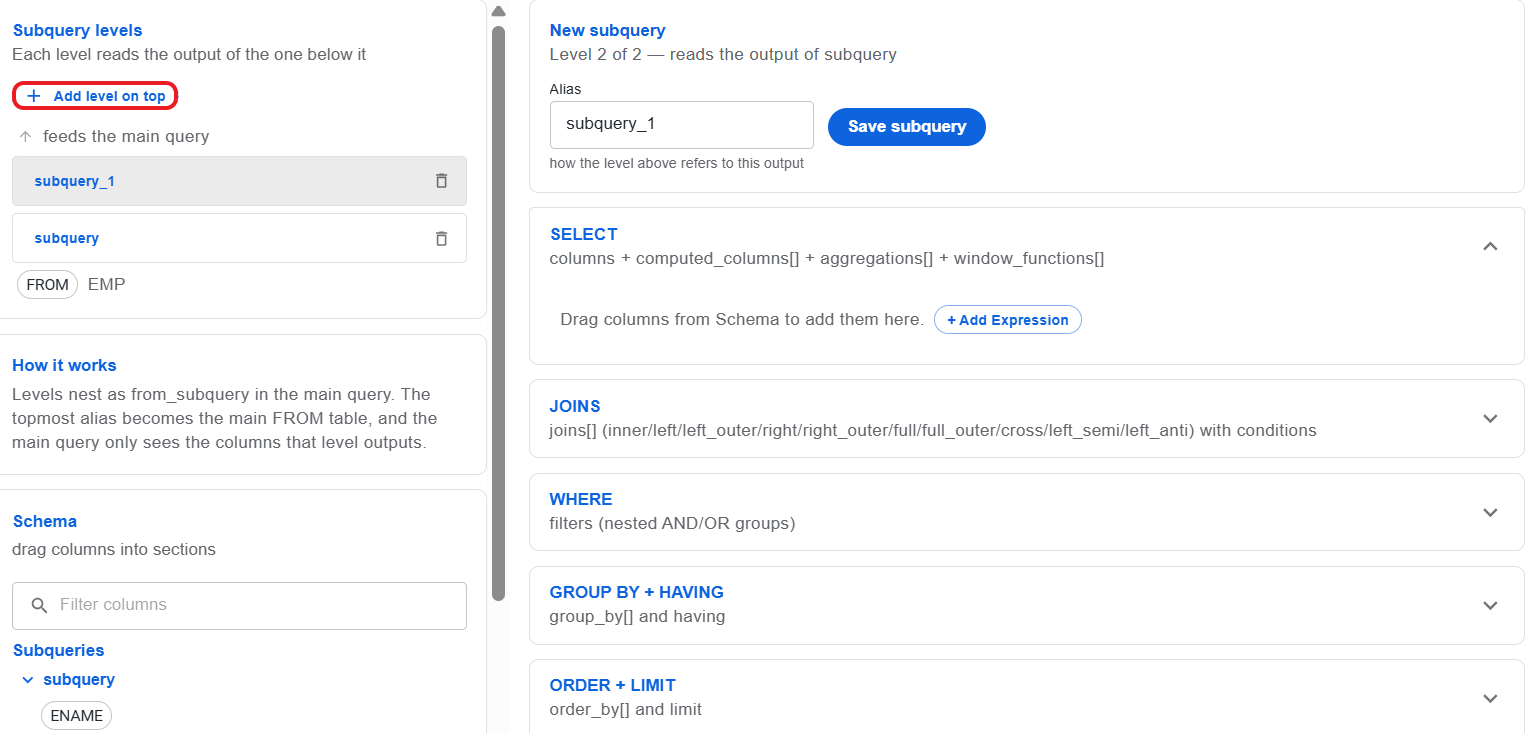
Click Save subquery. The newly created subquery appears in the Subqueries section in the Schema panel, and you can use it when setting the SQL operations for the main query.
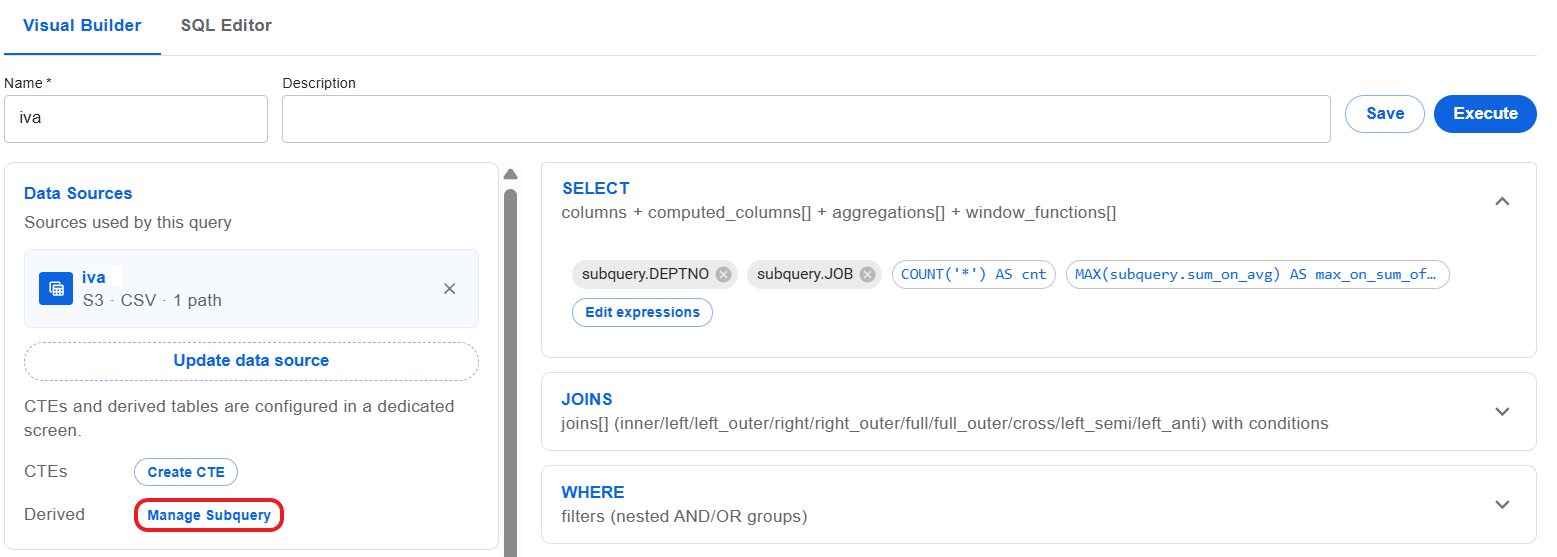
The Create Subquery button in the main query editor changes to Manage Subquery. Clicking the button opens the Subquery Builder page where you can update the subquery settings.
Create in SQL Editor
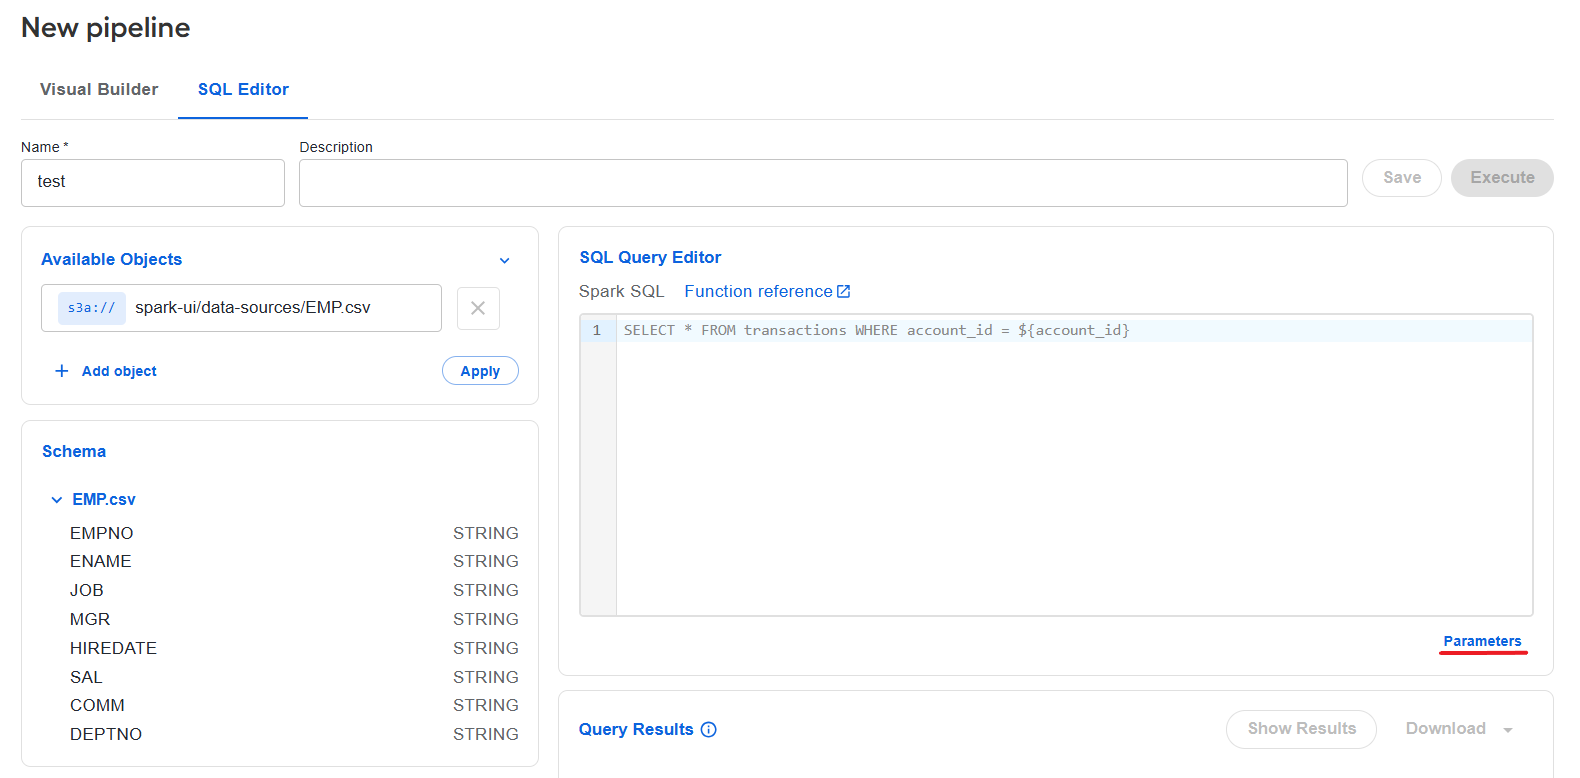
To create a data pipeline in SQL Editor, navigate to the SQL Editor tab and proceed as described below.
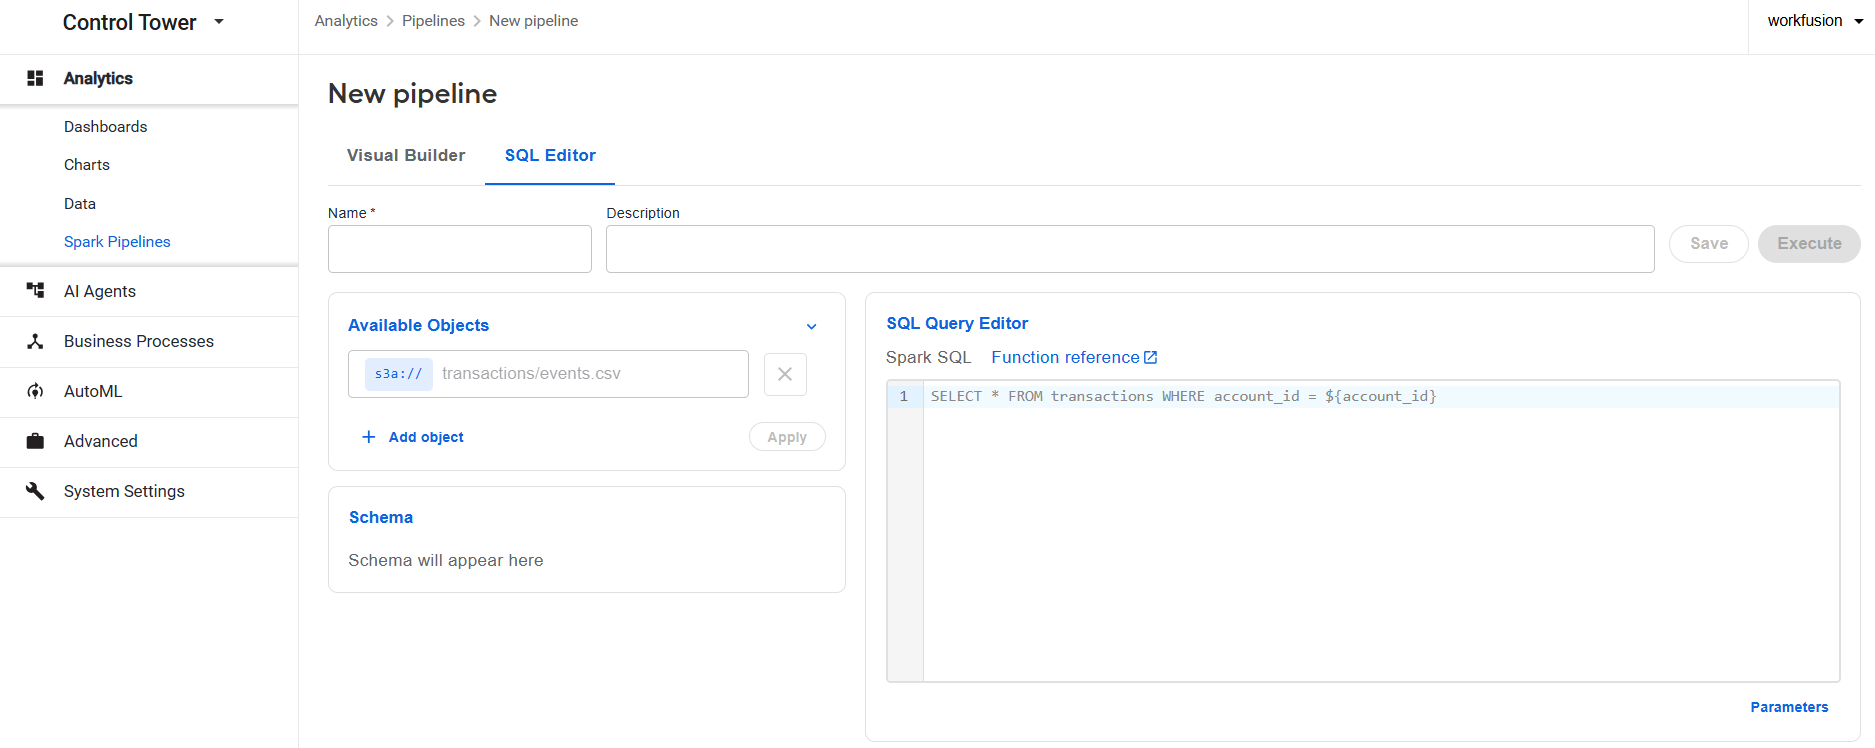
In the Name field, add a user-friendly name for the pipeline. The name will be displayed in the Name column on the Spark Pipelines page.
In the Available Objects panel, type in a storage path to the data object you want the SQL query to work with. To add more objects, click Add object and specify more file paths.
Click Apply. The columns from the data object will appear in the Schema panel. You can use them as a reference to write your SQL script.
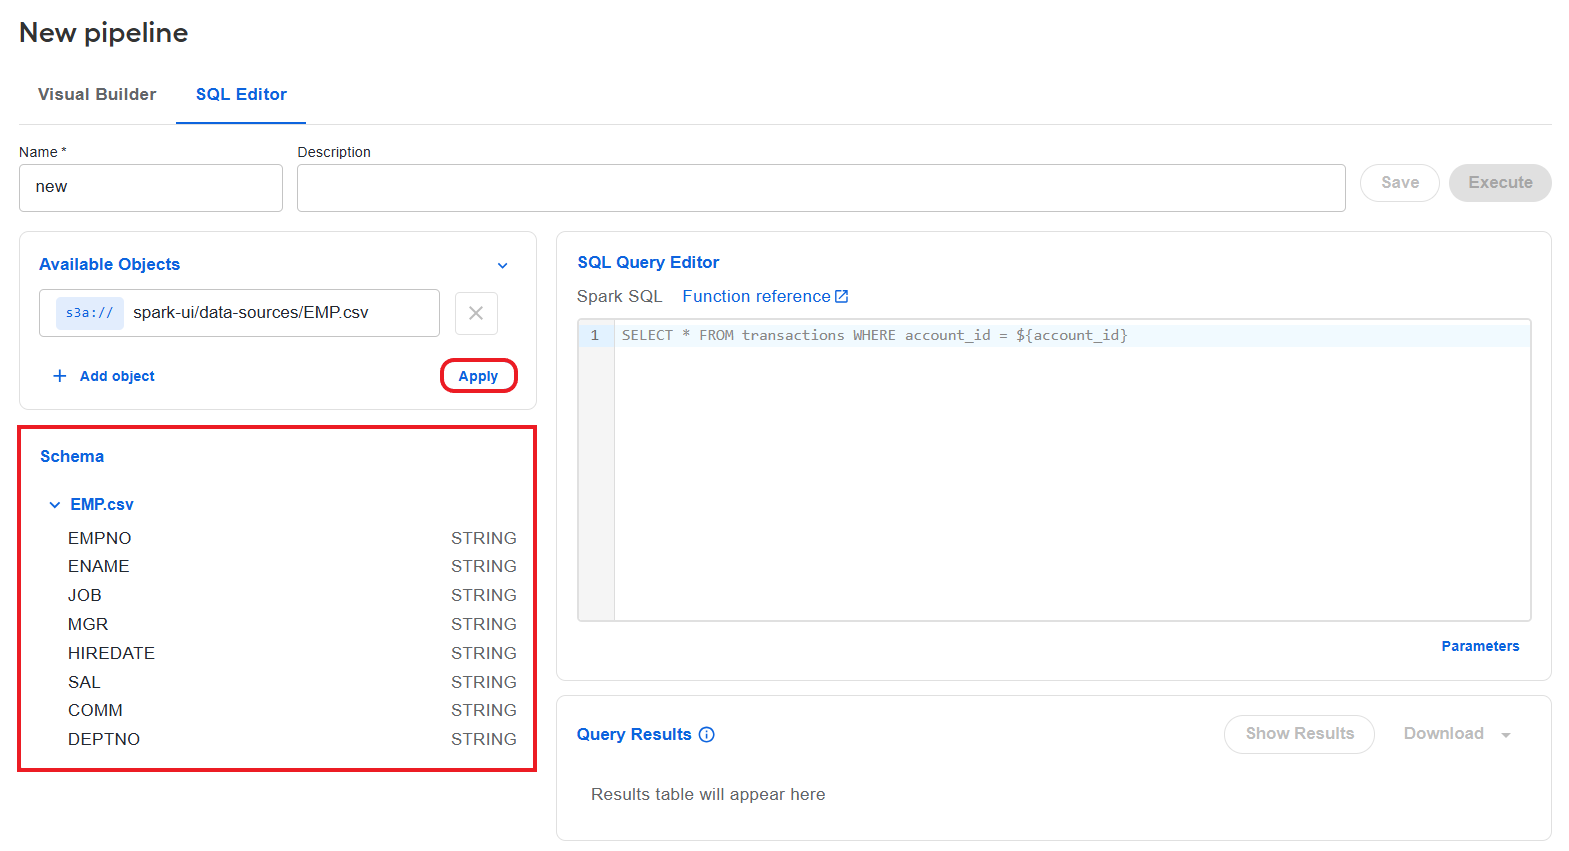
In SQL Query Editor, create your SQL script. Click the link for function reference.
Click to see sample SQL script
The following SQL script includes CTEs and Joins, Computed Columns, and Window function.
SELECT
    *,
    SUM(total_amount) OVER (
        PARTITION BY customer_name
        ORDER BY region DESC
        ROWS BETWEEN UNBOUNDED PRECEDING AND CURRENT ROW
    ) AS total_amount
FROM (
    WITH
    cte_trans AS (
        SELECT
            transaction_date,
            amount,
            channel,
            transaction_id,
            customer_id
        FROM transactions
    ),
    cte_cust AS (
        SELECT
            customer_name,
            region,
            customer_id
        FROM customers
    )
    SELECT
        cte_trans.transaction_date,
        cte_trans.channel,
        cte_trans.transaction_id,
        cte_cust.customer_name,
        cte_cust.region,
        SUM(cte_trans.amount) AS total_amount
    FROM cte_trans
    INNER JOIN cte_cust
        ON cte_trans.customer_id = cte_cust.customer_id
    GROUP BY
        cte_trans.transaction_date,
        cte_trans.channel,
        cte_trans.transaction_id,
        cte_cust.customer_name,
        cte_cust.region
) subquery
ORDER BY transaction_date DESC
LIMIT 100;
Use template parameters
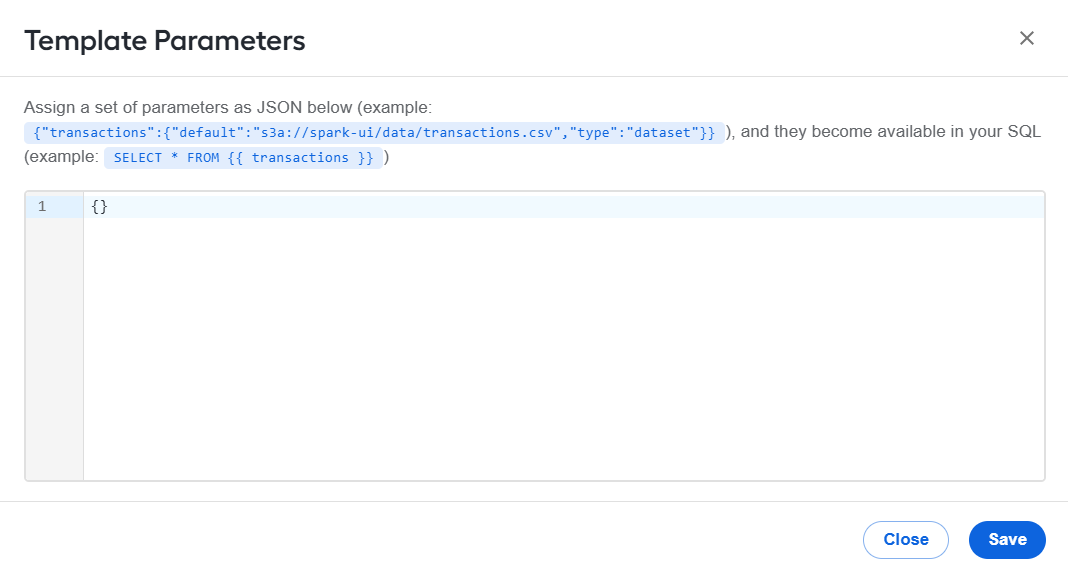
Plain SQL with inline csv.\... executes with no parameters. SQL with {{ }} requires valid parameter JSON to execute. To add the parameters, do as follows:
On the SQL Editor tab, click Parameters.
In the Template Parameters popup, add one or more parameters and click Save.
Save pipeline
To save a data pipeline, click the Save button at the top of any tab. The Save button becomes active when at least one schema column is selected.

As you save the created pipeline, the Generated SQL panel on the Visual Builder tab will display the resulting SQL.

Simultaneously, a pipeline appears on the Spark Pipelines list.
The created pipelines, SQL editor JSON, and query outputs are stored permanently for 90 days in S3.
Execute pipeline
Executing a pipeline is possible only once the pipeline is saved. In SQL Editor, if there are unsaved edits, Execute runs Save first.
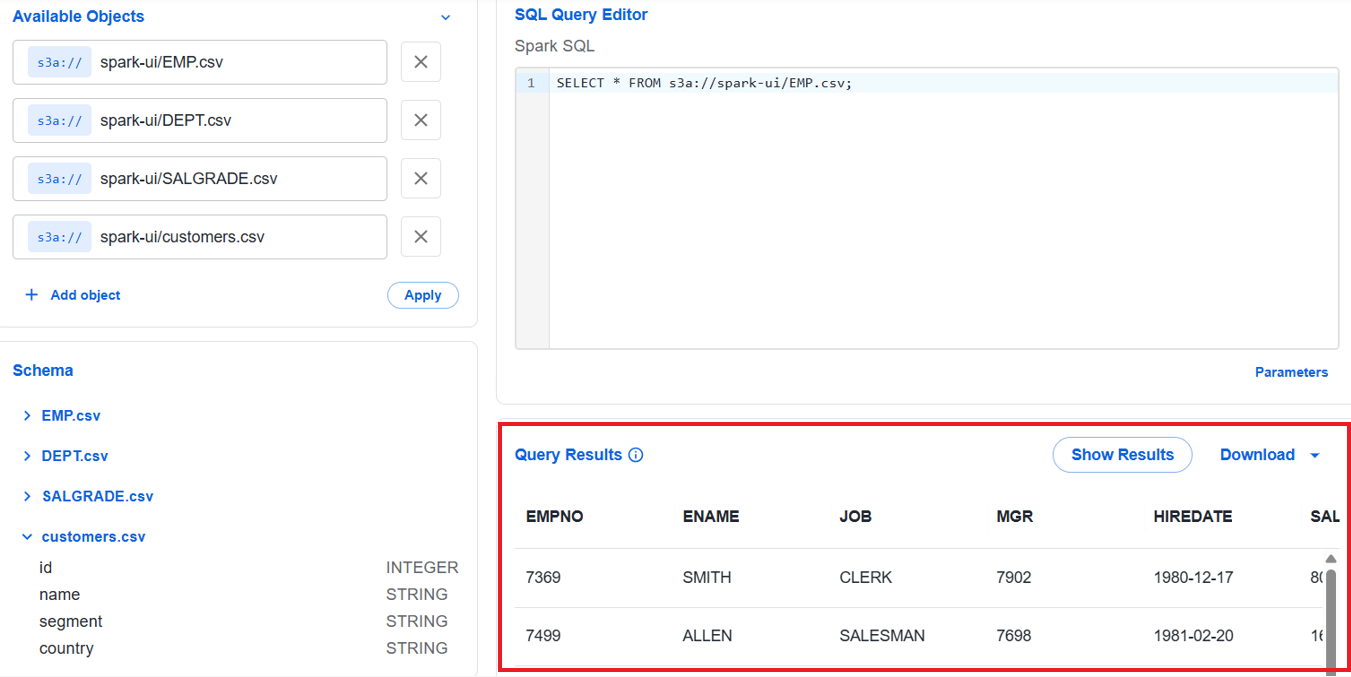
To execute a pipeline and get query results in the Control Tower interface, click the Execute button.

After execution, the Query Results panel displays the execution results. Clicking the Show Results button fetches the latest query results stored in S3.
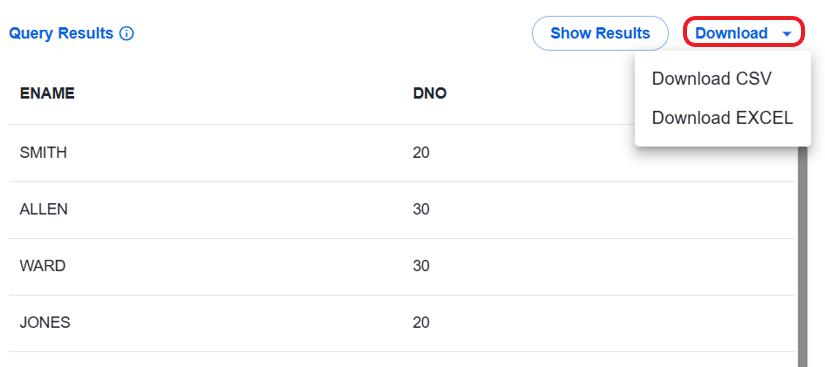
You can download the results table as a CSV or EXCEL file. To do that, click the Download drop-down arrow and choose a format.
You can also run saved pipelines using Spark UI API. For details, read the section.
Delete pipeline
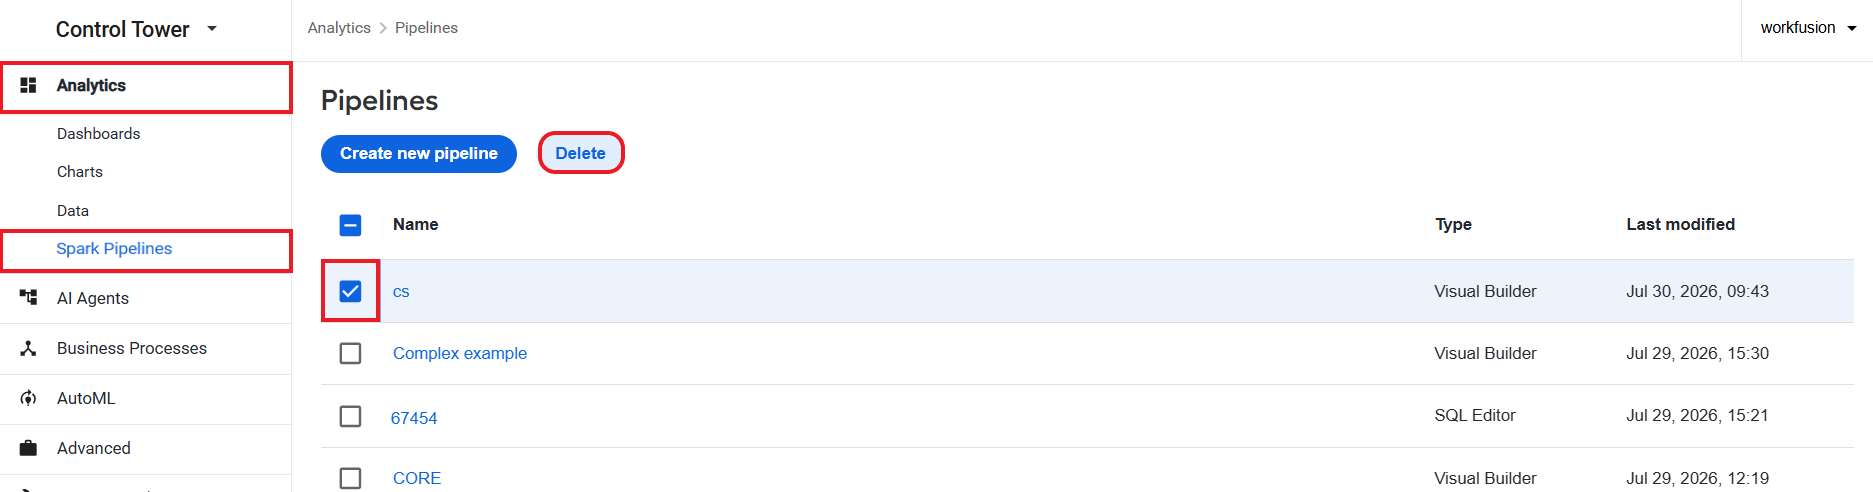
To delete a pipeline, navigate to Analytics > Spark Pipelines and select one or more pipelines you want to delete and click the Delete button.
Manage pipelines using Spark UI API
API URL: https://<spark-ui-host>
Replace the host in the example with your Spark interface host. If the Spark UI is installed under a path prefix, include the prefix, for example, https://ct.example.com/spark-ui.
- Use the Visual Builder API when the saved pipeline was created in Visual Builder with table bindings.
- Use the SQL Editor API when the saved pipeline is an SQL query with named runtime parameters.
The table below illustrates the API usage in more detail:
| Source | API endpoint | How to pass a different dataset |
|---|---|---|
| Visual Builder | POST /api/visual-builder/{pipeline}.json/run | Send paths, which is an ordered list of S3 paths that maps to table_bindings of the saved pipeline. |
| SQL Editor | POST /api/queries/{query}.json/run | Send parameters, which are runtime values for saved {{name}} placeholders. Values can be dataset paths or literals, depending on the saved parameter schema. |
Supported storage paths for input files:
s3a://s3://
Supported input file formats:
- CSV
- JSON
- Parquet
- ORC
- Avro
For Spark and Hadoop clients, normalize s3:// paths to s3a:// if the client expects S3A.
List saved pipelines
Before running a pipeline, you can get their list and query keys using the following requests:
curl --location 'http://localhost:8080/api/pipeline-catalog' \
  --header 'Accept: application/json'
curl --location 'http://localhost:8080/api/pipelines' \
  --header 'Accept: application/json'
curl --location 'http://localhost:8080/api/queries' \
  --header 'Accept: application/json'
Use the returned key as {pipeline} for Visual Builder runs or {query} for SQL Editor runs.
Run Visual Builder pipeline
To run a pipeline saved in Visual Builder, use the following API request:
POST /api/visual-builder/{pipeline}.json/run
Request body
{
  "paths": [
    "s3a://spark-ui/data/transactions.csv",
    "s3a://spark-ui/data/transactionscustomers.csv"
  ]
}
The paths array maps by position to the table bindings of the saved pipeline:
paths[0]maps totable_bindings[0].paths[1]maps totable_bindings[1].
Do not send table names in the request body. Send only the ordered list of S3 paths.
Request examples
Saved pipeline key:
cte-join-sample1-1784814650-ed0a1d77.json
Run the pipeline with the original datasets:
curl --location 'http://localhost:8080/api/visual-builder/cte-join-sample1-1784814650-ed0a1d77.json/run' \
  --header 'Content-Type: application/json' \
  --data '{
    "paths": [
      "s3a://spark-ui/data/transactions.csv",
      "s3a://spark-ui/data/transactionscustomers.csv"
    ]
  }'
Run the same pipeline with a different dataset by changing only the path values. The list length and order must stay the same as the saved bindings.
curl --location 'http://localhost:8080/api/visual-builder/cte-join-sample1-1784814650-ed0a1d77.json/run' \
  --header 'Content-Type: application/json' \
  --data '{
    "paths": [
      "s3a://spark-ui/data/transactions_2026_08.csv",
      "s3a://spark-ui/data/customers_2026_08.csv"
    ]
  }'
Response examples
A successful pipeline run returns HTTP 202.
{
  "run_id": "<hex>",
  "status": "running",
  "output": {
    "bucket": "spark-ui",
    "prefix": "visual-builder/<pipeline_id>/run/<run_id>/output/",
    "format": "parquet"
  }
}
The output from Visual Builder is saved as a Parquet file on the following path:
visual-builder/<pipeline_id>/run/<run_id>/output/
Run SQL Editor query
To run a pipeline saved in SQL Editor, use the following API request:
POST /api/queries/{query}.json/run
Request body
{
  "parameters": {
    "orders": "s3a://spark-ui/data/transactions.csv",
    "region": "EMEA"
  }
}
Saved SQL uses {{ parameter_name }} placeholders. At runtime, provide values in the parameters object. Parameters can represent datasets or literals, depending on the parameter schema of the saved query.
In the example below, orders is a dataset parameter and region is a literal parameter.
SELECT * FROM {{ orders }} WHERE region = {{ region }}
Request example
curl --location 'http://localhost:8080/api/queries/orders.sql.json/run' \
  --header 'Content-Type: application/json' \
  --data '{
    "parameters": {
      "orders": "s3a://spark-ui/data/transactions.csv",
      "region": "EMEA"
    }
  }'
Run the same query with a different dataset and a literal value:
curl --location 'http://localhost:8080/api/queries/orders.sql.json/run' \
  --header 'Content-Type: application/json' \
  --data '{
    "parameters": {
      "orders": "s3a://spark-ui/data/transactions_2026_08.csv",
      "region": "APAC"
    }
  }'
If the query has no placeholders or if all defaults are set, you can run it with an empty JSON body:
curl --location 'http://localhost:8080/api/queries/orders.sql.json/run' \
  --header 'Content-Type: application/json' \
  --data '{}'
Response example
A successful run returns HTTP 202 with the same response format as a Visual Builder run.
{
  "run_id": "<hex>",
  "status": "running"
}
The SQL Editor output is saved on the following path:
sql-editor/<query_id>/run/<run_id>/output/
Poll status and preview results
Use the run_id from the HTTP 202 response.
Get status
curl --location 'http://localhost:8080/api/runs/<run_id>' \
  --header 'Accept: application/json'
Poll until the run reaches a terminal status:
succeededfailed
Preview output
After the run succeeds, request a preview:
curl --location 'http://localhost:8080/api/runs/<run_id>/preview?limit=100' \
  --header 'Accept: application/json'
Read full output
Step 1: wait for success and capture output location
curl --location 'http://localhost:8080/api/runs/<run_id>'
When the run succeeds, the response includes the output location and storage details.
{
  "status": "succeeded",
  "output_location": "s3a://spark-ui/visual-builder/<id>/run/<run_id>/output/",
  "output": {
    "bucket": "spark-ui",
    "prefix": "visual-builder/<id>/run/<run_id>/output/",
    "format": "parquet"
  }
}
The output prefix contains distributed Parquet files.
.../output/
  _SUCCESS
  part-00000-....parquet
  part-00001-....parquet
  ...
Always load the full .../output/ folder unless you intentionally need a single partial file.
Step 2: read Parquet from output prefix
For large outputs, it is preferable to use streaming or batch processing. Avoid collecting very large outputs into a single local process.
On step 2, you have the following options:
Option A: PyArrow dataset
Use the option when you want to scan the full output without Spark.
import s3fs
import pyarrow.dataset as ds

# From GET /api/runs/<run_id>
bucket = "spark-ui"
prefix = "visual-builder/<pipeline_id>/run/<run_id>/output/"

fs = s3fs.S3FileSystem(
    # endpoint_url=..., key=..., secret=...
    # Match your MinIO, Ceph, or S3 configuration.
)

dataset = ds.dataset(
    f"{bucket}/{prefix}",
    filesystem=fs,
    format="parquet",
)

# Full table. Use carefully for large outputs.
table = dataset.to_table()

# Batch scan for larger outputs.
for batch in dataset.to_batches(batch_size=65_536):
    # process batch.to_pandas() or the Arrow batch
    ...
Option B: pandas and PyArrow
Use the option to handle small or medium outputs.
import pandas as pd
import s3fs

output_glob = "s3://spark-ui/visual-builder/<pipeline_id>/run/<run_id>/output/*.parquet"
fs = s3fs.S3FileSystem(...)

df = pd.read_parquet(output_glob, filesystem=fs)
See reference implementation
Below is a reference implementation comprising API requests to execute a Visual Builder query, run an SQL Editor query, poll the status, and preview the output.
# Visual Builder (adhoc datasets via paths order)
curl --location 'http://localhost:8080/api/visual-builder/<pipeline>.json/run' \
--header 'Content-Type: application/json' \
--data '{ "paths": [ "s3a://spark-ui/data/a.csv", "s3a://spark-ui/data/b.csv" ] }'

# SQL Editor (adhoc datasets via parameters)
curl --location 'http://localhost:8080/api/queries/<query>.json/run' \
--header 'Content-Type: application/json' \
--data '{ "parameters": { "orders": "s3a://spark-ui/data/a.csv" } }'

# Poll / preview
curl --location 'http://localhost:8080/api/runs/<run_id>'
curl --location 'http://localhost:8080/api/runs/<run_id>/preview?limit=100'
Review common errors
The table below lists common Spark UI API errors you can get in responses.
| HTTP status | Code | Meaning |
|---|---|---|
400 | binding_mismatch | The Visual Builder request has the wrong number of paths or an invalid path list. |
400 | missing_parameter | A required SQL parameter was not provided. |
400 | unknown_parameter | The request includes an SQL parameter that is not defined in the saved schema. |
400 | bad_request | The request has an invalid S3 path or unsupported format. |
404 | not_found | The pipeline or query key was not found. |
502 | Spark or S3 error | The run failed because of a cluster or storage failure. |
503 | not_configured | A required service is unavailable or not configured. |
503 | too_many_requests | The run queue is full. Retry later or reduce request volume. |