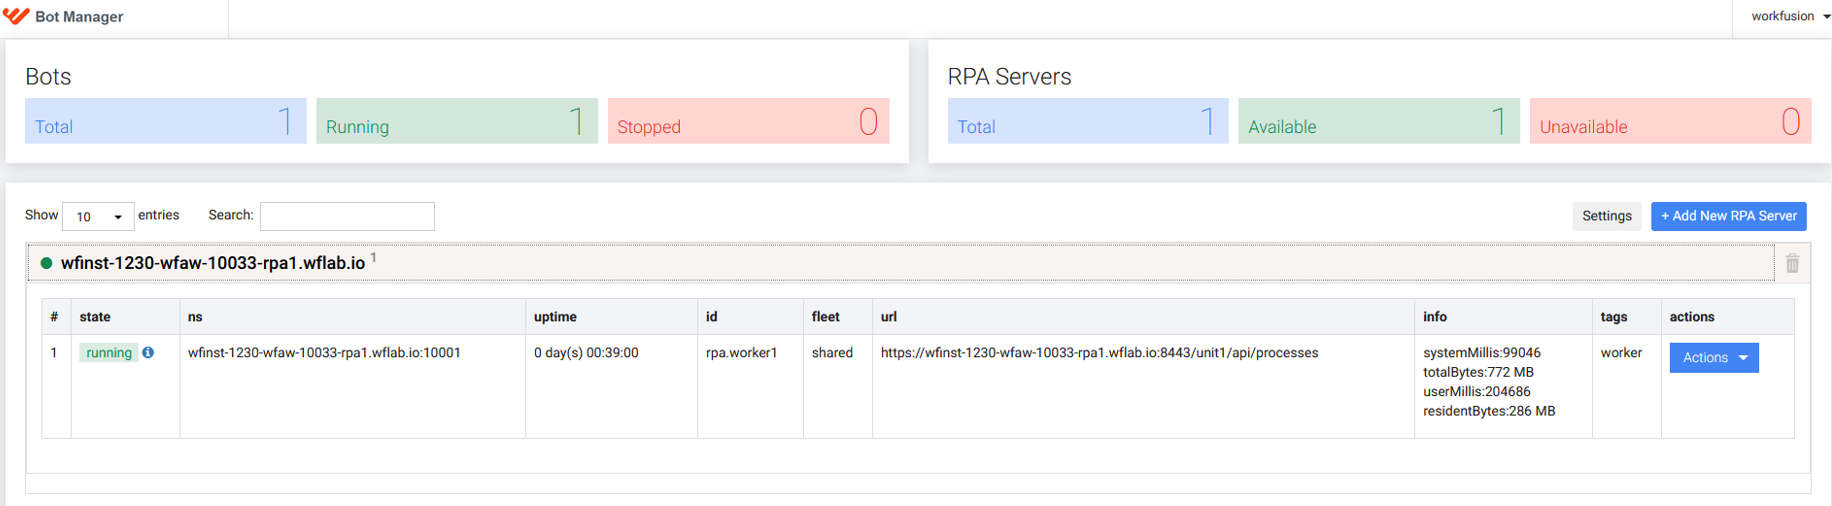
Issues related to poor RPA server performance
To confirm and investigate an issue related to poor RPA server performance, act as follows:
Analyze load
In Kibana, check the Host Overview dashboards for CPU and memory utilization:
Navigate to Dashboard/[WF] Host Overview.
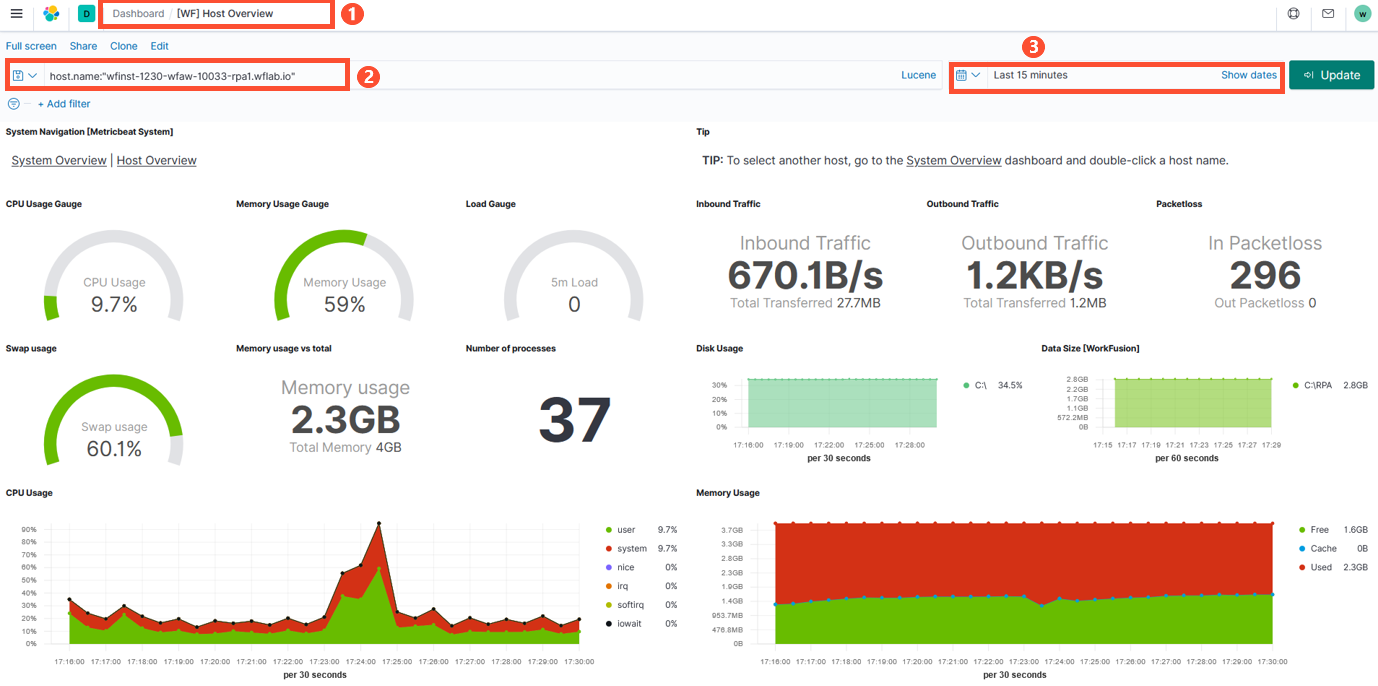
Set the filter by adding the DNS name of your RPA server, for instance, host.name:"wfinst-1230-wfaw-10033-rpa1.wflab.io".
Review the CPU and memory load indicators over the required time range. You are free to change the default period from Last 15 minutes to another value.
Additionally, look for traces of high disk or network loads and identify which processes take most of the resources.
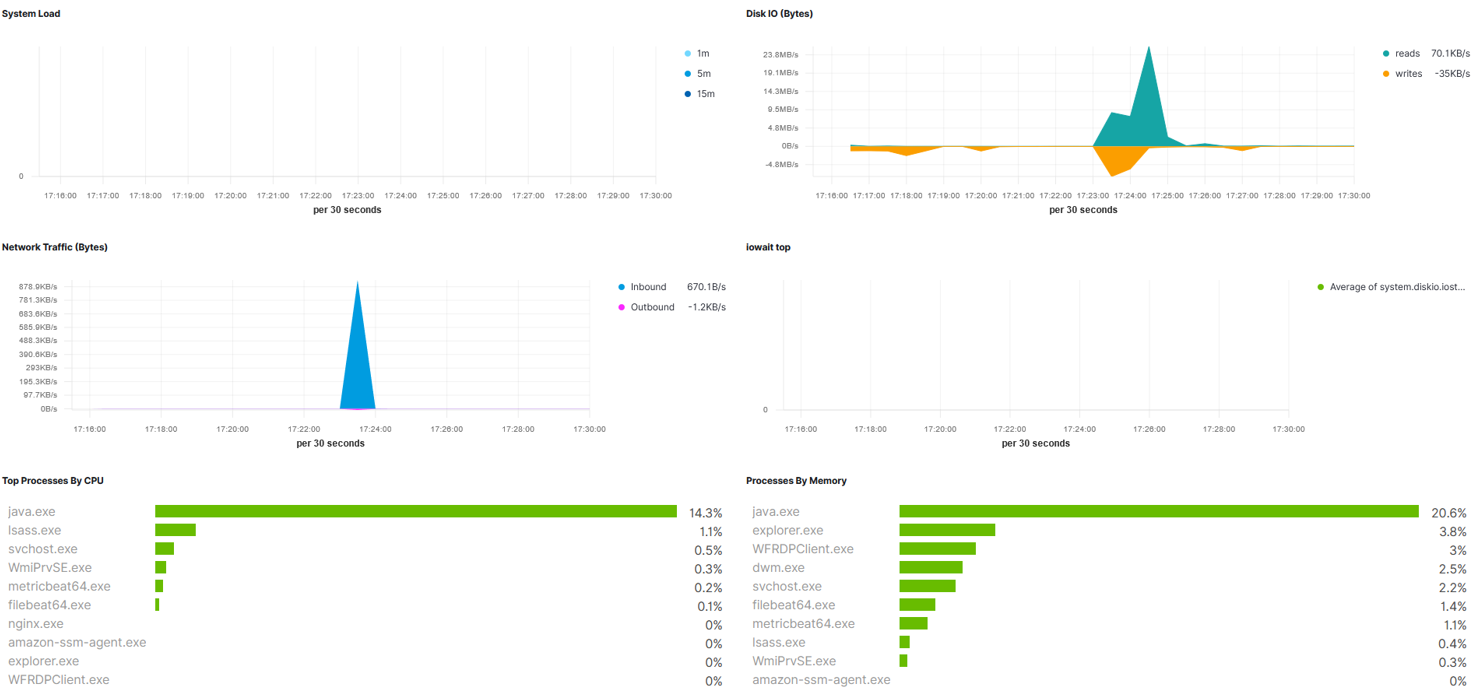
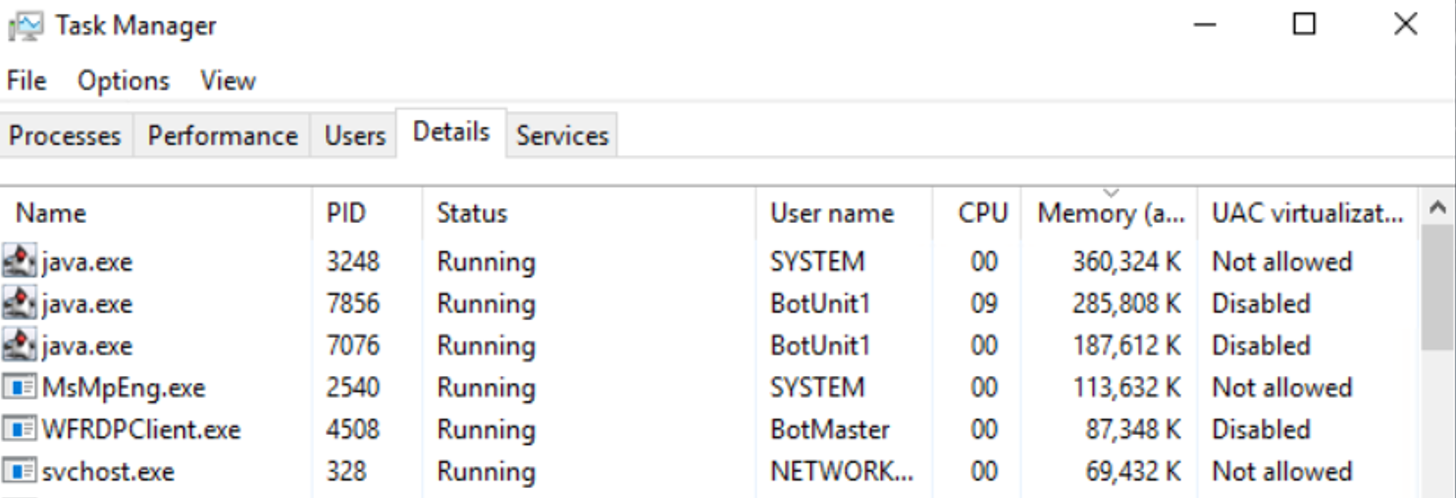
Alternatively, to determine the current RPA server load, connect to the server as Administrator and check the load in Task Manager:
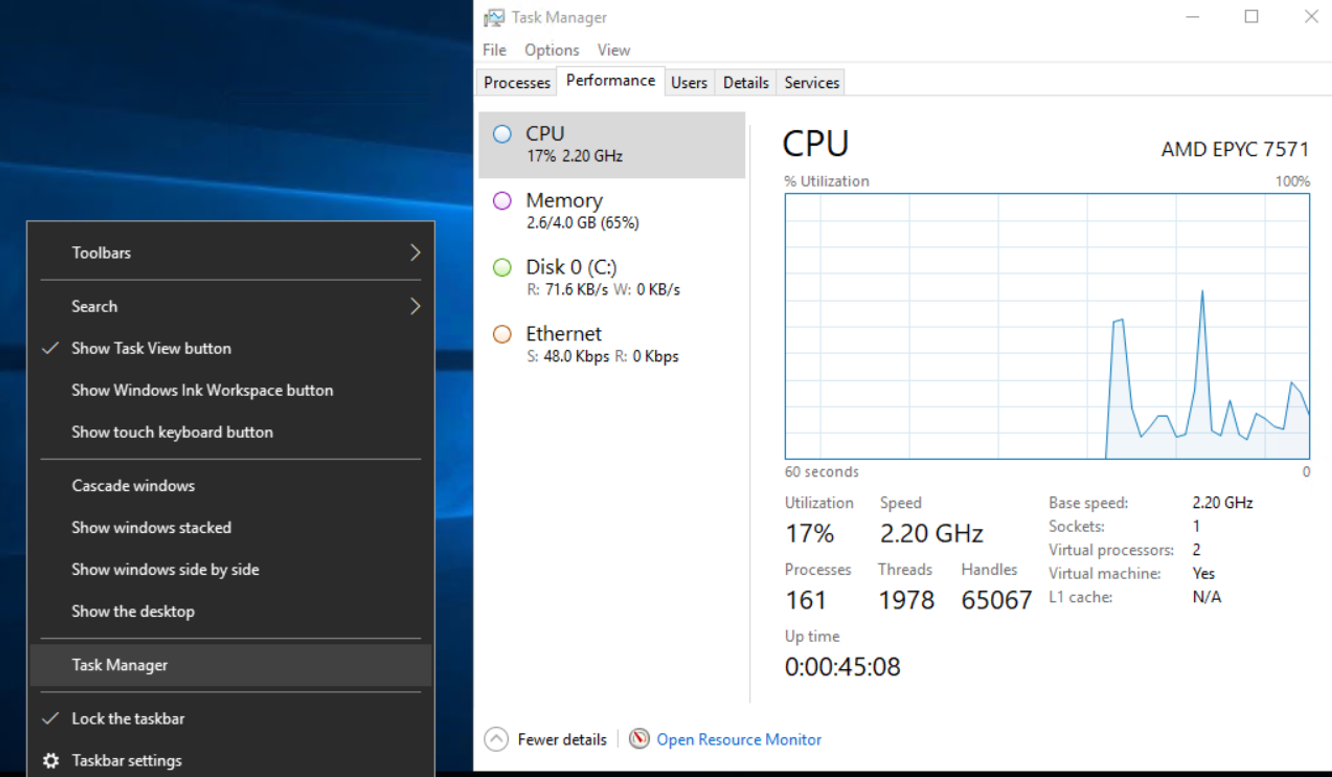
When the load is high, you can find most of the memory or CPU consumption resources by appropriate column filtering:
Run checks
The following checks are essential:
Check the RPA system configuration. Make sure you use a proper installation type and units.
Check if you have enough hardware resources to match the RPA server requirements.
Output
After confirming the issue, change the server configuration accordingly. Otherwise, continue the investigation.
Review Bot Manager
In Control Tower, open Bot Manager and check that all RPA servers and required Bot Units are available. For details and instructions, read Work with Bot Manager.