Issues related to CT performance
Issues related to Control Tower (CT) performance include slow step transition, slow result processing, and the like. In general, slow CT jobs can result from high memory consumption (swap) and CPU utilization on the CT side.
To investigate, act as follows:
Trace operational delays
To check for delays in CT operation, go to Kibana and open the Tasks trace by Business Process identifier dashboard. If your suspicions are true, the graph for Client: Task Transition (how much time a client spends to process the current result and generate a new input item) should look as illustrated below:
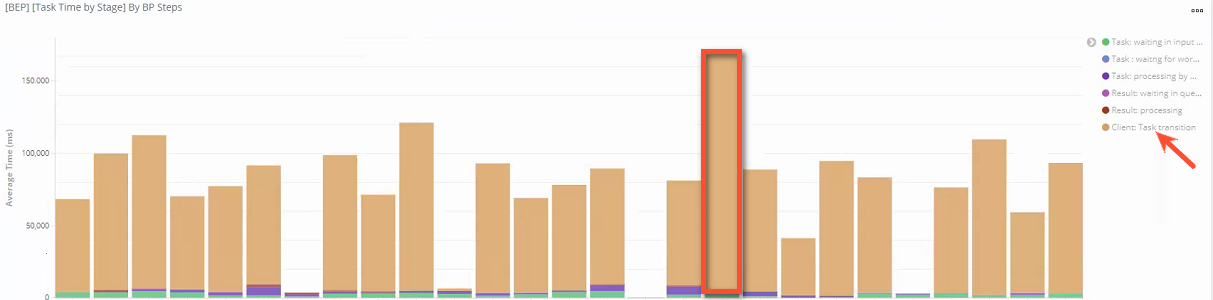
Also, the Result: waiting in queue (how much time a task is waiting in the result queue before the client begins to process it) and Result: processing by client app (how much time the client app processes a task) graphs can be higher than on the screenshot above. This means there are processing issues on the CT or client's app side.
Check system and hardware performance
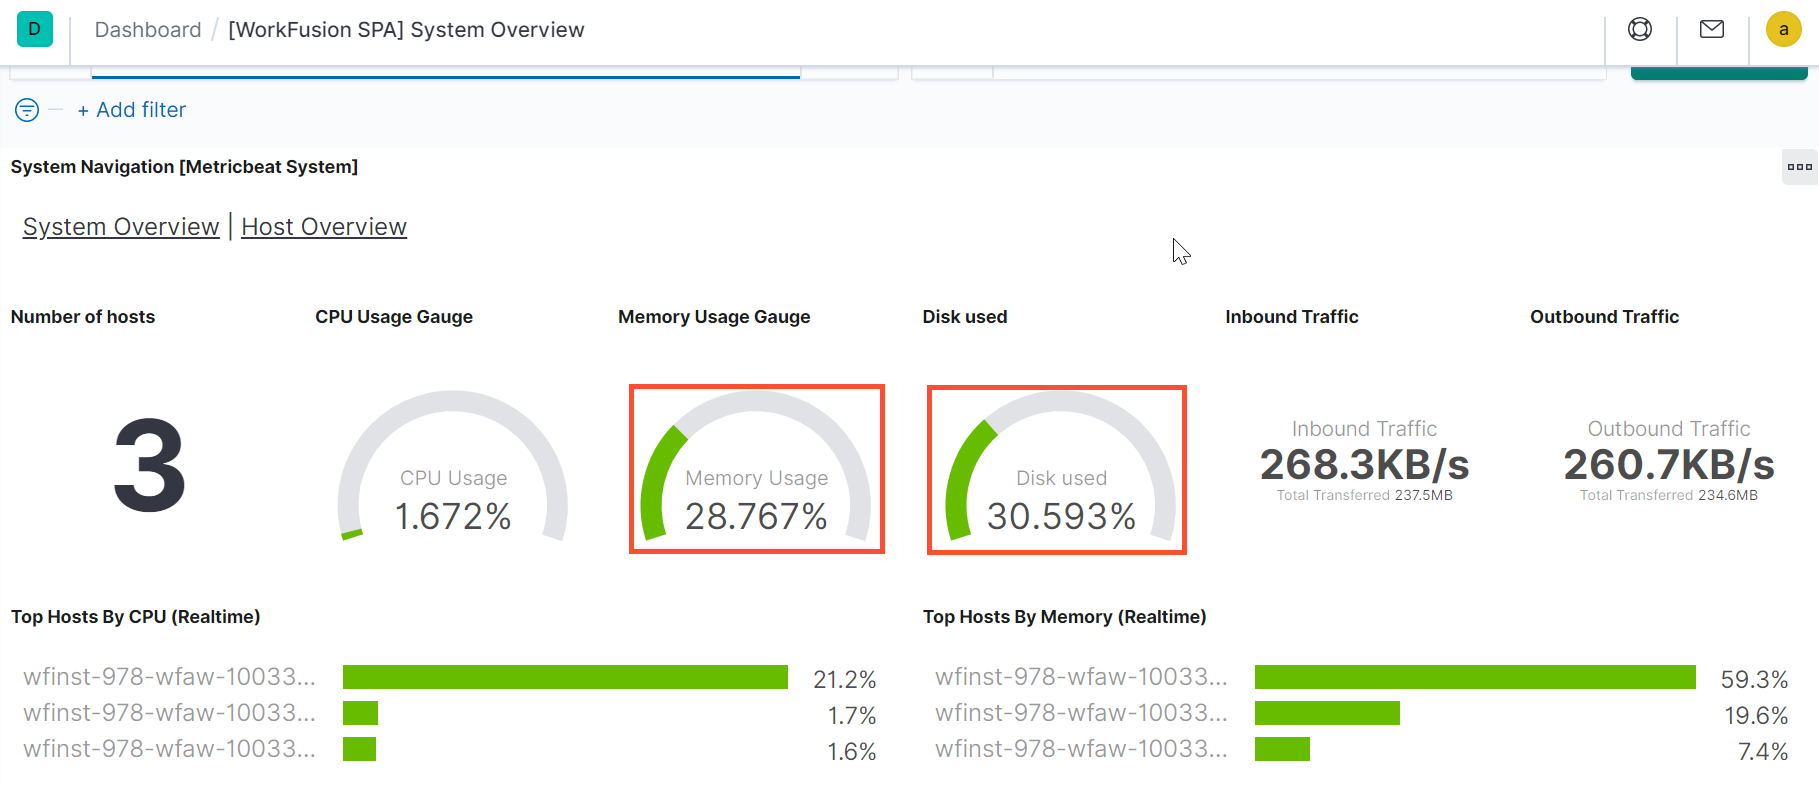
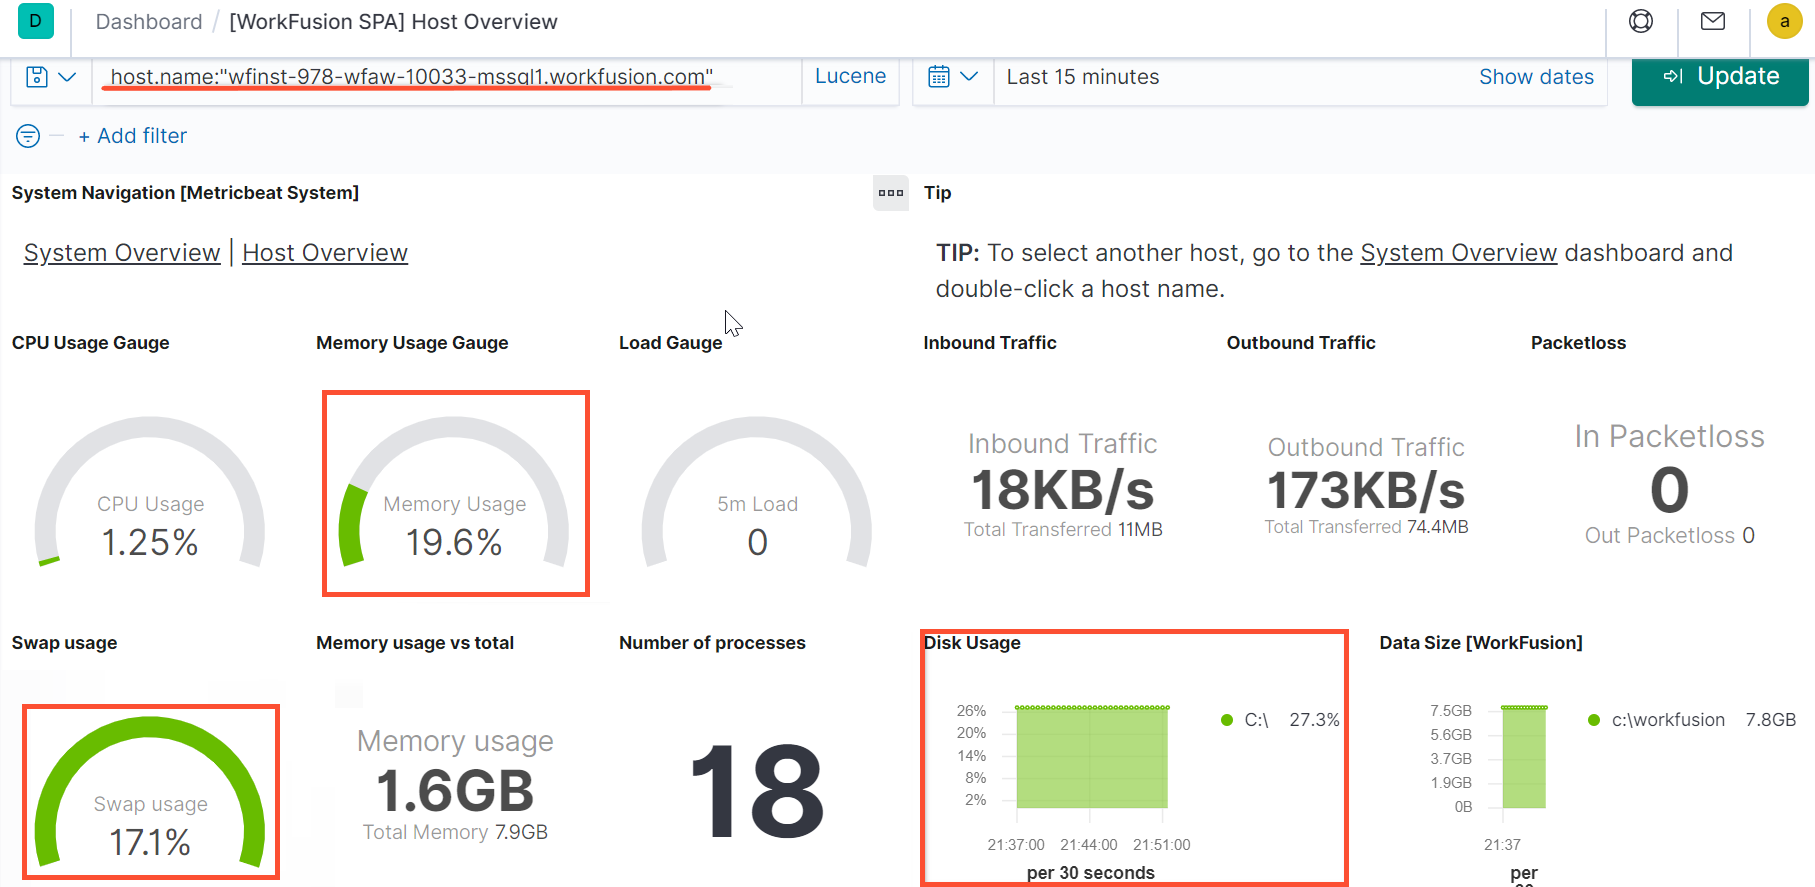
In Kibana, check the System Overview and Host Overview dashboards for CPU, memory, disk space usage, inputs, and outputs for the application host and database. If you notice any problems, such as high CPU utilization, massive network IO processes, lack of disk space, significant swap usage, create a support ticket.
Review execution metrics
Review performanceMetrics.log to trace any delays in CT job execution. You can find it on the APP server in wf_install_folder'/workfusion/logs/. The log makes it possible to see the time and throughput metrics for internal CT services. Try matching the timestamps and metrics to the periods when performance problems were observed.
Output
If you confirm the issue, gather the following stats and attach them to the created support ticket:
Thread dumps of the WorkFusion service. For details and instructions, refer to Analyze Thread Dump. Note that to get thread dumps, you need SSH access.
workfusion.out.logtogether with data on the frequency of creating task queues and sending messages. In the log, you can come across similar messages:"2021-03-24 00:00:21.374 INFO [bp-[79131]-bot-task-processing-79131] c.w.s.c.e.client.QueueTaskChannel : Created task channel, id=5f7edbad-107e-426f-8291-68aadfb7d1b4"The messages allow tracing the creation of task queues in RabbitMQ. Let's say you have a lot of input data (a substantial number of records), but there is no movement in your BP. In this case,
workfusion.out.logcan tell us that task queues are created rarely. This means there is a blocker either on the CT or RabbitMQ side because the CT service is responsible for creating task queues.performanceMetrics.logError message traces from Kibana
Control Tower uptime
In case you found no evidence to confirm the issue, continue the investigation.
View also