
People. Manage performance
In this section, you will learn about the human factor impact on Business Processes and the main principles of dealing with associated bottlenecks.
Analytics tools can help you identify gaps in productivity, assess workload, and understand the actual productivity of workers. Your basic path is as follows:
- Learn about the problem.
- Use tools to understand the reasons behind the problem.
- Analyze the reasons.
- Implement changes to the process.
Problem: manage team
Managing the team is a balancing act between achieving great business results and ensuring people are satisfied with their work and have enough time for creativity and innovation.
As an operations manager, when you're analyzing the impact of the workforce on process results, you have four main areas to track:
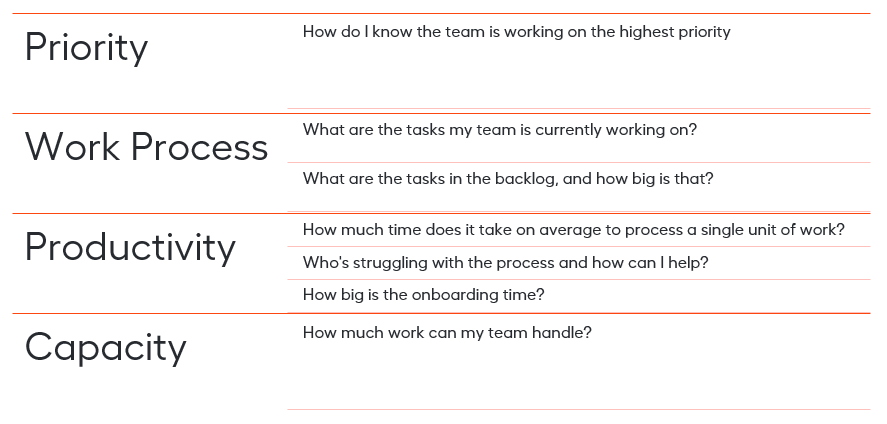
To understand the problem better, find the answers to the above questions. For that, you need specific Analytics tools that can provide a broader picture and help you come up with the most appropriate actions.
Tools
The main tools to help you investigate the problem are as follows:
-
Critical indicators of work efficiency
Analysis of the workload distribution
Custom dashboards and Reporting API
Slide-and-dice analysis of the worker performance across any dimension
-
- Workload analysis for a single worker
- A detailed review of the worker's activities
Solution: what to look for
Assess workload distribution
You have to monitor the operators' workload closely because, eventually, a heavy workload leads to less efficiency and consumes energy away from creative thinking.
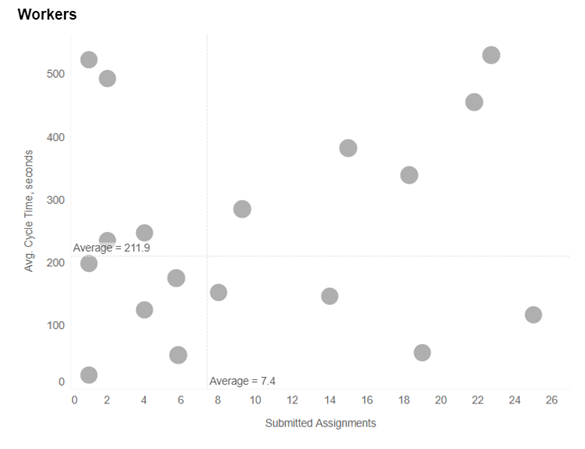
The Workers widget in the Manual dashboard is a powerful tool to show the correlation between the volume of assignments and average cycle time per worker. With the widget, you can also understand the average workload or cycle time and balance it.
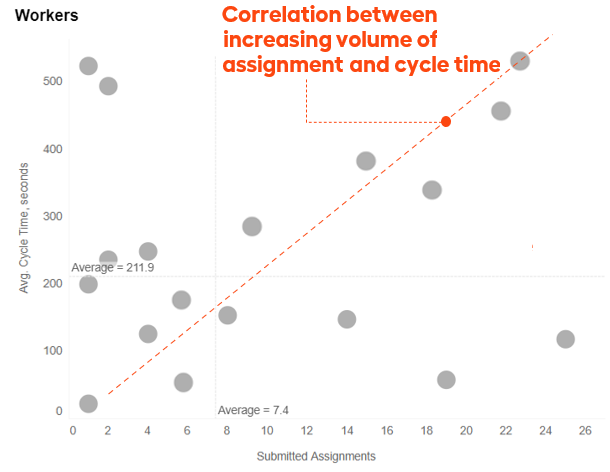
The example shows a pattern of the average cycle time growing with the number of assignments submitted by the worker. This is a symptom you may want to investigate to identify the root causes. Typically, you wouldn't expect the volume of work processed by the worker to have a linear effect on the time needed to complete each assignment. Depending on the case, there can be different actions:
- Re-assign work from heavily loaded operators to less busy ones.
- Train additionally those workers who are less efficient.
- Control the quality of work in cases with extraordinarily high performance.
Lessons to learn
- Unbalanced distribution of workloads among workers decreases overall performance.
- If the average workload or cycle time exceeds approved limits, change the process to balance the load.
Identify potential skill gaps and find champions
The Workers widget is designed to identify segments of workers based on their productivity and suggest the most relevant improvements.
The picture below shows an example of how workers can be grouped into four segments based on hypotheses about their productivity.
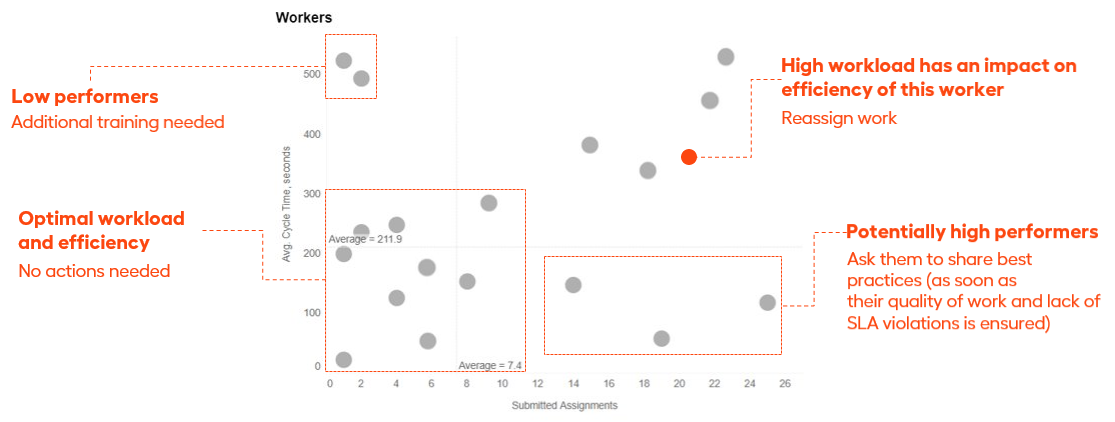
The segments are as follows:
- High performers are your champions with a significant volume of submitted assignments and short cycle time.
- Low performers have long cycle times and a small volume of submitted assignments.
- Some workers have an optimal balance of the workload.
- Other workers see their productivity impacted by the volume of assigned and submitted assignments.
Validate each of the hypotheses further. As you confirm any of them, you can do the following:
| Hypothetical Segment | Next steps |
|---|---|
| High performers |
|
| Low performers |
|
| Workers impacted by the volume of assignments |
|
Suppose, you want to conduct a more in-depth analysis of the high performers' productivity. In that case, you can select the workers in the widget (each dot represents a worker) and look through the detailed stats in the Worker Details table.
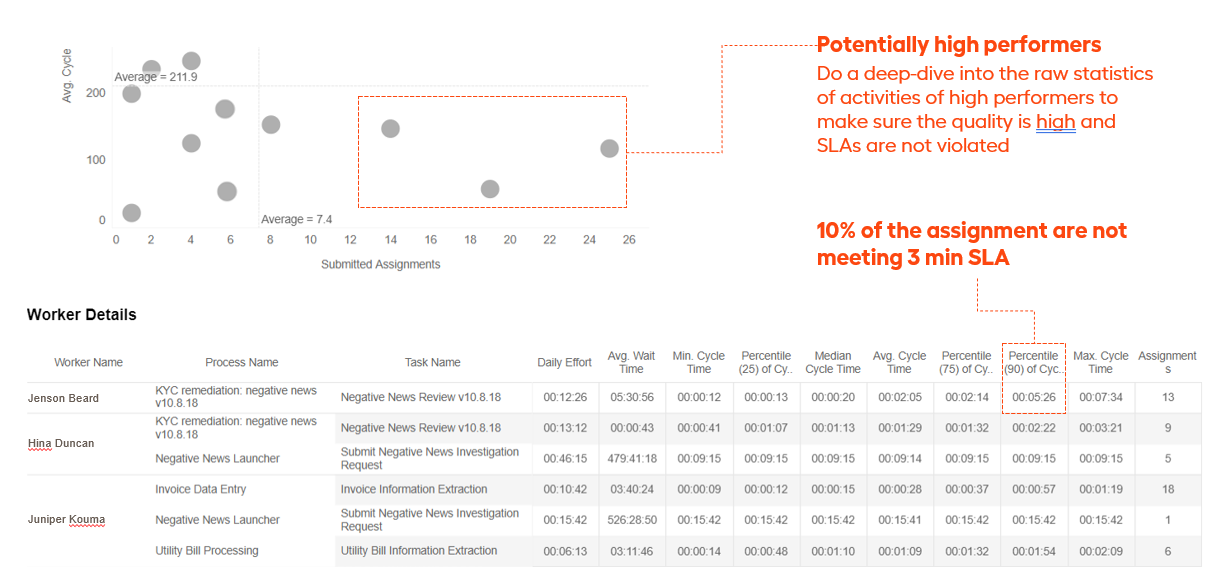
You can see that one of the three workers has very high productivity. However, according to the Worker Details table, 10% of the assignments for Jenson Beard are not meeting the three-minute Service Level Agreement (SLA). It means the worker cannot handle the workload efficiently and should accept fewer tasks to maintain high quality and meet SLAs.
Lessons to learn
- The dashboard helps you classify workers into four performance groups. This allows you to focus on workers with low efficiency and helps identify reasons for limited productivity.
- When you find reasons behind the low performance, it is important to implement changes sparingly and individually.
Understand worker productivity
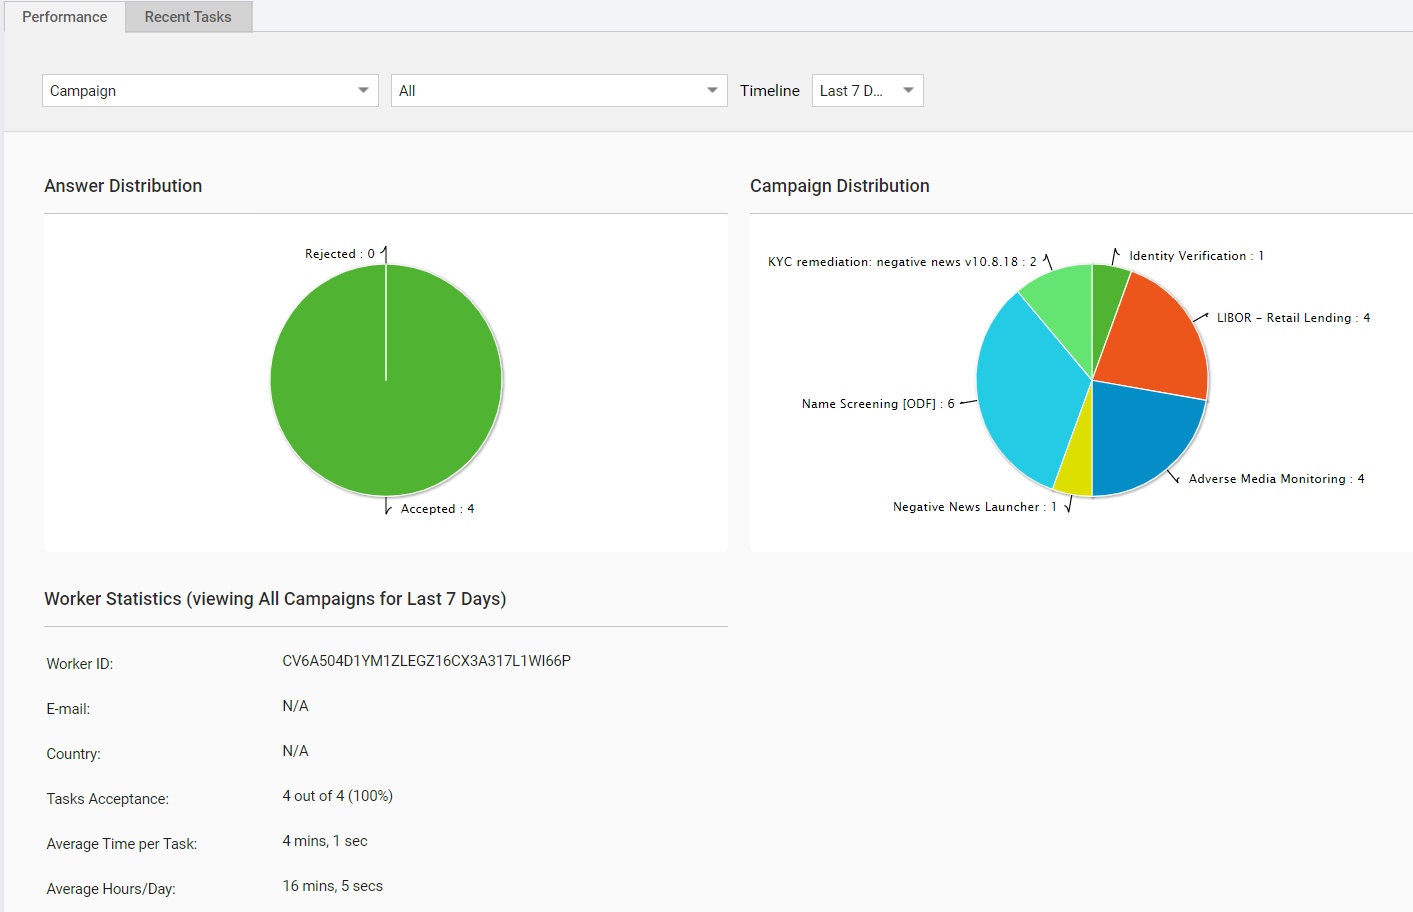
Use worker profiles to view the latest tasks performed by workers and get a summary of key performance indicators for the manual work:
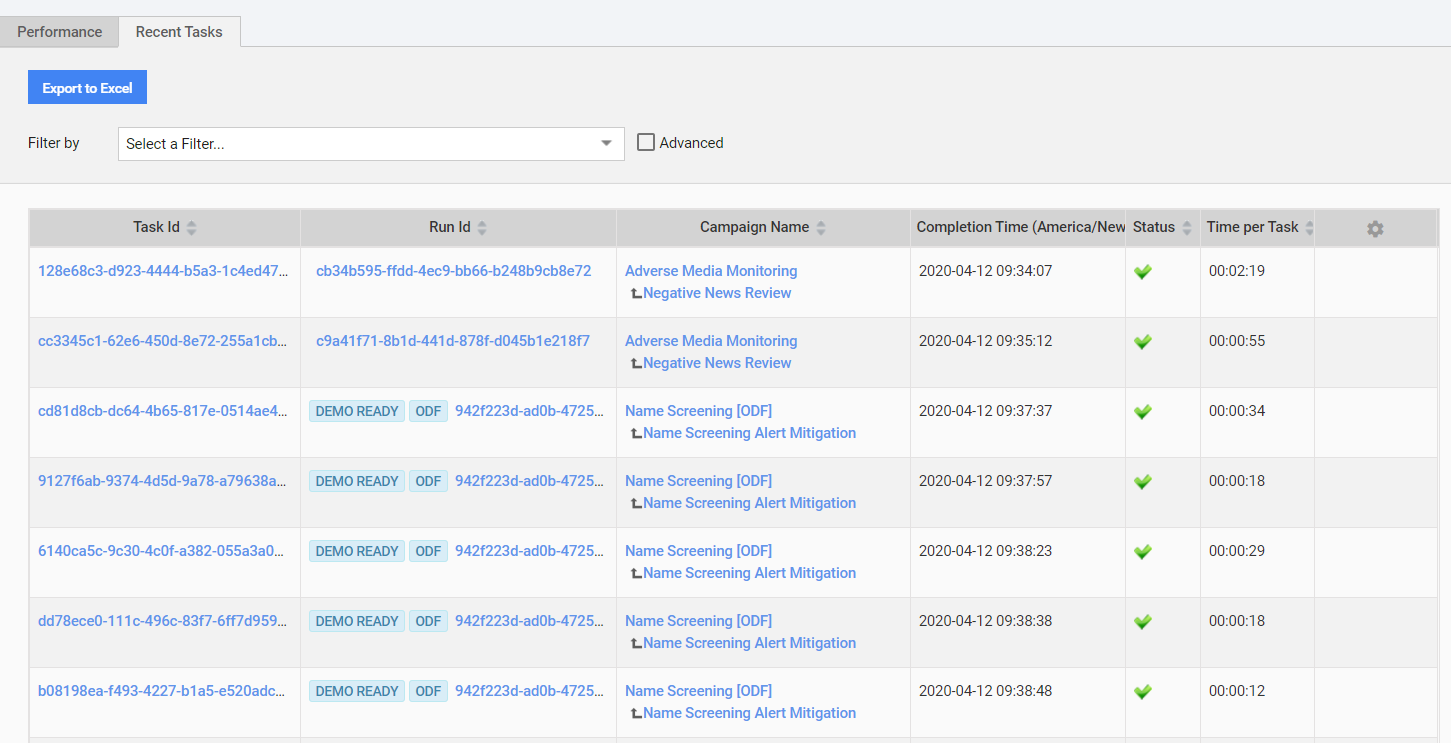
From the worker's profile, you can proceed to the log of assignments accepted and processed by the worker and drill down to the task results:
Lessons to learn
Detailed results of performed tasks provide a broader picture and hints for improvements.
Measure onboarding time
Onboarding time is one of the aspects to keep in mind when you analyze the workforce and productivity.
You can define and measure onboarding time using the following approach:
- Define the goal cycle time for your workers. It can be based on the average cycle time across your top performers or all workers.
- Look at how many assignments a worker needs to complete to acheive that efficiency goal.
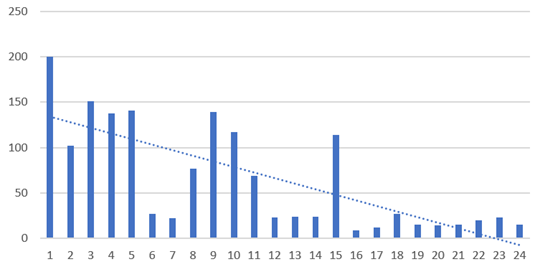
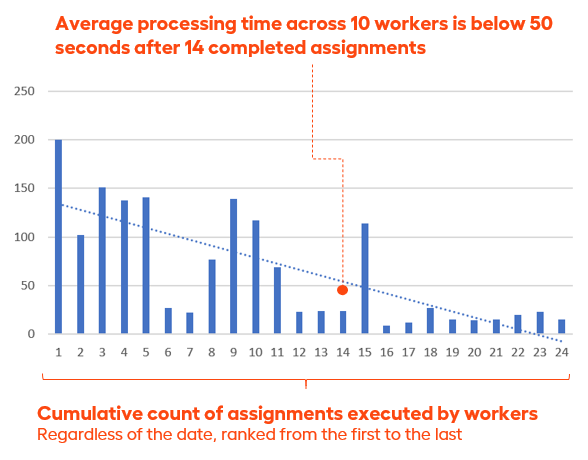
Use Reporting API to pull all assignments executed by operators. They should be ranked sequentially from their first-ever assignment to the latest task. After that, you can group assignments by rank to find the average execution time:
How should I act?
- Very long onboarding time across all workers is an indication that you need to improve user experience.
- Very long onboarding time for a single worker is an indication that additional training or help is needed. For example, the diagram shows that processing time over 100 seconds after 50 completed assignments means that a worker needs assistance or additional training.
Lessons to learn
- Reporting API is a great tool to observe the progress of a worker over a specific period and to determine the average task execution time.
- Set the optimal efficiency goal for each worker individually.
- Increased onboarding time indicates that there is still significant scope for improvement.
Make sure people work on proper activity
Operators working on a wrong priority is one of the typical reasons for missed deadlines and violated SLAs. There are multiple ways to understand what operators are processing:
Filter the Manual dashboard by timeframe (for example, last day).
See how much time each worker spends on different tasks and how many assignments they complete.
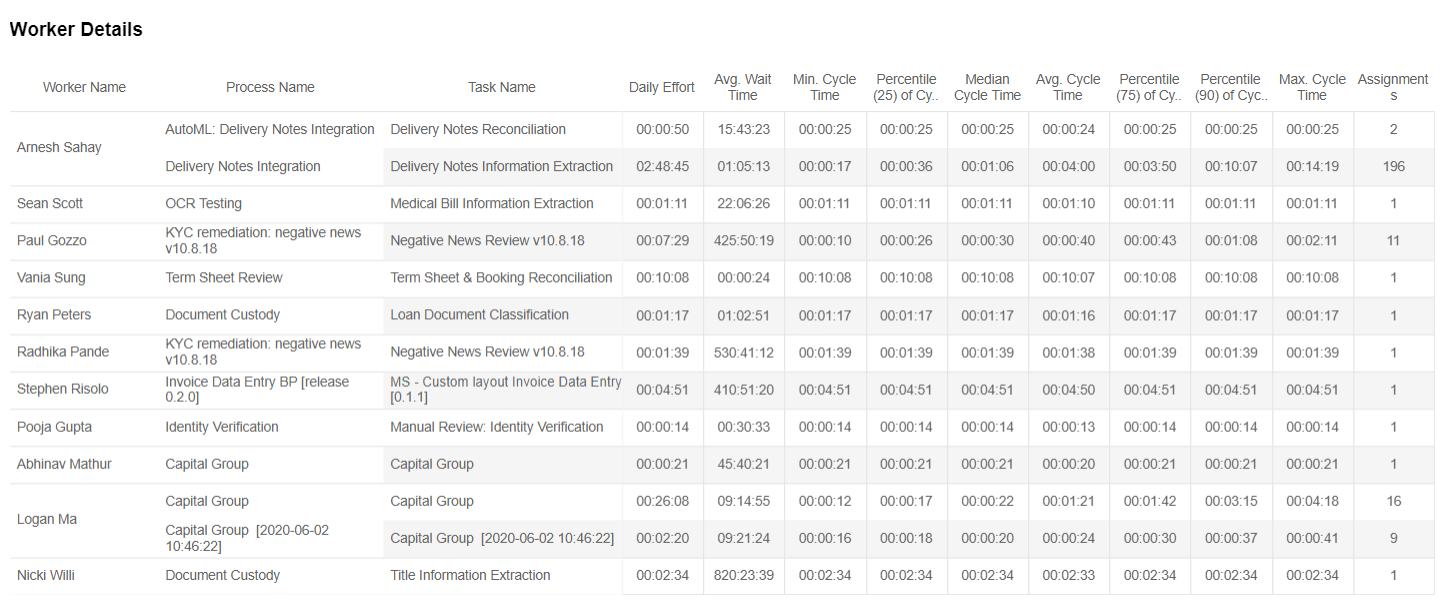
Track the volume of assignments and time spent on them per worker on a timeline either on a daily or hourly basis. This is another efficient way to identify wrong prioritization cases. The custom report below is based on Reporting API:
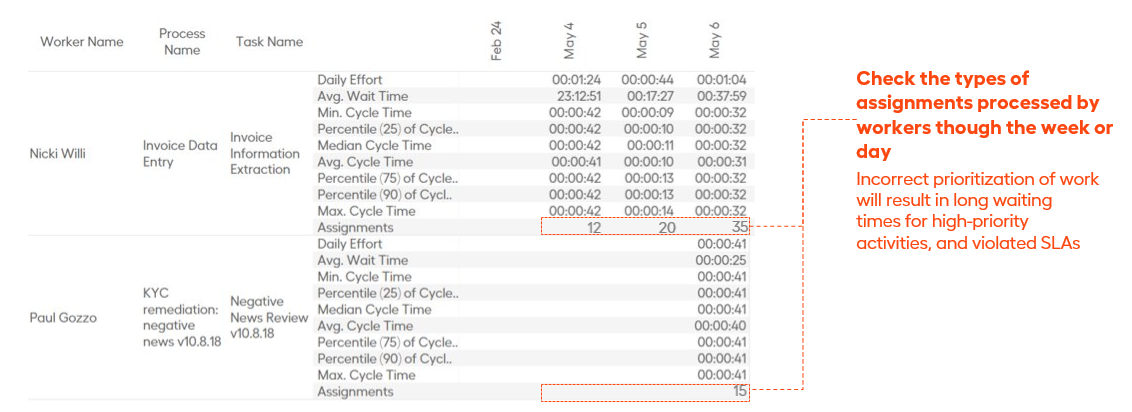
In the figure above, Invoice Information Extraction is the highest priority activity. However, Hana Duncan is working on some other tasks.
Lessons to learn
- Incorrectly assigned priorities can cause SLA violations and performance gaps.
- To find wrong priorities, analyze the amount of time a worker spends on a task and overall work volume.
Summary
Based on the content of the article, you can use the WorkFusion Analytics capability to accomplish the following in terms of your workforce management:
- Analyze workers' performance using dashboards, custom reports, Reporting API, and worker profiles.
- Maintain a balanced workers' workload.
- Determine workers with low efficiency and find reasons behind that.
- Adapt the process for each worker to decrease the onboarding time.
- Set correct priorities explicitly.