
Speed
The Speed dashboard helps to identify process execution bottlenecks. It provides detailed information on transaction processing, work type, and task levels. Its main metrics are as follows:
- Processing Time
- Wait Time
- Volume
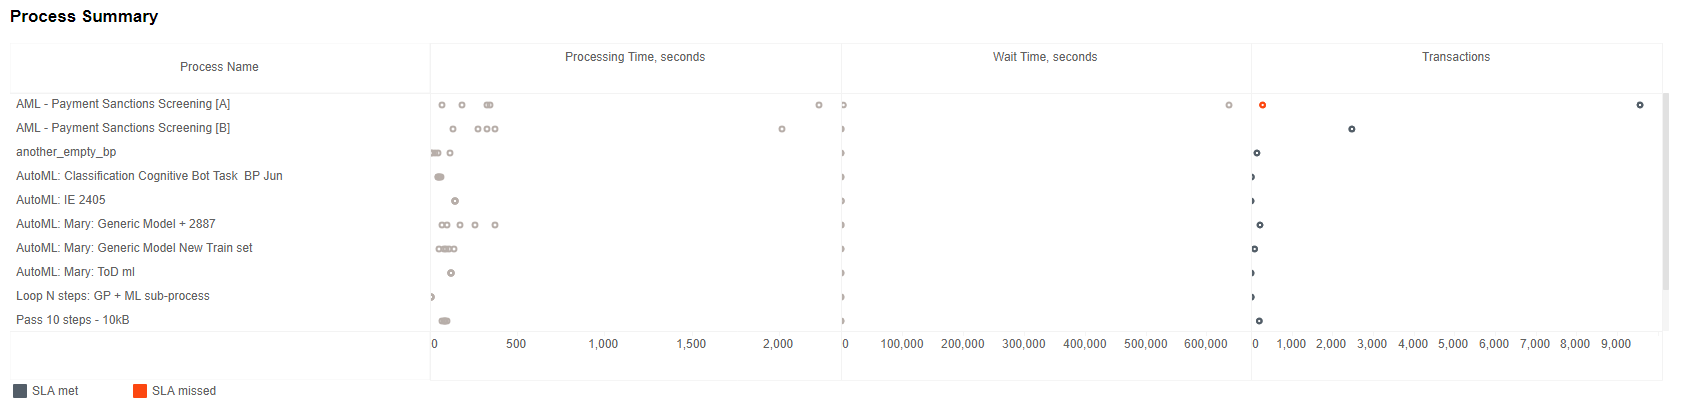
Process Summary
The Process Summary chart makes it possible to monitor the execution speed. It contains data on end-to-end Processing Time and Wait Time per transaction along with the number of transactions per process meeting or missing SLA.
Breakdown Summary
The Breakdown Summary chart helps to find out the following:
- Which task types took most of the processing time.
- How long the processing lasted.
- What volume of tasks is handled within a process execution.

The chart contains data on the end-to-end Processing Time and Wait Time per transaction along with the number of transactions per work type.
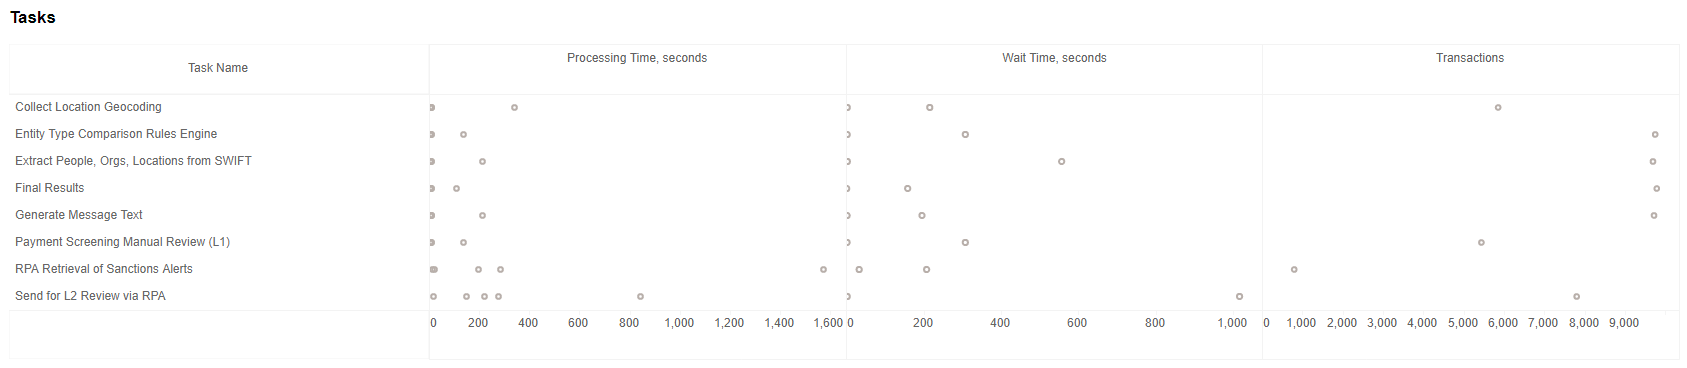
Tasks
The chart contains data on the end-to-end Processing Time and Wait Time per transaction along with the number of transactions per task.
Task Execution Details
The table provides a detailed distribution of the transaction cycle time per task in seconds. All tasks are split into two groups:
- Tracked
- Untracked tasks (excluded or about to be tracked)
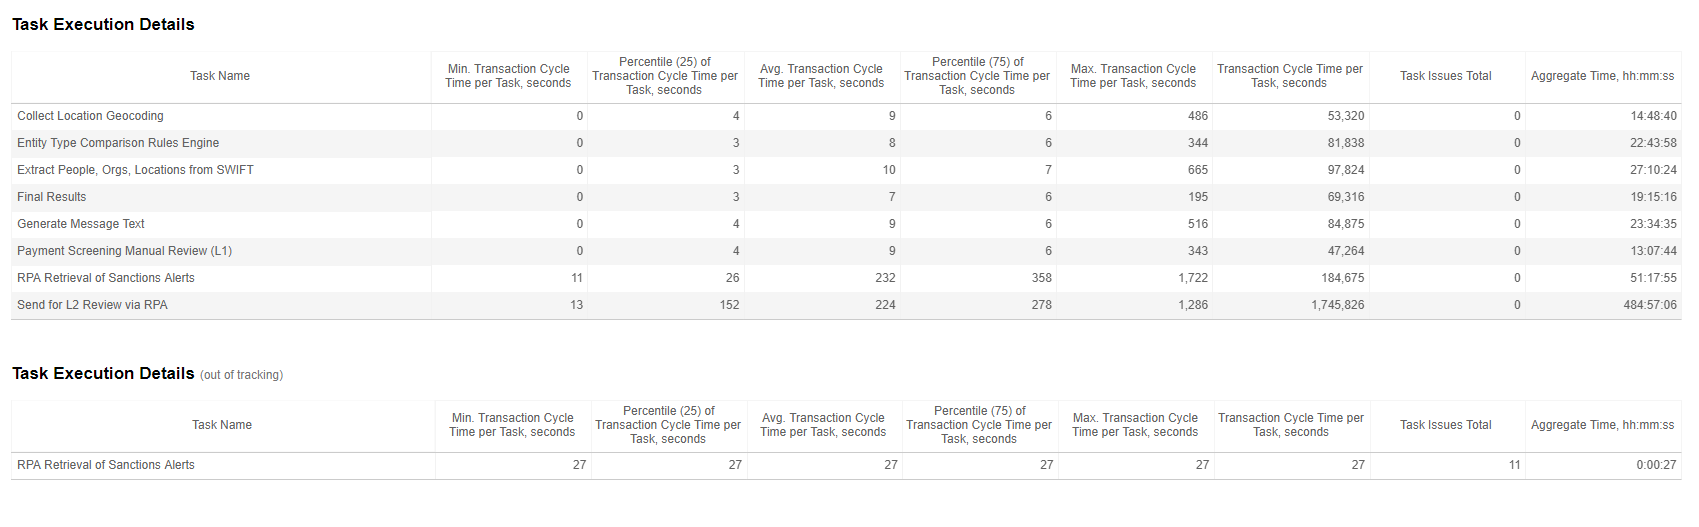
For a Business Process without Transaction Tracking enabled, all transactions in a process execution are categorized as tracked by default. In case you want only specific steps to be tracked, enable Transaction Tracking for them. After that, transactions for the rest of the steps will appear in the out-of-tracking table.