Business Process progress Excel Graph
You can visualize what happened on the server and see how hits progress through the Business Process (BP) steps. Follow the instruction below:
- Download the Excel template: ServerLoadAnalysis.xlsx.
- Follow the instructions on the first page of that Excel:
- Execute the SQL query against the MySQL database.
- Import the data to Excel.
- Specify what BP steps you want to be displayed on the graph.
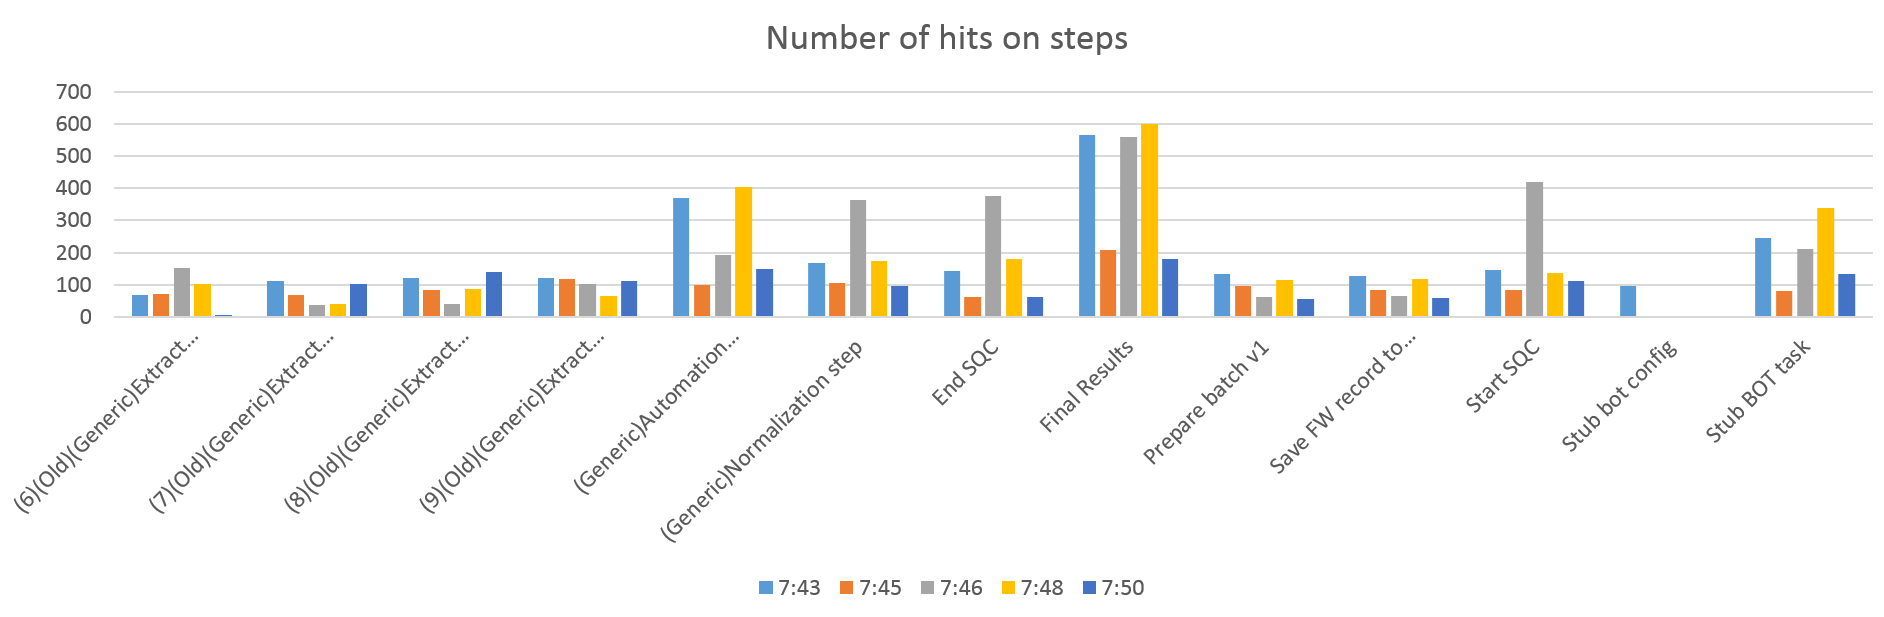
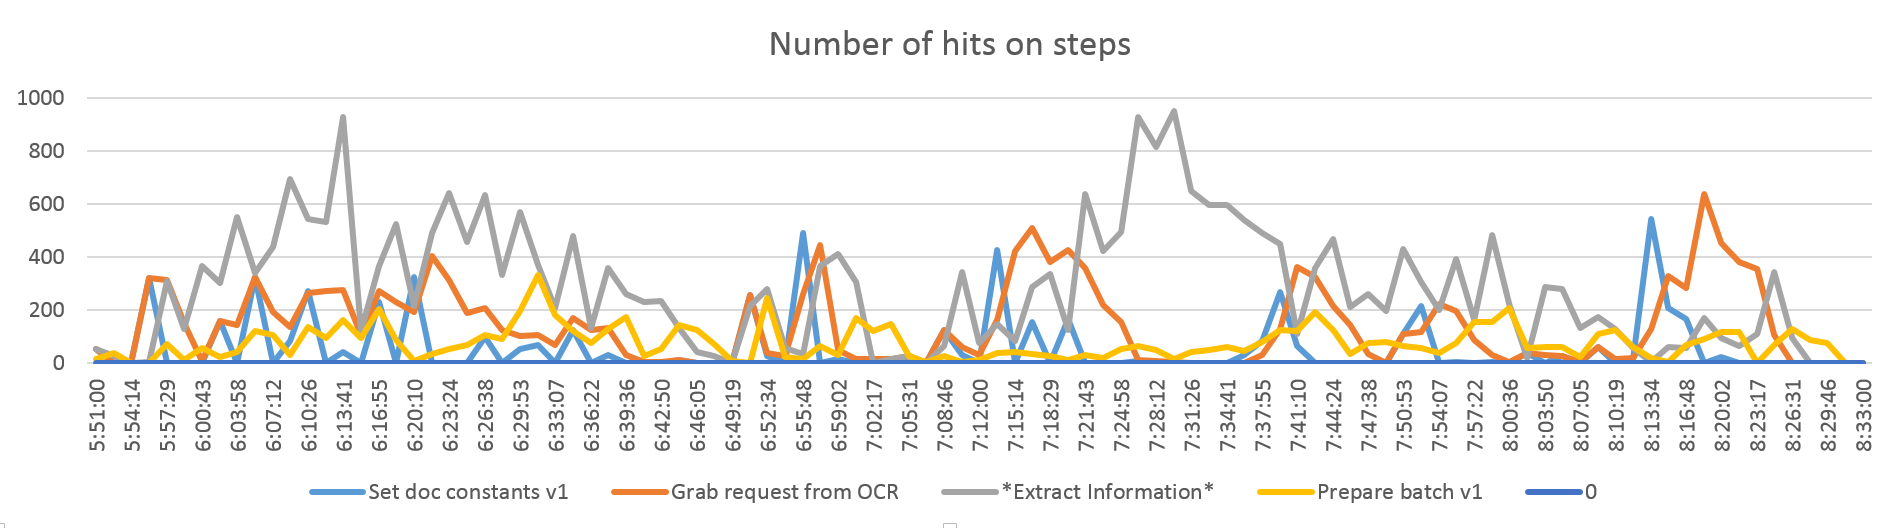
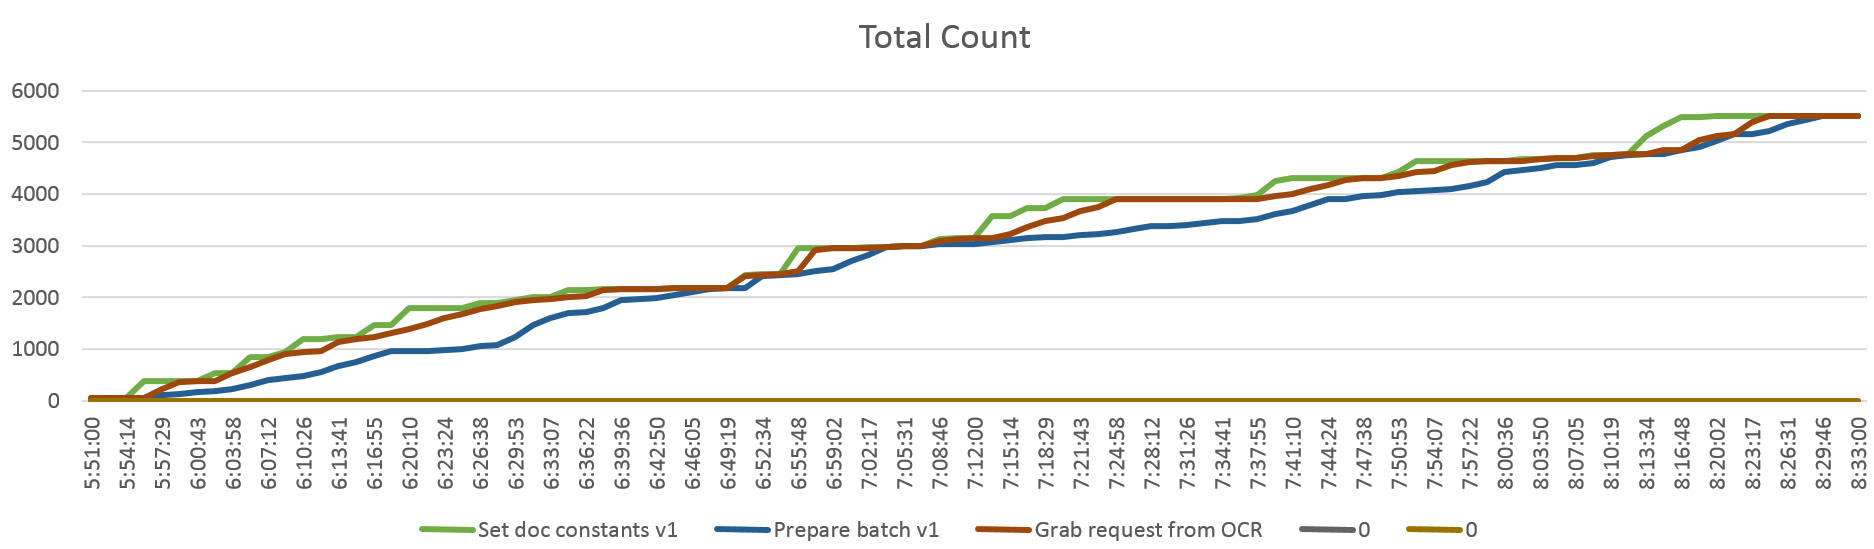
As a result, you can get the graphs looking like the ones below:
A graph that displays the number of hits on selected steps:
A graph that displays the total number of hits that are completed by selected steps:
A detailed analysis of what happened at a specific time: