Process. Manage throughput and bottlenecks
The main goal of the article is to help you identify and analyze the weak spots in your Business Process (BP) implementations using legacy Tableau-based analytics. You will also learn about the primary causes of bottlenecks and get acquainted with the tools and solutions to address them.
Learn about problem
Define bottleneck
In its simplest definition, a process bottleneck is a work stage that gets more work requests than it can handle at its maximum throughput capacity. This causes an interruption to the flow of work and delays across production.
In other words, even if the work stage operates at its maximum capacity, it still can’t process all of the work items quickly enough to push them to subsequent stages without delay. The process bottleneck can be a technology, a person, or an implementation element.
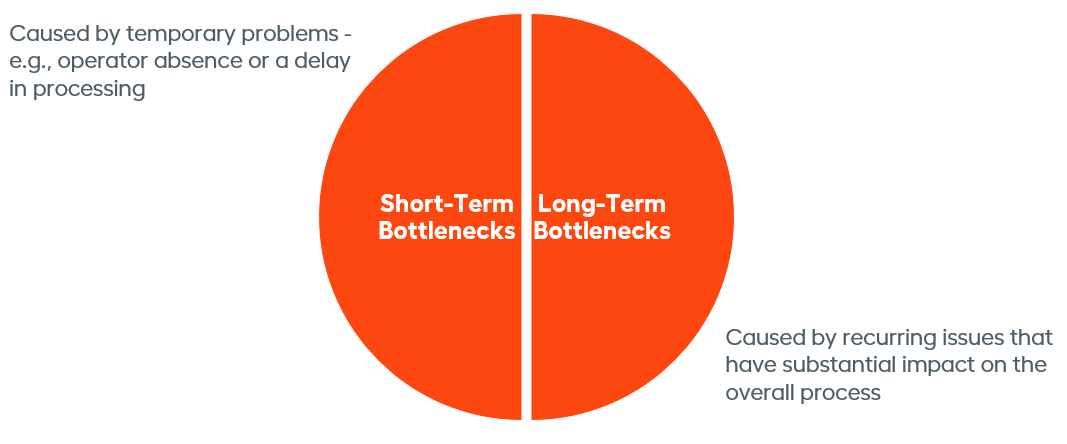
There are both short and long-term bottlenecks. Short-term ones are temporary and are not usually a significant problem. An example of a short-term bottleneck is a skilled employee taking a few days off.
Long-term bottlenecks occur all the time and, in the long run, can significantly slow down production. An example of a long-term bottleneck is when a process stage implementation is not efficient enough and, as a result, has a long queue.
Unfortunately, a bottleneck is often acknowledged only after it has caused a workflow blockage. There are simple yet effective analysis tools that can help prevent work congestion and spot an existing bottleneck, and those are described further. But first, let's clarify the definition of time in a BP.
Identify problem
Major reasons to automate any manual work are to increase speed and avoid human-specific flaws. The next step after automating work is improving it—that's where monitoring and Analytics can identify bottlenecks affecting overall performance.
Example:
Below is a map of a process to identify a customer using different types of ID documents (passport, driver's license, tax documents, and so on).
Most of the steps don't take much time to execute—from one to two seconds. However, when information extraction also requires some manual work, the processing of a single unit of work (one customer identity) can take 38 seconds.
The long duration of a manual step affects the overall BP throughput, which is the volume of customer identities you can verify. This can have a negative effect on the overall customer experience.
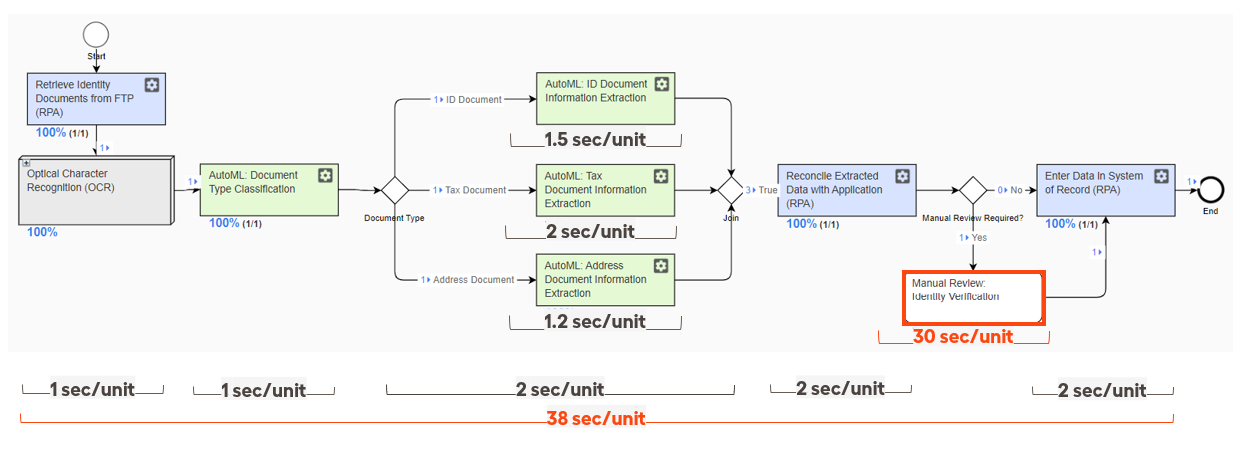
Every process is only as robust as its weakest step. The weakest step is a constraint. The goal of the process owner is to identify bottlenecks and eliminate them.
In the example above, once you have identified the weakest step is the manual review, there could be a set of actions taken:
- Ensure the information extraction is efficient. If not, take steps to improve that.
- Ensure a good customer experience with manual tasks.
- Train people who work with manual tasks.
Find solution
Understanding the time and throughput of a process are key elements that drive bottleneck analysis. WorkFusion uses techniques and the time definition from the Lean philosophy.
Lean is a philosophical approach to improving workflow and eliminating waste. It is defined as a set of tools, methods, and techniques that help identify and eliminate waste by improving a business process continuously. This principle is at the Work.AI core.
Get acquainted with tools
To perform analysis, use the following tools:
Speed or Overview and Manual dashboards
These are the primary tools to measure time, both on a step and transaction level. Read on for a detailed description.
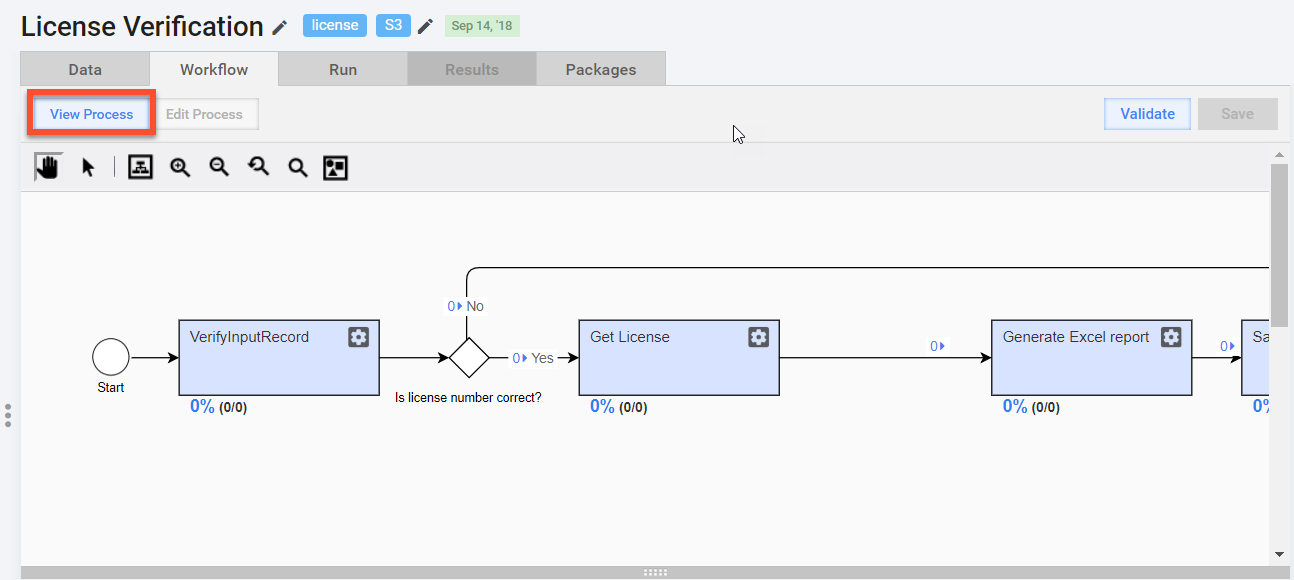
View Process mode in the Workflow Designer
Understand the process and see how documents or other entities move across its steps in real time.
Custom dashboards and Reporting API
Analyze the throughput and speed of execution across steps and on the transaction level and examine key performance indicators (KPI) across multiple dimensions.
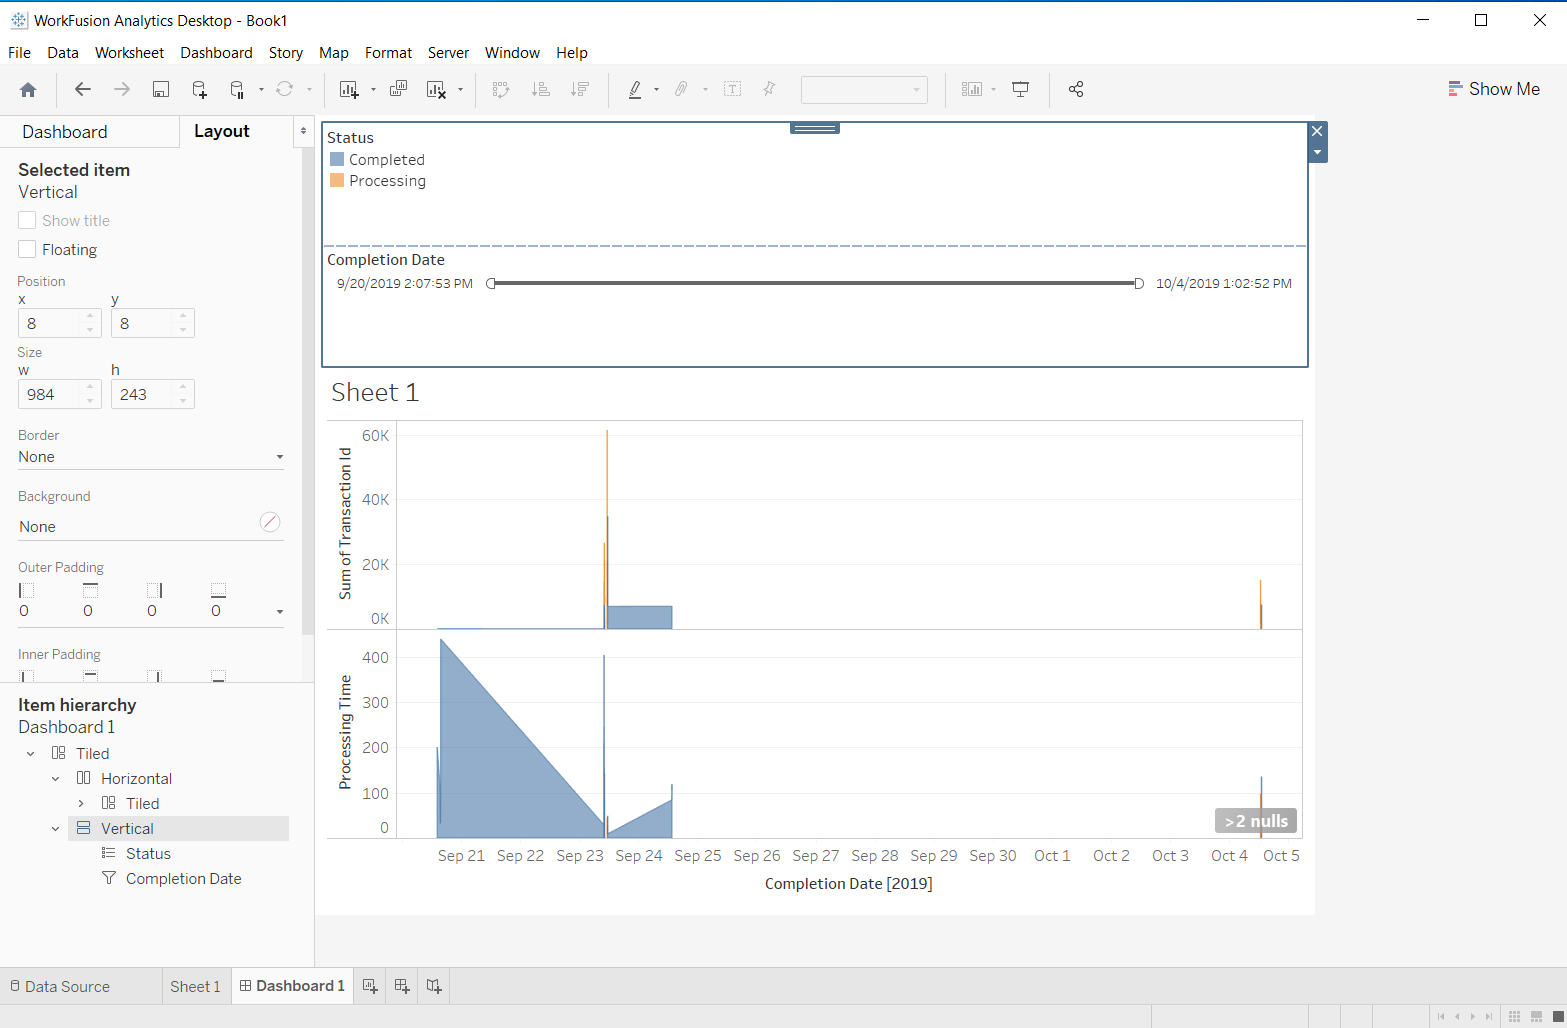
In the Speed dashboard, you can find the following metrics:
- Processing time
- Cycle time
- Wait time
- Service Level Agreement (SLA) violations
- In-progress or completed volume
The dashboard allows you to apply several formulas to assess cycle or turnaround time, including Average and Percentile.
Identify outliers with distributions and percentiles
If you have 950 transactions with a 30-second cycle time and 50 transactions with a 6-minute cycle time, your average cycle will not be too high (46.5 seconds). It might look like you're meeting your goal for an average transaction cycle time of below 1 minute. However, 5% of customers might be affected and left unsatisfied due to the unacceptably long wait time.
The problem is that average is very a misleading metric in a large population, and you should keep that in mind and use other statistical tools when you're conducting analysis.
An example is the percentiles you can find in the Speed dashboard and some other dashboards where you can conduct time analysis. A simple explanation of percentiles: 95th percentile equal to one hour for the Cycle Time means that, in 95% of cases, the Cycle Time is lower than that value.
In addition, the Speed dashboard shows in a visual way how time is distributed across processes and tasks. With that, you can easily identify outliers and their numbers and understand the impact:
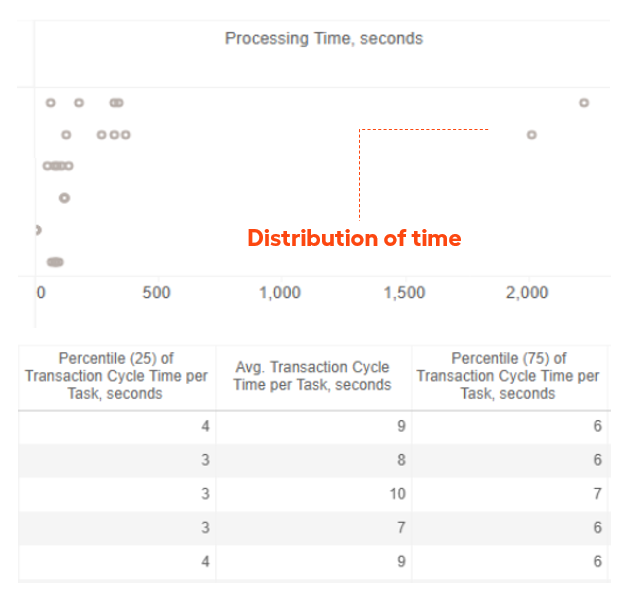
In the example above, you can see that only two transactions have been processing for more than 2,000 seconds, which is a relatively low number of outliers. Also, mind that the cycle time of 75% of the transactions across different BPs is within 7 seconds.
Additionally, you can analyze time one level deeper using Reporting API. The visualization below shows all transactions grouped into buckets by time (for example, all transactions below 320 seconds, all transactions below 640 seconds, and so on):
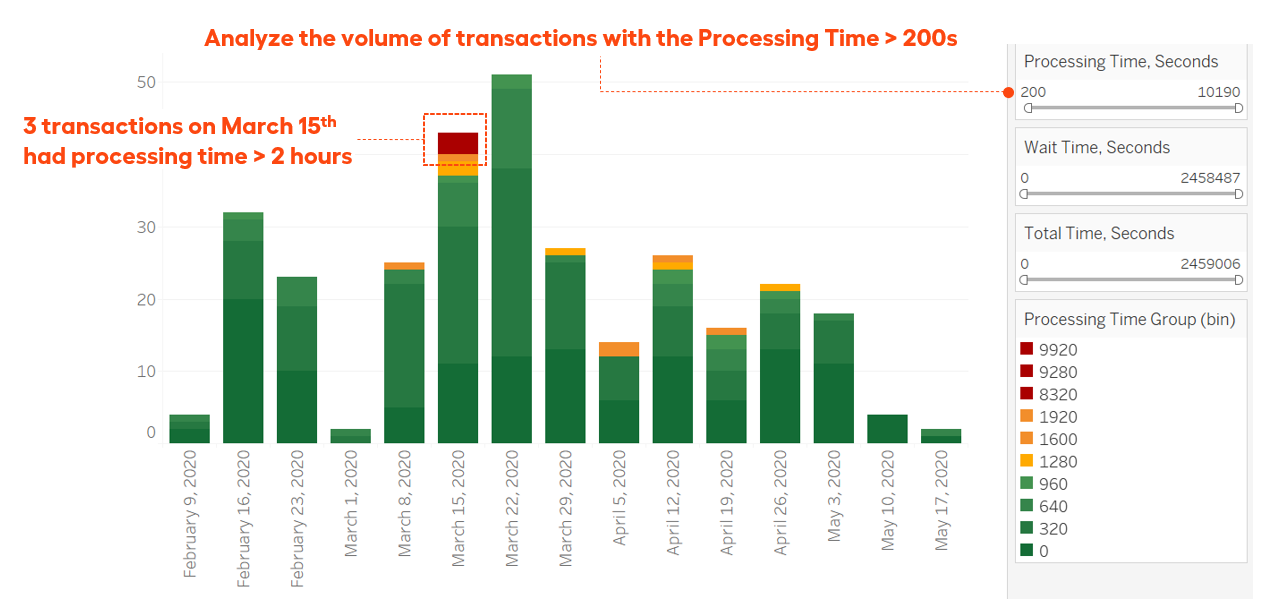
With that in a very visual format, you can see the overall impact of the transactions with a long processing time and quickly diagnose how many transactions are falling into one or another bucket (for example, transactions that take more than two hours).
The Average time metric is often used to assess cycle or turnaround time, but it can be misleading for the root cause analysis of the issues. In many cases, it is recommended to use the Percentile formula.
Transaction tracking and SLA configuration
You can explicitly configure and monitor SLA to identify violations in the cycle times of transactions.
When transaction tracking is turned on in a BP (see the Track transactions topic for detailed instructions), SLA can be measured. There are two types of SLAs:
Based on Time. Cycle time should be lower than the specified SLA value.
Based on Volume. The volume of transactions per day should be higher than the specified SLA value.
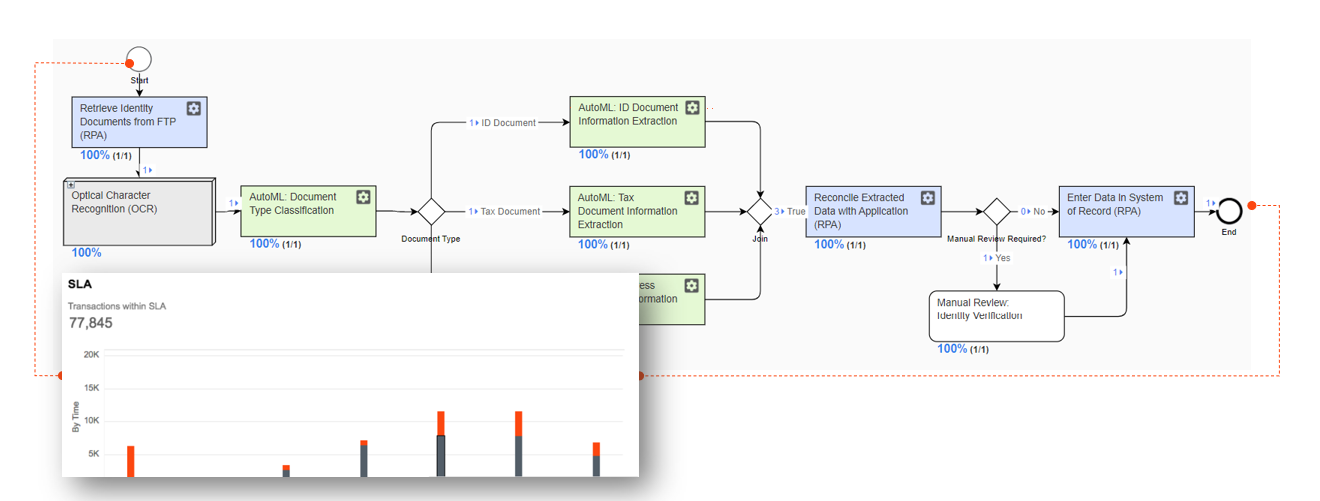
Once the SLA is applied, there is a set of tools to understand the root causes of the SLA violations:
- You can use the Process dashboard to track SLA values.
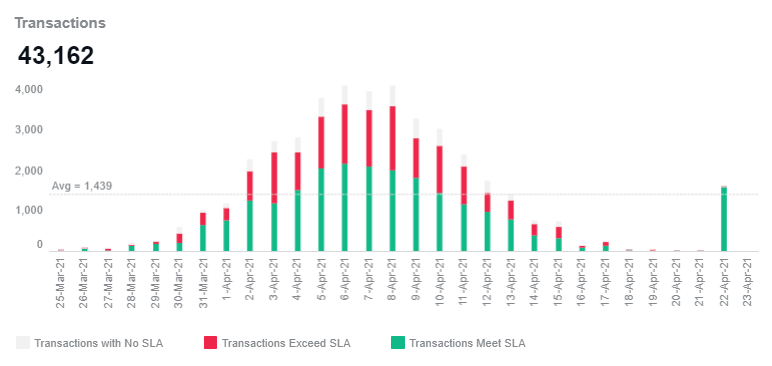
You can view the Speed dashboard to understand the Type of Work (RPA, Manual, AutoML, Control Tower) and Tasks involved in transactions that violated SLA.
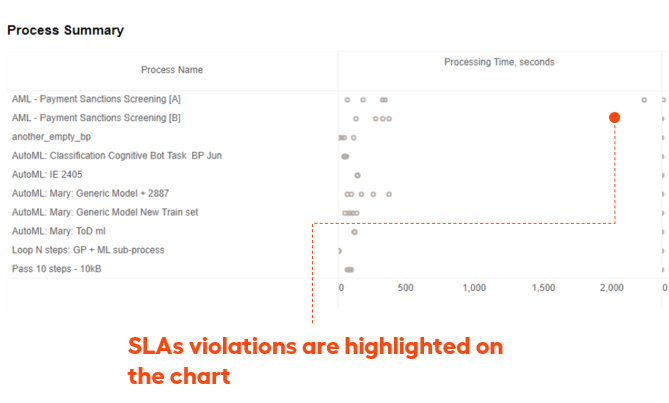
SLA violations are explicitly highlighted with red in the Process Summary and Task Summary analytics widgets.
Transaction management configuration allows you to define where the transaction starts and ends, exclude non-essential steps, and define the SLA value individually for every process.
Find bottlenecks
Most likely, the machine or the process that has the longest queue is the bottleneck. To identify whether a target step is the root barrier to the overall workflow, you can look for these red flags in production to make an accurate assessment.
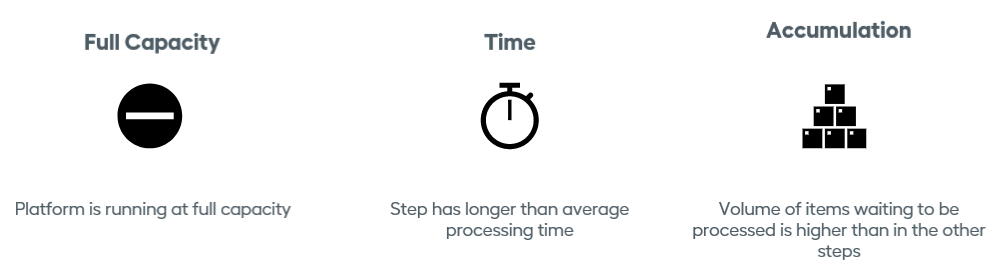
Full capacity
A process or a step that uses the highest percentage of its full capacity will likely be a bottleneck to execution. You can easily compare this to the lower capacity utilization rate of other digital or human workers, processes, and steps involved in execution. If the input increases for the unit, it would most likely cap out.
Throughput and throughput time
Increasing the throughput of each process or step, one at a time, reveals which has the most significant effect on the overall production output. Longer than average throughput time also indicates a possible delay in the process, inspection, and move time, as well as an increase in the wait time. This may require further investigation to identify which step of the throughput time is taking unnecessarily long.
Accumulation
Whenever the input is more significant than what a machine, person, process, or step can handle, an accumulation occurs following that step.
Identify time and accumulation bottlenecks
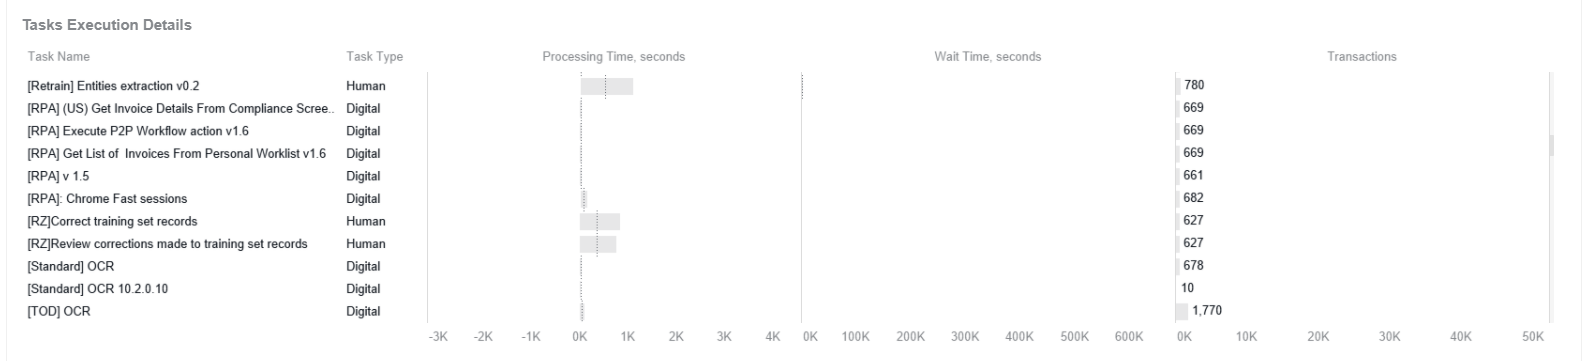
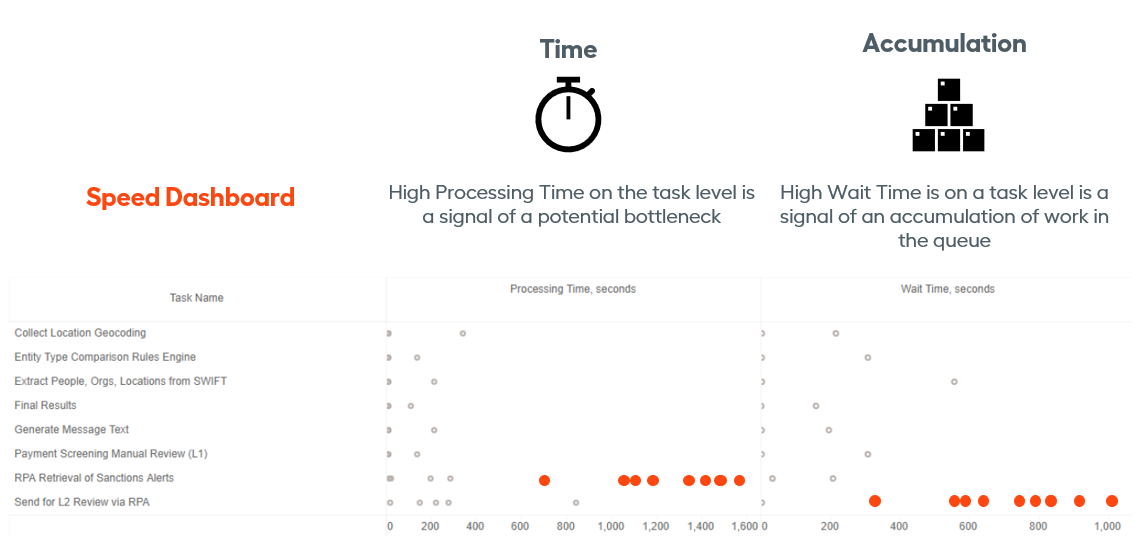
To identify time and accumulation bottlenecks, use the Speed dashboard. Here, you will perform the analysis both on the task and process level using the following metrics:
Processing Time
Long processing time is an indication of a throughput bottleneck. You can see that on the chart with a large number of transactions scattered across the axis.
Wait Time
Long waiting time is an indication that the task has a long unprocessed queue of work (elements are waiting long). Very much like with the processing time, you need to both monitor the average time and look for a large number of outliers.
Another way to monitor and identify bottlenecks is the BP Workflow view. In the View Process mode, it shows execution in real time with indications of how many transactions are being processed or waiting and at which stages:
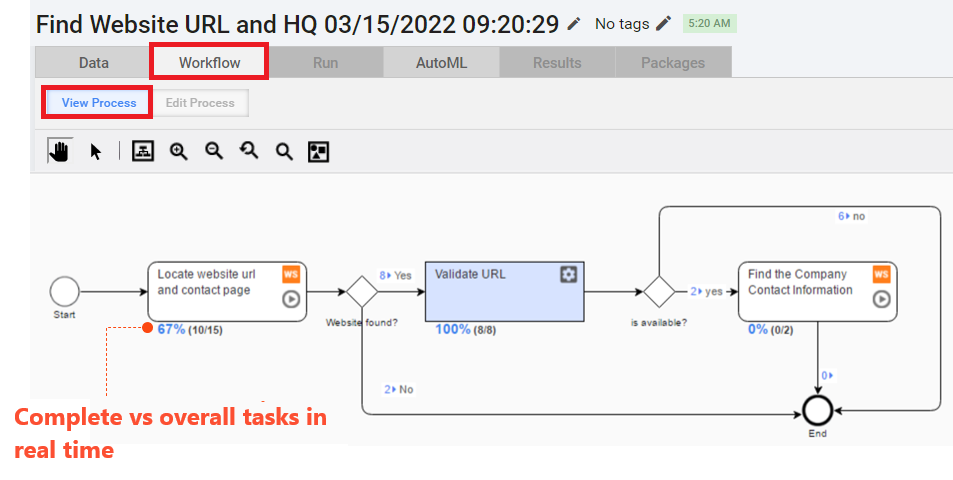
In the example above, the investigation focuses on the steps called Locate website URL and contact page and Find the Company Contact Information. They are compared to all other steps that have input being processed at the moment. Some work seems to be stuck in those specific steps.
To identify bottlenecks related to time and accumulation of tasks, always look for these metrics:
- Processing time
- Wait time
- Amount of transactions
Impact of hours of day and day of week
Both long- and short-term bottlenecks can only occur on specific days of a week or during specific hours of the day. Below is an example of the analysis you can run by building a simple custom report via Reporting API.
Understand the impact these spikes have on the metrics you measure and how can you mitigate the risks if the SLAs are violated in those time intervals:
- Balance the work more evenly throughout the day or week.
- Make sure operators prioritize queues with huge volumes of transactions at peak times.
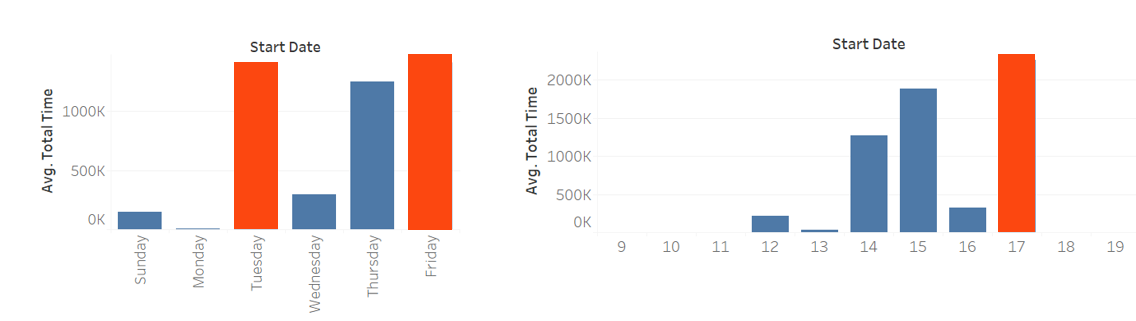
Above, you can see that Tuesday and Friday are peak hours, and this can correlate with some of the short-term bottlenecks occurring on those specific dates. The same goes for the second chart: 5 p.m. is a peak hour in a day, so a different approach to the process or workforce management should be applied in that specific timeframe.
If other metrics don't show any extraordinary results, you may want to investigate specific hours and days when bottlenecks occur. If this metric correlates with the issues, the cause may be worth mitigating.
Summary
In this chapter, you have learned why your BP may require improvements, how to define weak spots in it, and what tools to use. To summarize, you can make the following conclusions:
- Bottleneck analysis is a way to improve continuously.
- To find a bottleneck, always look for Time. The main metrics are cycle, wait, and processing times. In addition to averages, consider percentiles.
- The Analytics capability provides the following tools: dashboards, custom reports, and process view.
- The time distribution charts in the Speed dashboard help spot anomalies and spikes to investigate further.
- In the Speed dashboard, look at Wait Time and Processing Time to identify accumulation and time bottlenecks.
- Keep in mind that days of the week and hours of the day can have a substantial impact on processing and cause bottlenecks.