Explore analytics for AI Agents
The article addresses uses cases for legacy Tableau-based Analytics.
An AI Agent (or AI Digital Worker) is a ready-to-go automation solution that covers a single end-to-end Business Process. Typically, the solution includes the following:
- Configurable inputs
- Ready-to-use Business Process that automates a particular function
- Configurable output formats you can customize to your particular needs and compliance rules
For details on available AI Agents and instructions to install, configure, and manage them, refer to the documentation.
Analytics for AI Agents comes in two forms:
- General to understand the process flow and look for common technical issues and troubleshooting
- Specialized to get process metrics within a specific and business-oriented context.
Evaluate process performance and find bottlenecks
On a high level, general analytics relates to business impact, overall process performance, stability, accuracy, and quality. The key metrics are:
- Manual Handling time required to process a single business entity
- End-to-end Processing Time
- Volumes processed daily, weekly, or monthly
- Process Accuracy and Quality
- Process Bottlenecks associated with people or technology
- Input Data Quality as an external factor driving the solution quality and accuracy
- Customer Satisfaction measured indirectly, primarily by looking at the End-to-End Processing Time and Accuracy metrics
These flows and metrics are common across various business areas and provide a complete picture of how a process works. In addition, they help to identify issues and bottlenecks, whether they are related to technology, implementation, or some other cause.
At the same time, business context is required to correlate the above metrics to actual functional requirements and make accurate decisions. That is when pre-packaged analytics for AI Agents comes into place. It allows you to get a quick overview of operations and process efficiency, isolated to a particular business case, with sufficient detail and context as required for a business person.
Get specific insights into AI Agents
The AI Agent analytics implements the standard metrics and logic, enriching the metrics with AI Agent context and details required to make better decisions. While there is a set of various indicators covering the process and platform health end to end, other critical aspects to evaluate for an AI Agent are as follows:
- Turnaround Time
- SLA
- Customer Satisfaction
The above metrics mostly relate to Manual Handling Time when you look at the overall process. They are also the key for a business person to quickly define whether operations are performing well and, if not, what may be the root cause. Below are the most common scenarios to follow while managing AI Agents.
Work.AI contains specific tools for aggregating data and displaying the AI Agents' dashboards: Tableau and Superset. Both these instruments have similar analytics capabilities, and you can choose which suits your business needs most.
Superset is installed along the product, so you will only need to configure access for users to start working with it. Once you install a new DW skill, its dashboard appears automatically in Control Tower. To access Superset-based AI Agents' dashboards, in Control Tower, click the Control Tower title, and in the dropdown box, select Insights.
Explore analytics for Adverse Media Monitoring
Adverse Media Monitoring (or Negative News Screening) involves searching for negative news about a person or business. It can be a crucial part of Know Your Customer (KYC) and Anti–Money Laundering (AML) processes for banks.
Negative news checks are essential for uncovering a customer's possible involvement with money laundering, fraud, organized crime, and terrorism, among other threats. Conducting Negative News Screening ensures that firms do not become unwittingly involved in criminal financial activity. Regulatory bodies enforce banks to perform the screening process on companies, their top executives, and shareholders.
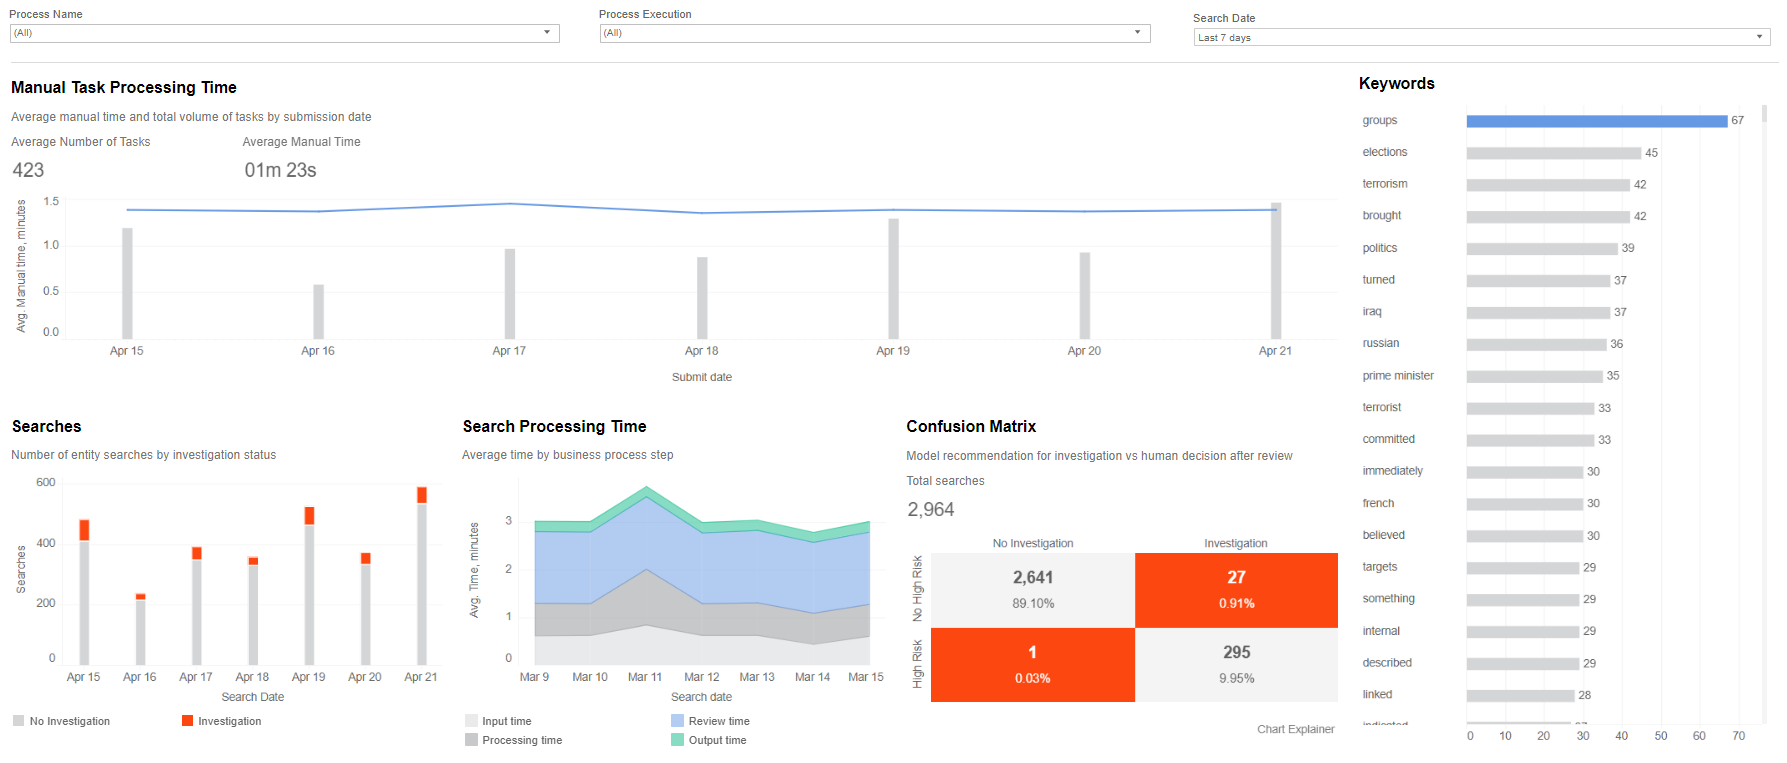
The Overview dashboard for Adverse Media Monitoring provides standard business metrics on the process:
- Manual Handling Time
- Search volumes
- Quality represented by the Confusion Matrix. Additionally, there's AI Agent-specific categorization of each task by resolution.
- List of keywords used by the model
The Domains dashboard provides a more technical and detailed view of how the process works and what type of content is processed and handled by analysts.
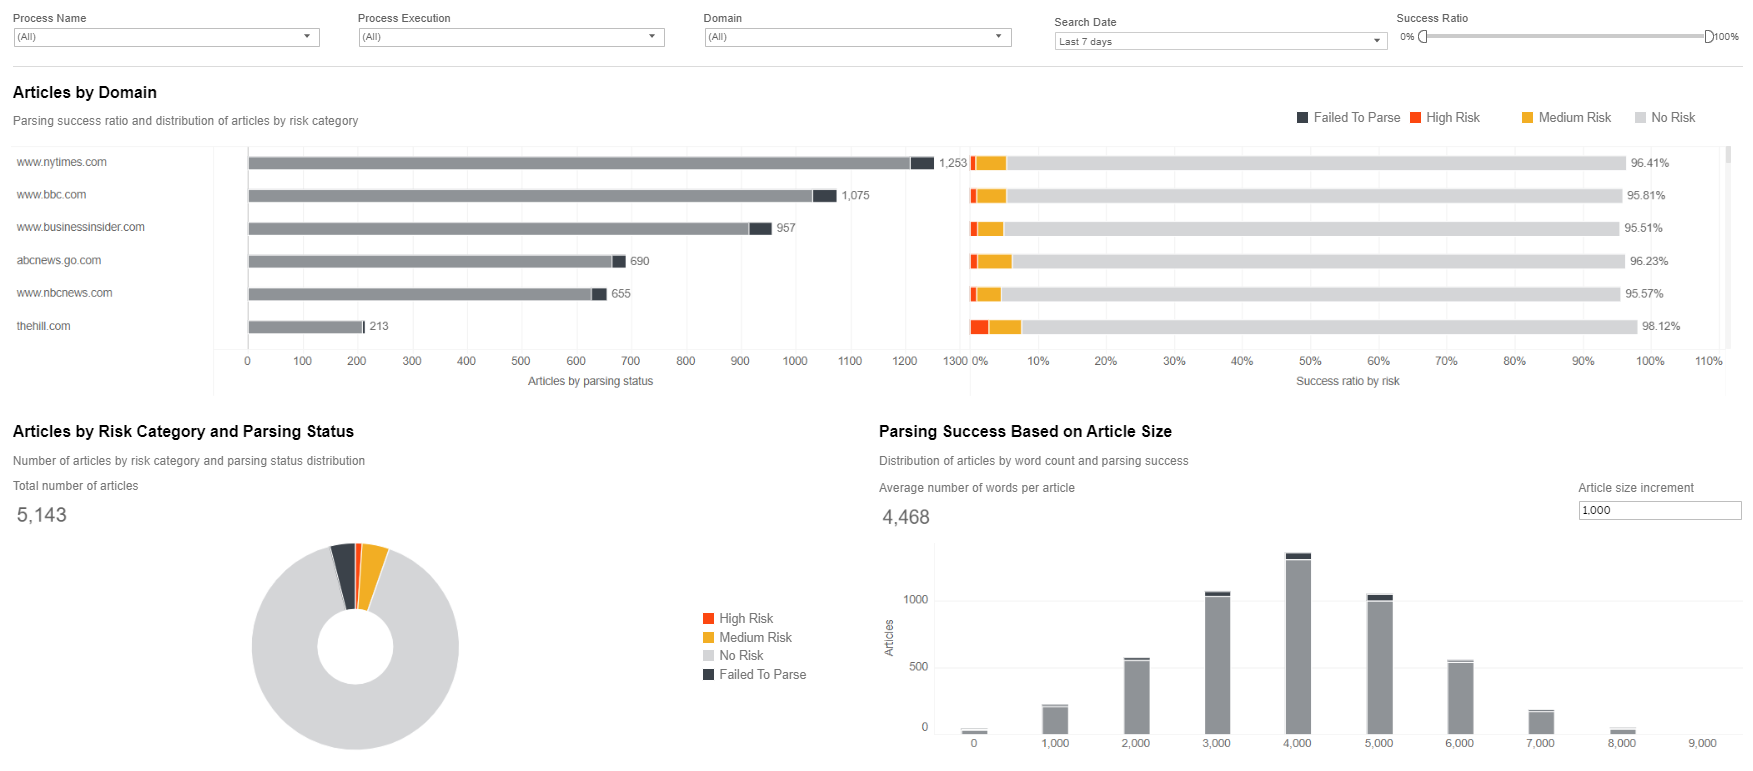
These two dashboards allow you to get a quick overview of the process, evaluate its efficiency and quality.
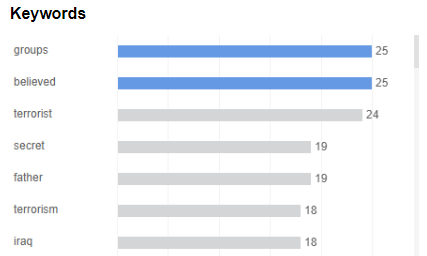
Keywords list provides information on words and phrases used in the solution to score articles and identify the risk category they belong to:
- High Risk
- Medium Risk
- Low Risk
- No Risk
When reviewing this list, an SME looks for words that may be missing but are often used in manual work to decide on actual risk and investigation.
Recommended action: if anything is missing, re-train the model in the Adverse Media Monitoring process and include new words and phrases. This will improve accuracy, resulting in the decreased number of False Negative and False Positive cases in the Confusion Matrix.
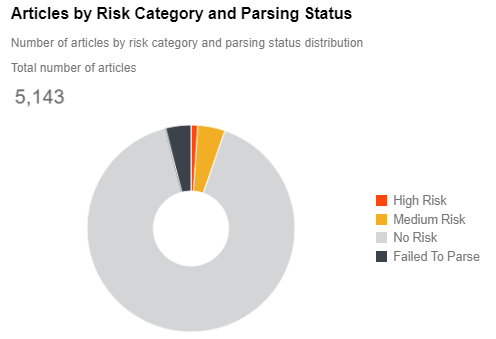
Risk distribution assessment: review the distribution of articles by risk categories to identify process improvement needs.
A large number of High or Medium Risk articles increases the workload of analysts who are tasked to review more information. Accordingly, the overall number of cases that can be examined over a period, for example, per hour, is going to be lower.
Recommended action: if you expect the number of such articles to be high, consider assigning more analysts to manual reviews to increase the process throughput.
A large number of High or Medium Risk articles increases the analysts' workload and may indicate poor model performance.
Recommended action: review the model accuracy and list of keywords and re-train the model to improve performance.
A large number of Not Parsed articles indicates poor input data quality. It may flag formatting changes in source portals.
Recommended action: update the process to handle such articles effectively.
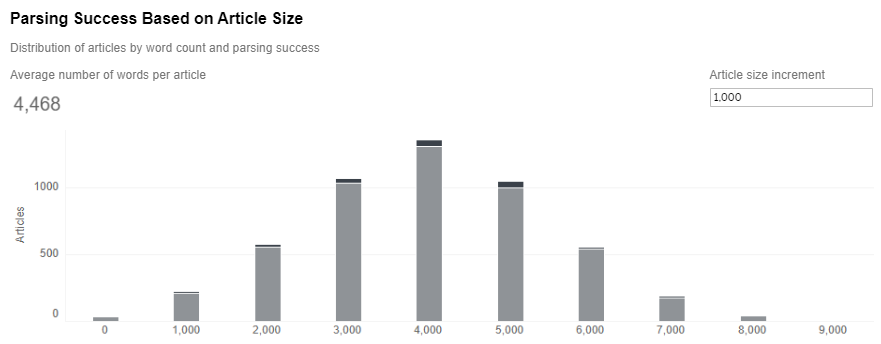
Distribution by content size indicates two potential problem areas:
Articles of a specific size (for example, 0–500 words) are failing to be parsed. This means such documents are of poor quality, or source pages contain many ads.
Recommended action: analyze these articles and the source portal, identify the technical root cause for the parser failure, and update it accordingly.
A high number of large-size articles impacts analysts' review time because such articles, mainly appearing on the Medium Risk bucket, often require more manual effort.
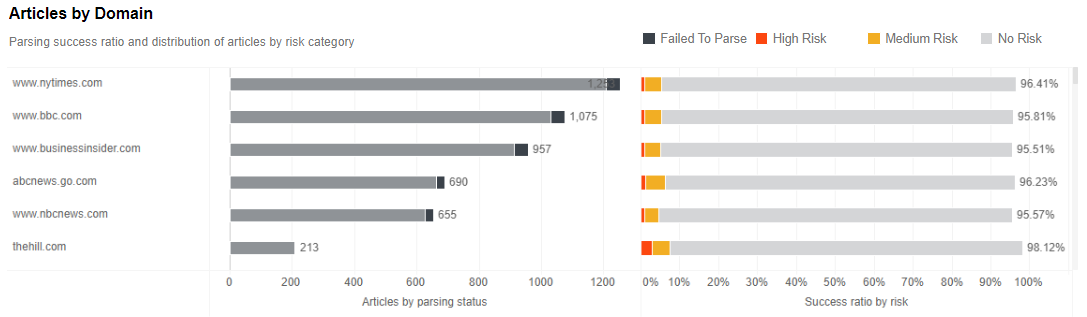
Parsing success rates by Domains indicate incoming data quality and how effectively the process can handle each portal when processing the content. The root cause of high failure rates is on the technical side. For instance, a new source of information may appear, which the solution is not optimized to effectively process in terms of content or formatting. Also, the implementation of a portal could have been changed.
Distribution of articles by risk category for each domain allows for reviewing all sources and assessing their importance. For example, to reduce noise, you can ignore or add to a blacklist all domains feeding only low-risk materials. Domains with an unexpectedly high number of High Risk articles may require additional review to confirm this is the case. Technical issues or opinion bias in a specific source may lead to an incorrect decision on particular names searched.
Practical cases
When working with Adverse Media Monitoring and checking daily, you may face the common problems described below.
Case 1: missing keywords
Problem: some critical words are not included in the search. This may affect decisions related to assessing actual risks and the need for investigation.
Analysis: verify the keywords list in Adverse Media Monitoring periodically to control the overall model quality and ensure that the solution works at the highest possible accuracy. Based on the analysts' and subject-matter experts' knowledge, you can decide whether the model needs technical review and modification.
Check the Keyword widget on the Overview dashboard and verify that no well-known phrases for high-risk articles are missing. For example, if the list does not include "crime," "offshore," "third party," "family," or "organization," the article content is likely to be more frequently marked as "high-risk" and landed on the investigator list.
Solution: to fix the problem, discuss it with the technical team and provide a revised list of words to include in the model as high risk markers. The model will then be re-trained and published to production.
Case 2: increased amount of high-risk articles
Problem: a large number of high-risk articles affects the total amount of requests that analysts can process daily.
Analysis: a high number of articles requiring review, validation, and confirmation can have a significant impact on analysts' manual workload. Ideally, the goal is to minimize the Manual Handling Time and maximize the overall Throughput.
To check the current state and identify issues, review the Adverse Media Monitoring Domains dashboard, paying attention to the Articles by Risk Category widget. The latter indicates current distribution and highlights any issues. For example, the current rate can be 5% greater than expected.
A reason for a higher number of high-risk articles can be the model threshold settings that assign risk categories according to a score defined by the model.
Solution: a potential fix for this issue is to change the threshold. In case of high volumes, you can increase it, for example, from 0.8 to 0.9. That means only the articles scoring higher than 0.9 are treated as high-risk. To see how the change affects your production environment, monitor the solution health for a few days. Make sure it does not affect accuracy, and the model does not miss essential cases. You can do this using Confusion Matrix.
Case 3: increased Manual Handling Time
Problem: Manual Handling Time is increased due to lack of knowledge and skill.
Analysis: Manual Handling Time is a significant metric as it directly impacts the volume of daily processed requests, process throughput, and customer satisfaction. The quicker you can conduct the checks, the better. On the Adverse Media Monitoring Overview dashboard, the Manual Handling Time chart is central and allows you to review trends and the current state.
Solution:
Follow the steps below:
Look for current volumes associated with Manual Handling Time. Verify there is no correlation, and the processing time variation is not due to changed amounts.
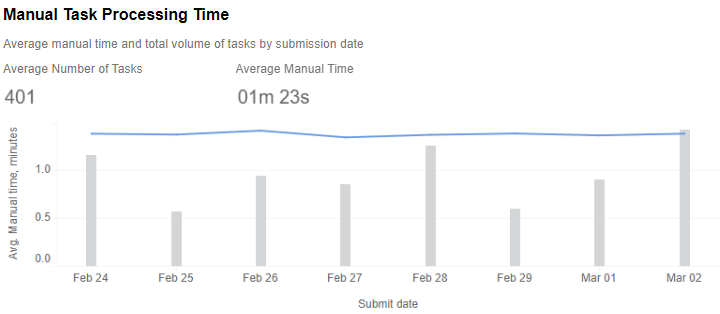
Check the Manual dashboard (an out-of-the-box dashboard) and analyze it within the scope of the Adverse Media Monitoring Business Process. The Manual dashboard highlights whether any analyst team members are performing worse than others.
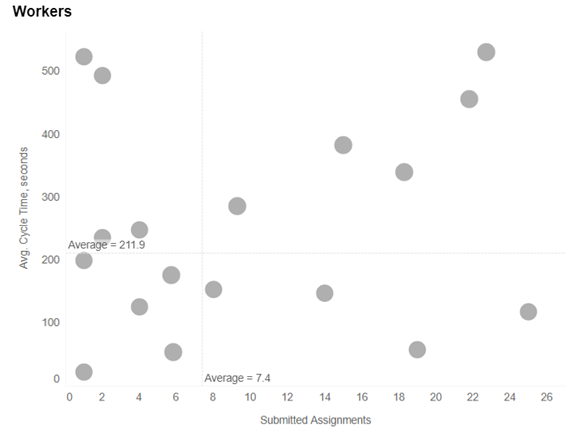
When you see a high number of long processing times for a specific analyst, discuss it with them. Verify they have appropriate knowledge of the process and run education sessions to help them perform better.
Use Analytics for account opening process
Identity Verification is the process of checking customer ID documents to ensure they are who they claim to be. It is part of many procedures, such as:
- Account opening
- Client onboarding
- Know Your Client (KYC)
- Anti–Money Laundering (AML)
WorkFusion accelerates the process of Identity Verification by extracting pertinent data from documents, such as passport and driver’s license, retrieving data from internal and external systems, and reconciling it all to uncover any discrepancies. The Identity Verification process is necessary to comply with the KYC and AML regulations.
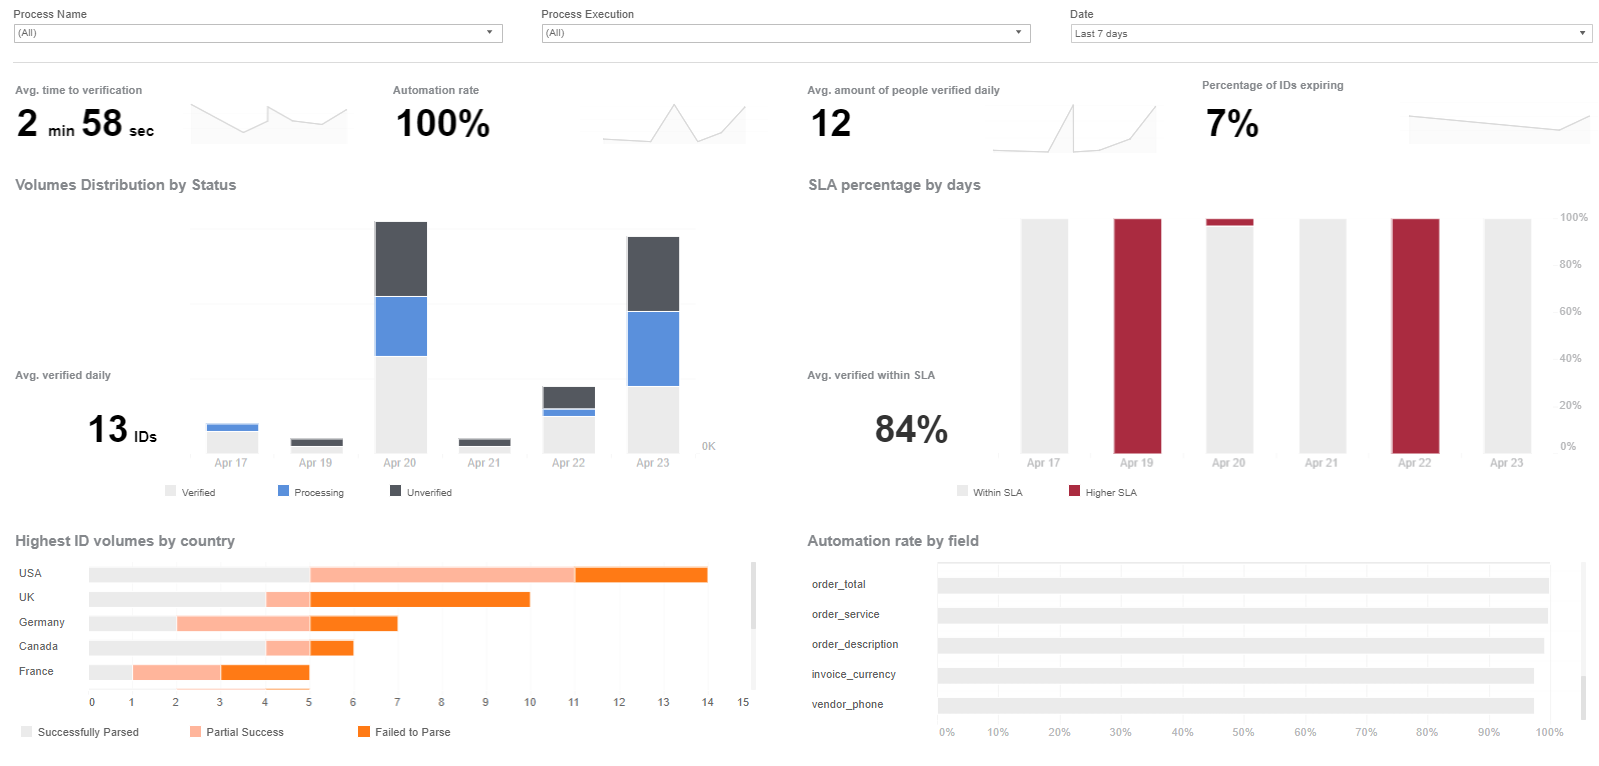
The dashboard delivered with Identity Verification allows you to monitor and troubleshoot the underlying process. You can also evaluate the process efficiency and quality through key metrics, such as Average Time to Verification, Automation Rate, Average Verifications Performed Daily, and SLA. These metrics make it possible to evaluate process throughput, understand high-level quality, monitor internal SLA, and predict impact on customer satisfaction.
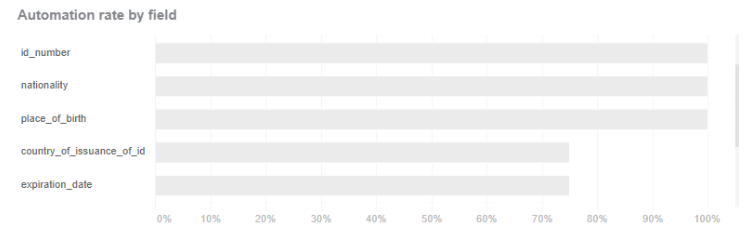
Details on Country of Origin highlight lower-level issues with OCR when you work with multiple languages. Automation Rate by fields will prompt you to issues with specific area or type of document, for example, if templates are changing or there is a new type to deal with.
Practical cases
When working with Identity Verification and monitoring it daily, you may face the common problems described below.
Case 1: issues with language settings in OCR component
Problem: processing articles in languages not set in OCR leads to SLA violations.
Analysis: Identity Verification typically involves handling various input document types in different languages adn originating from different regions and countries. To effectively process documents in different languages, set the OCR component accordingly and include appropriate languages.
From a process perspective, getting a document with a new unknown language results in SLA violations since it requires manual processing and validation. In the SLA widget, this looks like cases highlighted in red for being outside of SLA. To double-check the hypothesis, you can review the Average Time to Verification widget. It should indicate an increase, with the trend line showing a spike in the most recent days. At the same time, Volumes will not display any significant variance, meaning incoming requests have the same daily rates. Additionally, you can limit the scope to a specific day.
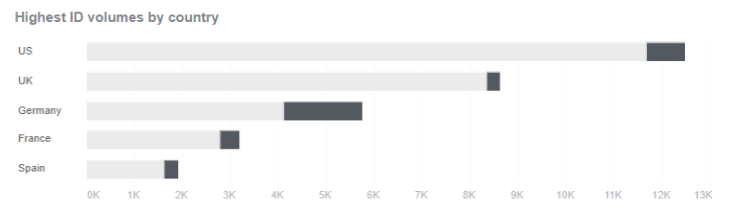
The example below features the Highest ID Volumes by Country widget. You can see that Germany has the most Failed to Parse statuses for documents. This means the problem is related to the particular country and proves the initial hypothesis about a country-specific document processing issue.
Solution:
To resolve the problem, follow the steps below:
- Modify the OCR setting and add the German language to the list.
- Re-run the process.
- Verify that processing in German is successful, and Manual Handling Time, along with SLA violations, returns to normal and expected values.
Case 2: data extraction cannot recognize specific fields
Problem: not all fields are recognized during data extraction.
Analysis: data extraction is a crucial component of document processing. Issues at the step can have different business impacts. For example, they can cause increased Manual Handling Time, lower the process Throughput, and creates compliance and customer satisfaction risks related to lower quality of work and increased request processing time. As you can see, unexpected increases in processing time and SLA might be associated with poor extraction quality, which also decreases the Automation Rate. Still, due to high volumes of work, it might have gone unnoticed.

Solution: if the Automation Rate by fields widget indicates poor quality for a specific field, verify what type of documents it relates to. Knowing the field name and type of document, check the latest Manual Tasks and perform additional tagging to improve field recognition and data extraction processes.