Speed
The Speed dashboard helps you identify bottlenecks in process executions.
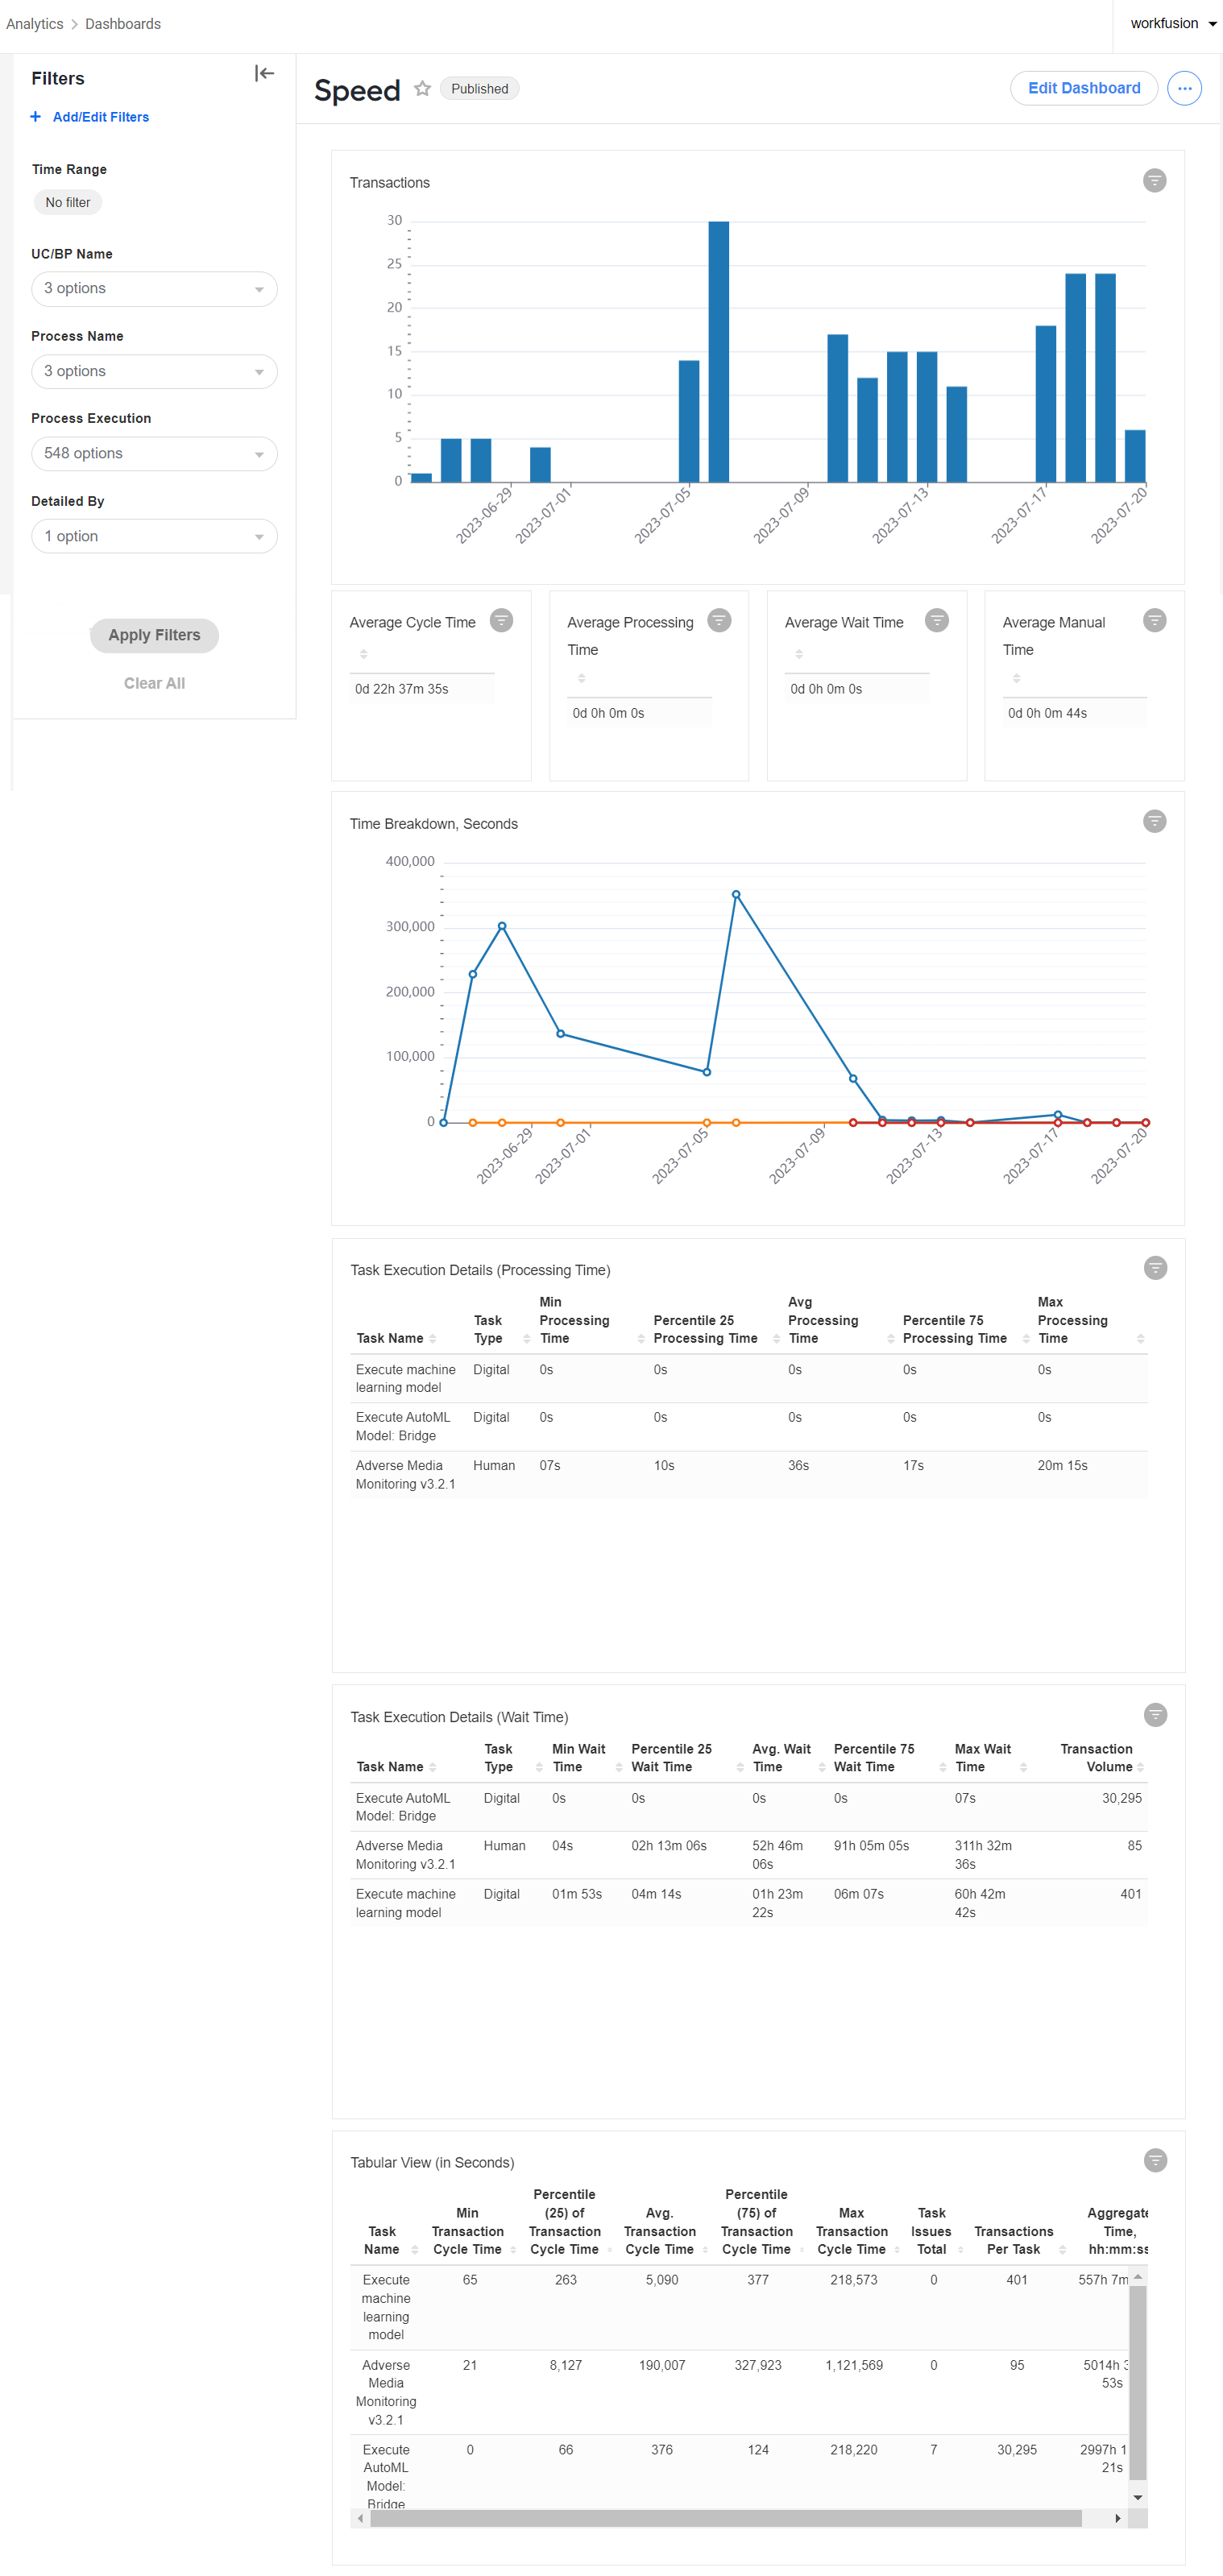
For detailed information, refer to the Views section.
When using the Speed dashboard, pay attention to the following considerations:
For the dashboard, data selection is limited to 30 days of completed transactions. Regardless of the actually selected time range, the dashboard displays transactions not older than 30 days.
The time axes for the Volume and Time Breakdown views are linked to the date and time derived from the transaction end date.
Views
Volume
The Volume view provides a time-based view and trends on processing volumes—the number of transactions processed daily.
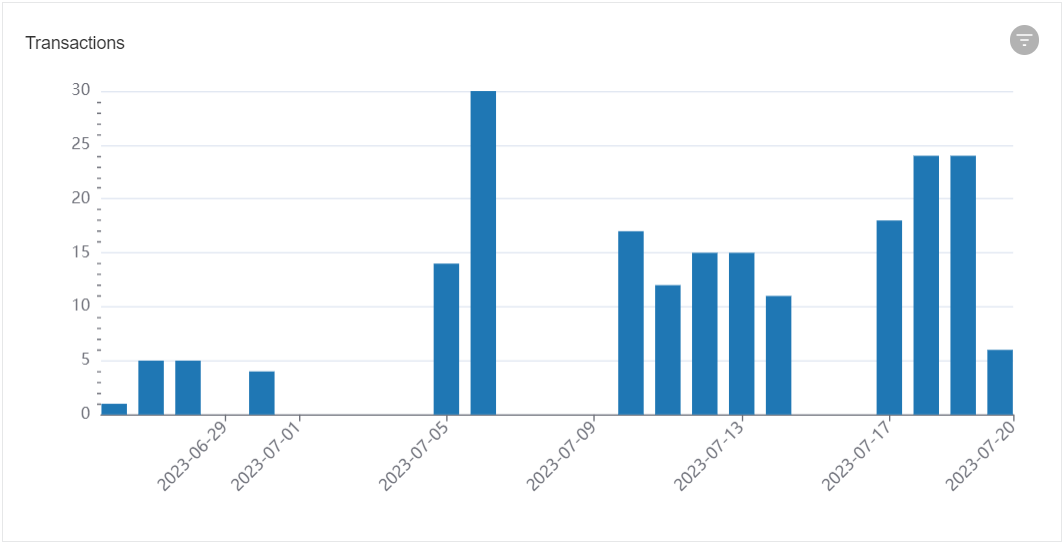
The chart is supported by an average baseline making it possible to quickly identify the following:
- Major processing volume outliers
- Total completed transactions within the selected scope
- Total KPIs for average daily volumes
Time Breakdown
The Time Breakdown view allows you to evaluate the average processing time for one or more selected processes.
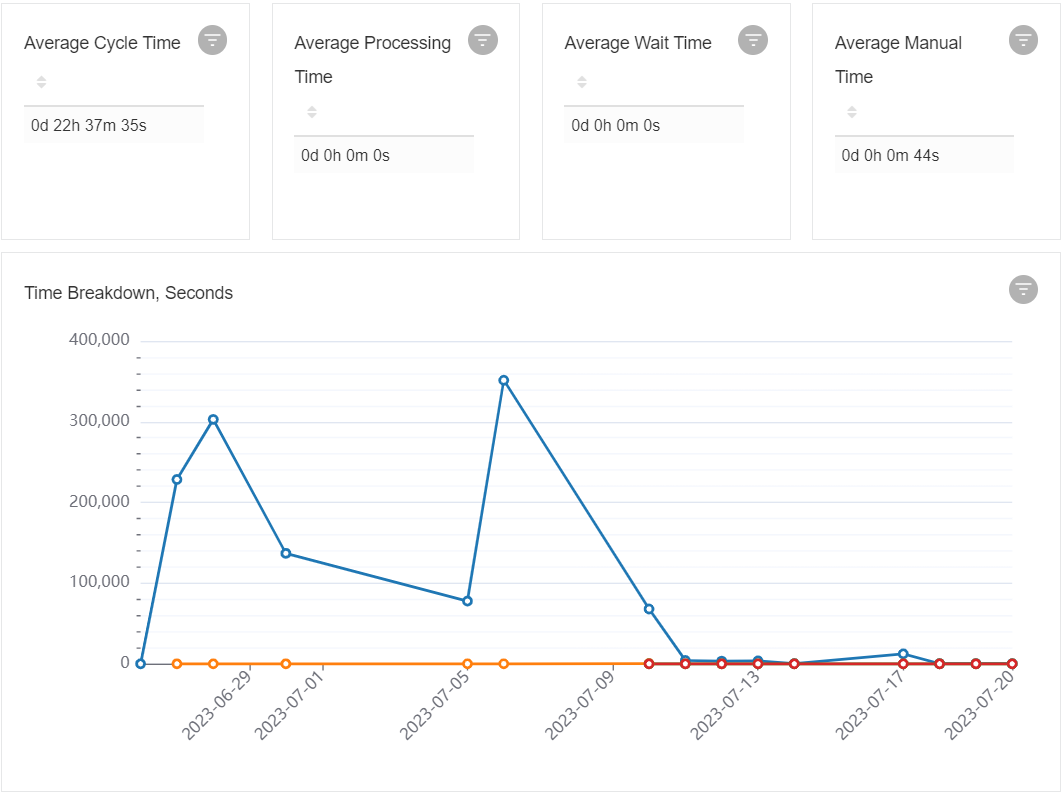
You can see separate visualizations for each of the time parameters:
- Average Cycle Time
- Average Processing Time
- Average Wait Time
- Average Manual Time
The Time Breakdown view also features a chart visualizing the trends for the above time parameters, highlighted in different colors. The chart shows the time range in which 90% of transactions were processed. The 90% limit is set to provide good visual perception and avoid significant anomaly effects. For example, if the typical average time is two minutes, but at a point in time, statistics indicate eight-hour execution, it makes the chart unreadable.
Speed
The Task Execution Details view provides an overview and major exaction statistics per task or stage, depending on a specific AI Agent implementation. Stages must be supported at the code level to be included.
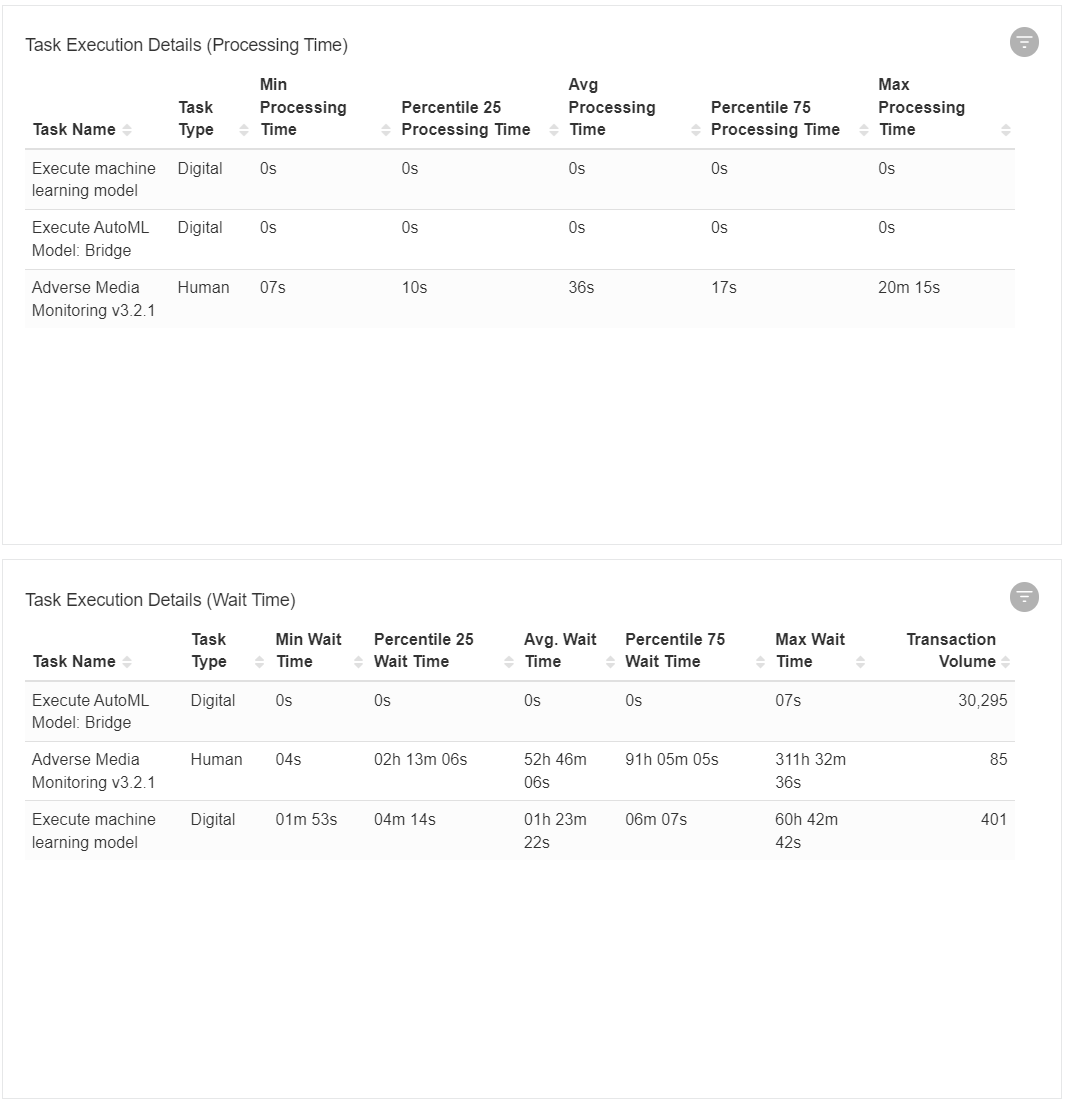
The view includes the following two charts:
Processing Time comprises actual processing time calculations: minimum, maximum, average, and percentile values.
Waiting Time comprises actual waiting time: minimum, maximum, average, and percentile values.
Additional categorization of tasks lets you quickly identify their nature and make swift time decisions, especially based on comparisons. The Task Type can be one of the following:
- Digital performed by a machine
- Human performed by a human operator via Manual Tasks in WorkSpace
Tabular
The tabular view provides reference data in a tabular format per task or stage.
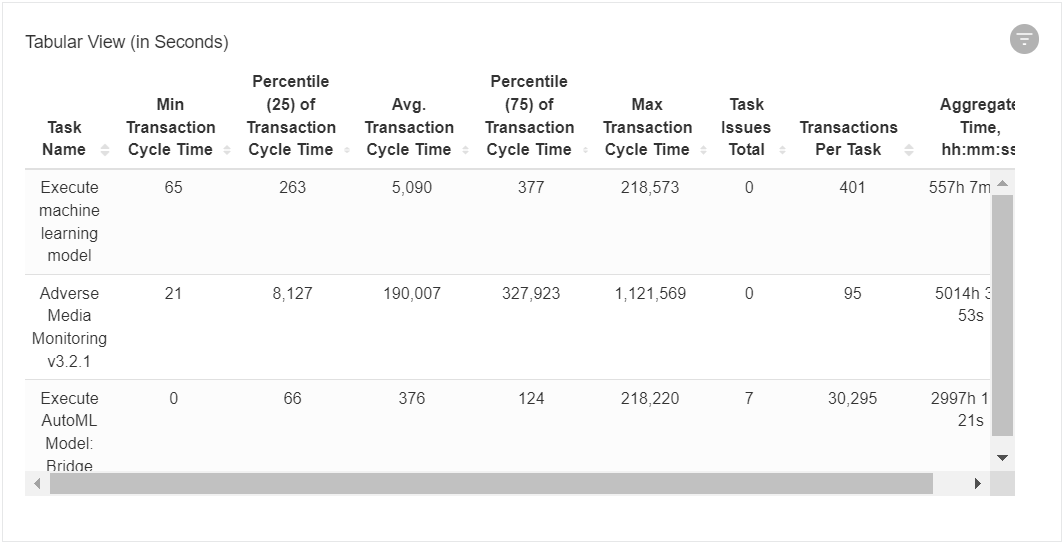
The table includes the following information:
- Task or stage name.
- Minimum Transaction Cycle Time per Task in seconds.
- Percentile (25) of Transaction Cycle Time per Task in seconds.
- Average Transaction Cycle Time per Task in seconds.
- Percentile (75) Transaction Cycle Time per Task in seconds.
- Maximum Transaction Cycle Time per Task in seconds.
- Task issues total.
- Transactions per task.
- Aggregate time, which is the total execution time and the number of hours for how long a step has been active and running.
Filters
On the Filters panel for the out-of-the-box Speed dashboard, the following default filtering options are available:
For instructions to create, set, edit, and apply filters, refer to Learn about analytics in WorkFusion | Filter dashboard data.