Issues related to database locks
An increasing number of database locks leads to Business Process (BP) performance degradation regardless of the BP complexity.
When a step in a BP results in a database (DB) lock, an error is thrown in one of the BEP log files. It is highly recommended to monitor for signs of DB locks when conducting the BP performance analysis.
Find out DB lock number
To find out how many DB locks occurred, follow the steps below:
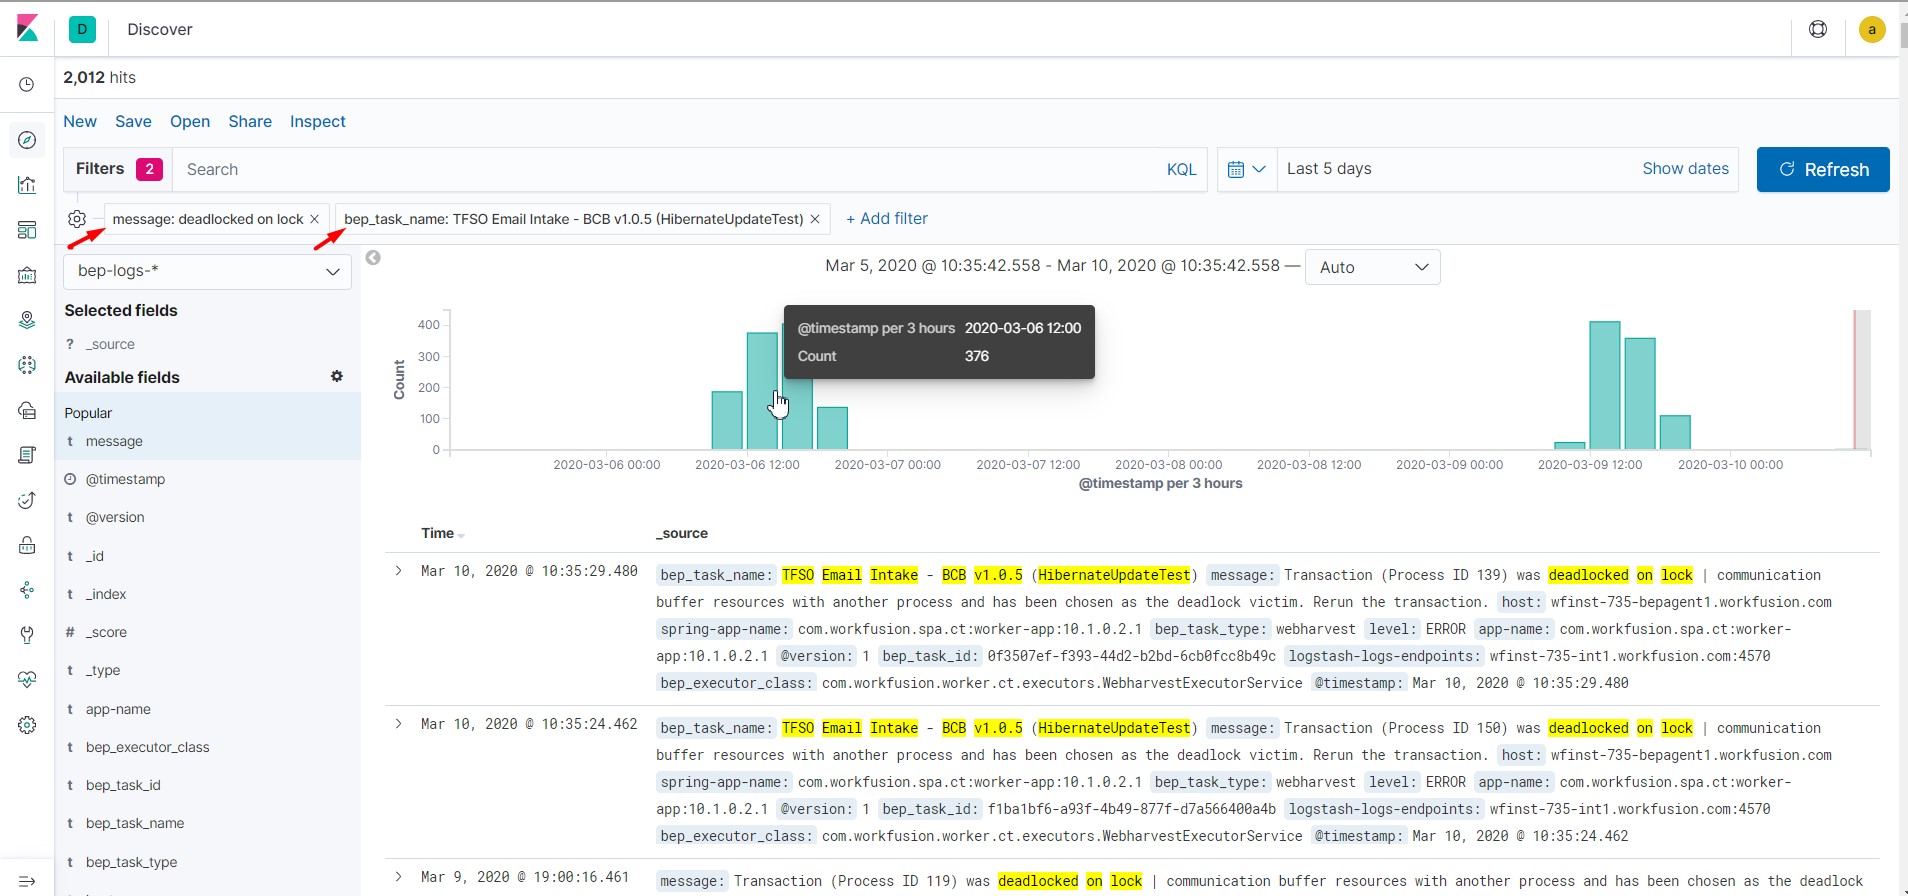
- Log in to Kibana.
- Navigate to the Discover screen.
- In the file selection drop-down, select filebeat-worker-logs.
- Add filters:
- message: deadlocked on lock
- bep_task_name: your step: optional; add the filter level to search for locks on a specific BP step
- Pick a relative date interval to search BEP logs over a specific period.
- Click the Refresh button.
- Count the occurrences of the deadlocked on lock error message.
- As you see the number of DB locks over a time interval, you may notice performance degradation across all BPs. BEP Workers dealing with DB locks would slow the overall BEP processing speed. For further BP optimization, refer to Investigate Bot Task execution.
Analyze DB locks in Microsoft Management SQL Studio
As part of a more advanced deadlock analysis, you can gather additional information on the deadlock and the locked query itself in Microsoft Management SQL Studio:
- Go to MMSS, log in under the admin user (usually, the sa user).
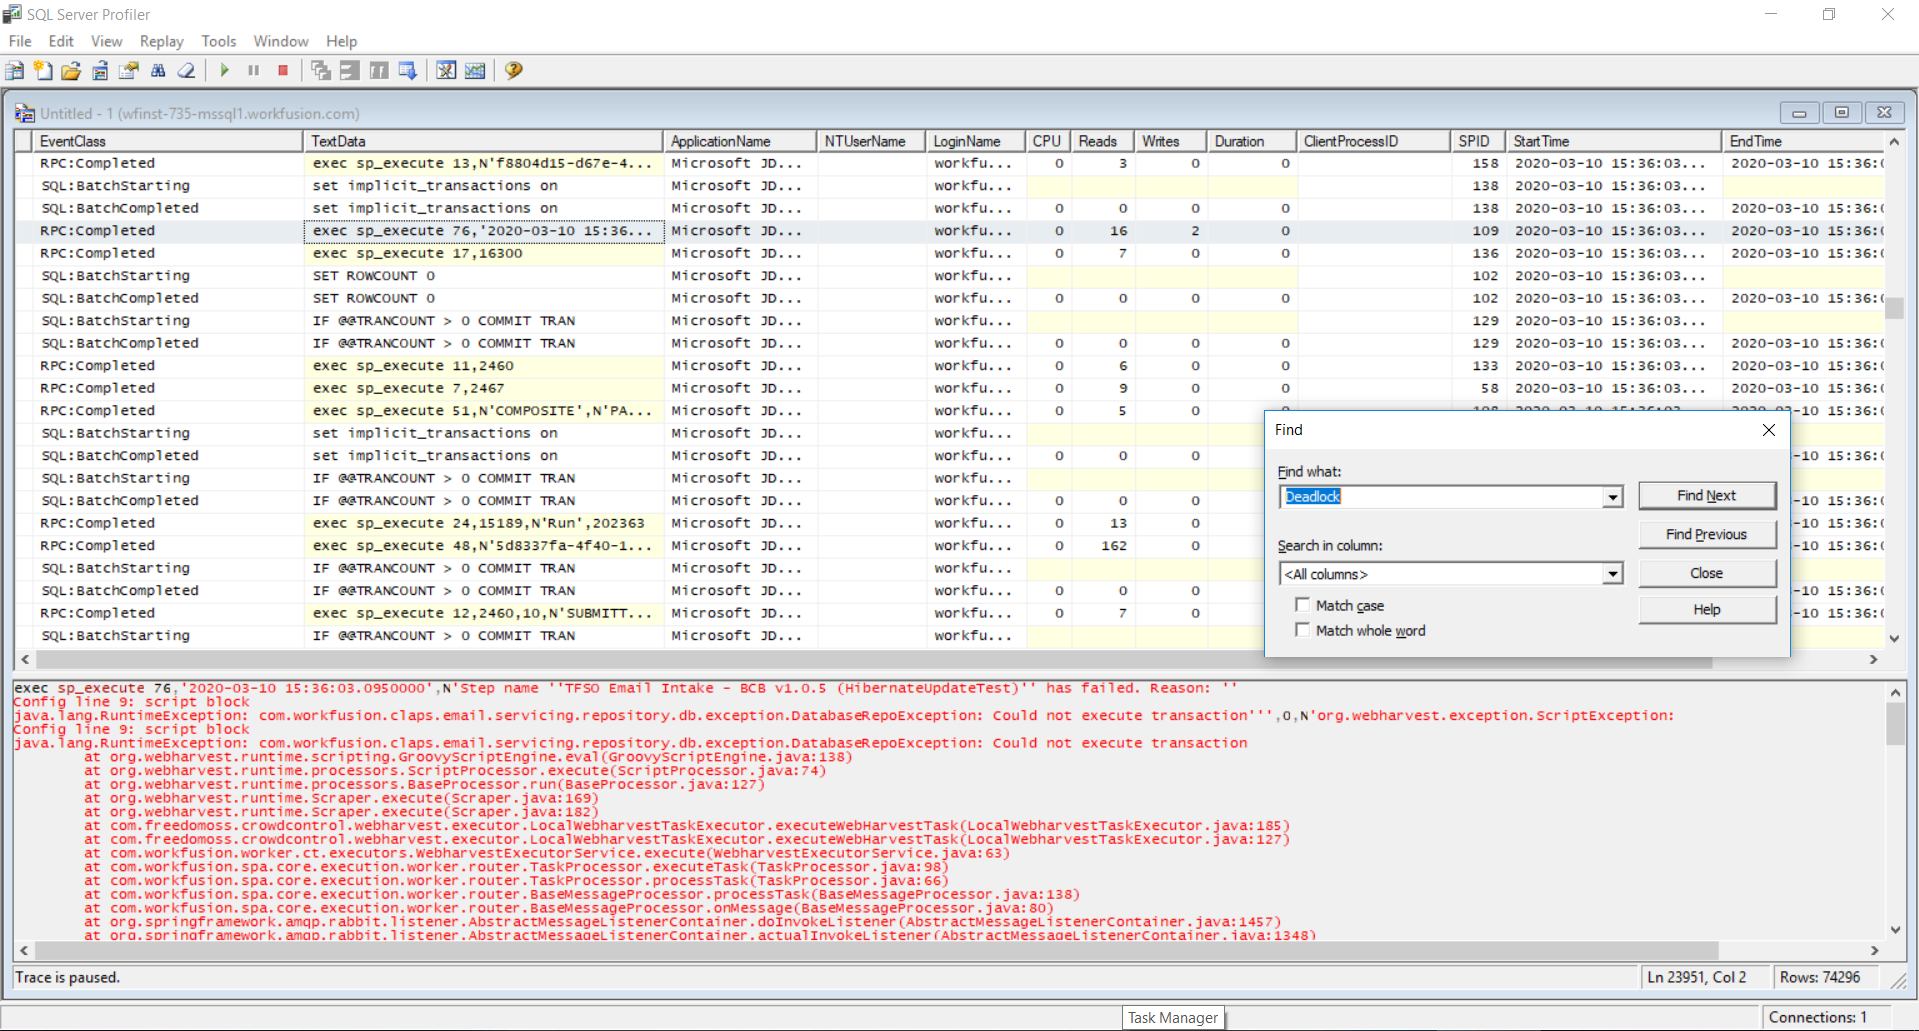
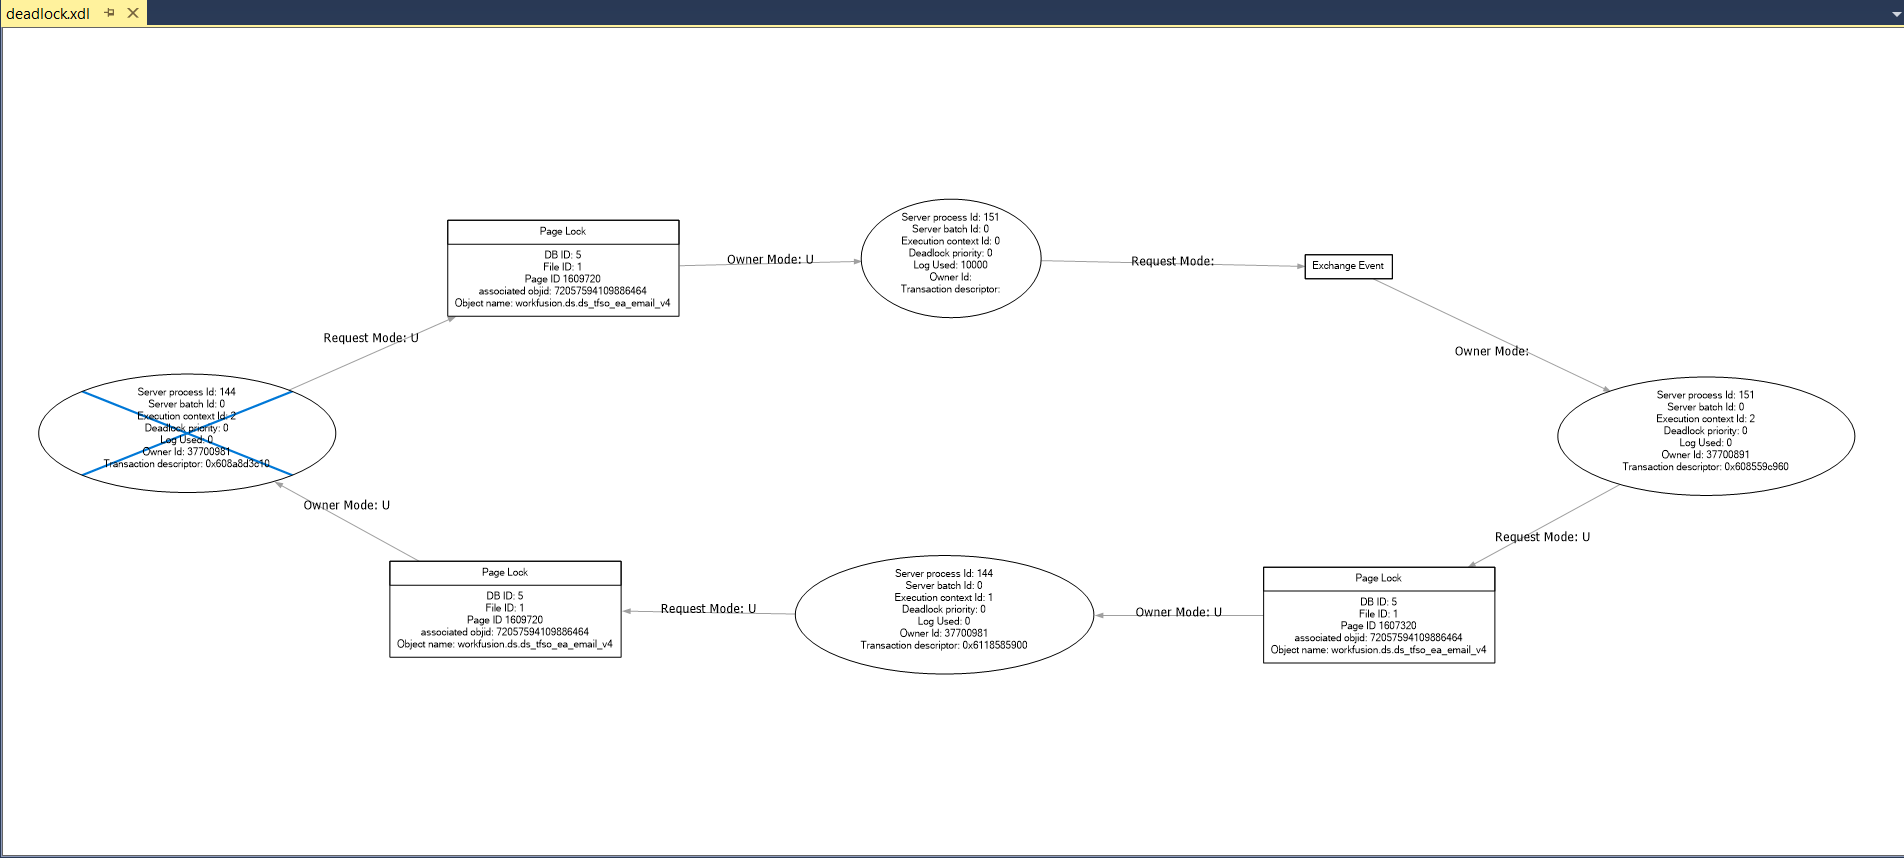
- Open SQL Server Profiler and save a deadlock graph.
- Find the query that gets locked and the deadlock graph:
Detect DB locks inside MS SQL Server
Deadlocks
Deadlocks are solved automatically by the DB engine. One of the sessions is interrupted with the following message:
Msg 1205, Level 13, State 51, Line 11
Transaction (Process ID 60) was deadlocked on lock resources with another process and has been chosen as the deadlock victim. Rerun the transaction.
For more information on deadlock tracing, refer to the following documentation:
Tracing 1222 events to track deadlocks
dbcc tracestatus( 1222, -1)

|TraceFlag|Status|Global|Session|
|---------|------|------|-------|
|     1222|     0|     0|      0|

dbcc traceon(1222, -1)

dbcc tracestatus(1222, -1)

|TraceFlag|Status|Global|Session|
|---------|------|------|-------|
|     1222|     1|     1|      0|

...<run-sql-queries>...

dbcc traceoff(1222, -1)
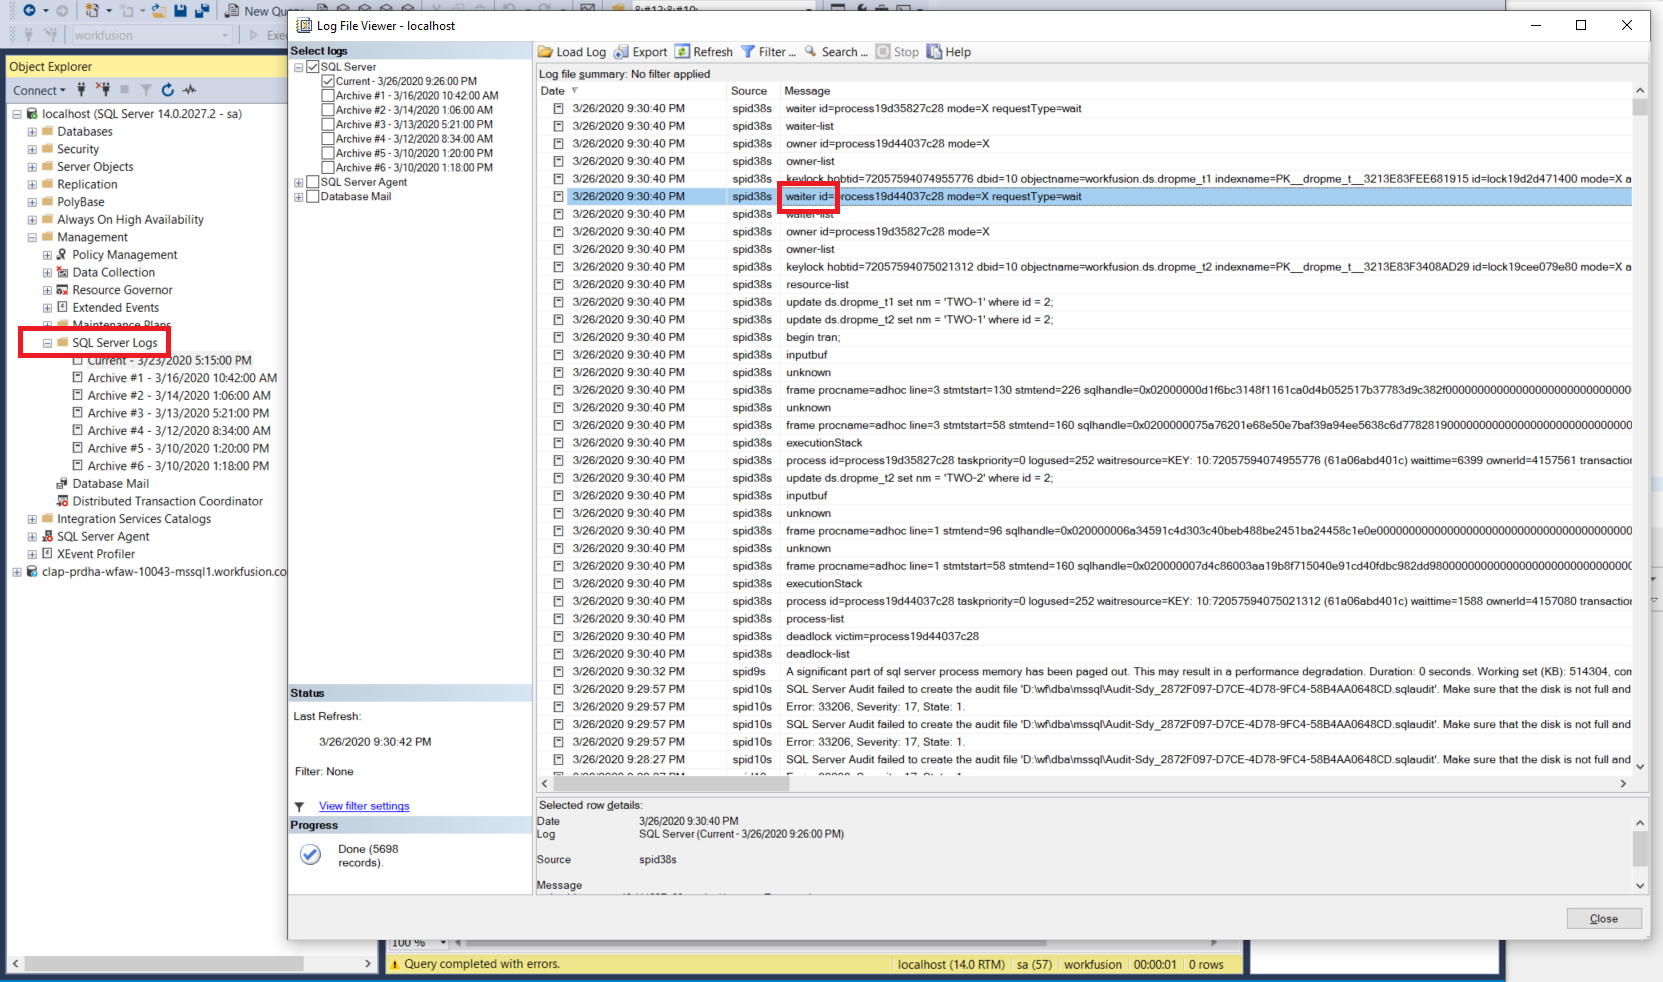
Look into SQL Server Logs to find out waiter id, which is essential to locate deadlock issues.
Lock waits
If one transaction is waiting for another, the sp_who2 stored procedure can show it (column BlkBy ):
exec sp_who2 (should be run in a separate session)

Below are the steps to reproduce:
Transaction-1 (has SPID = 60 in the picture above)
create table t1( id int , nm varchar(30), primary key(id));
insert into t1 values( 1, 'one'), (2, 'two'), (3, 'three');
begin transaction;
update t1 set nm = 'TWO-1' where id = 2;
-- wait for a time ...
Transaction-2 (has SPID = 59 in the picture above)
begin transaction;
update t1 set nm = 'TWO-2' where id = 2;
-- transaction is locked and waits for record releasing by Transaction-1
Lock termination
You can issue the kill <SPID> command to interrupt either blocking or blocked transaction (process):
In a separate MS SQL session
-- to terminate the blocking transaction (see the picture above)
kill 60

-- to terminate the blocked transaction (see the picture above)
kill 59
Fix DB locks
DB locks can have different origin. Within the Work.AI platform, you can see many DB locks when users create custom Data Stores and skip load testing for a specific step. Generally, to reduce DB locks, you can do the following:
- Reduce the speed of updates and inserts
- Reduce the count of updates and inserts
- Add an index to help DB find a page
- Make transactions shorter not to lock database objects for a long time