
Monitoring overview
The monitoring solution consists of the following components:
- Kibana with system performance dashboards
- Elasticsearch for storing metrics data
- Logstash for aggregation and forwarding metrics data
Open monitoring dashboards
To browse monitoring dashboards on Kibana UI:
Go to Kibana, for example, at https://app_hostname/kibana.
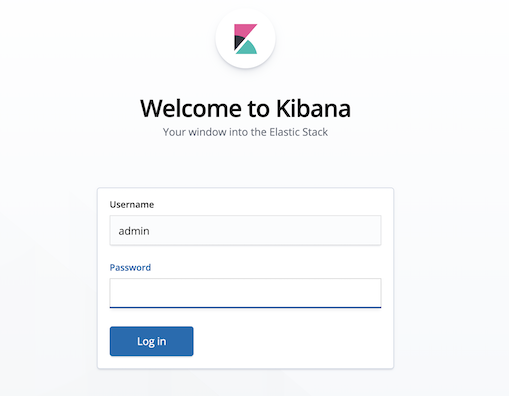
Log in to Kibana by using the predefined user admin, and the password, specified in config.yml during installation.

On the main menu, click Dashboard to open the list of preconfigured dashboards.
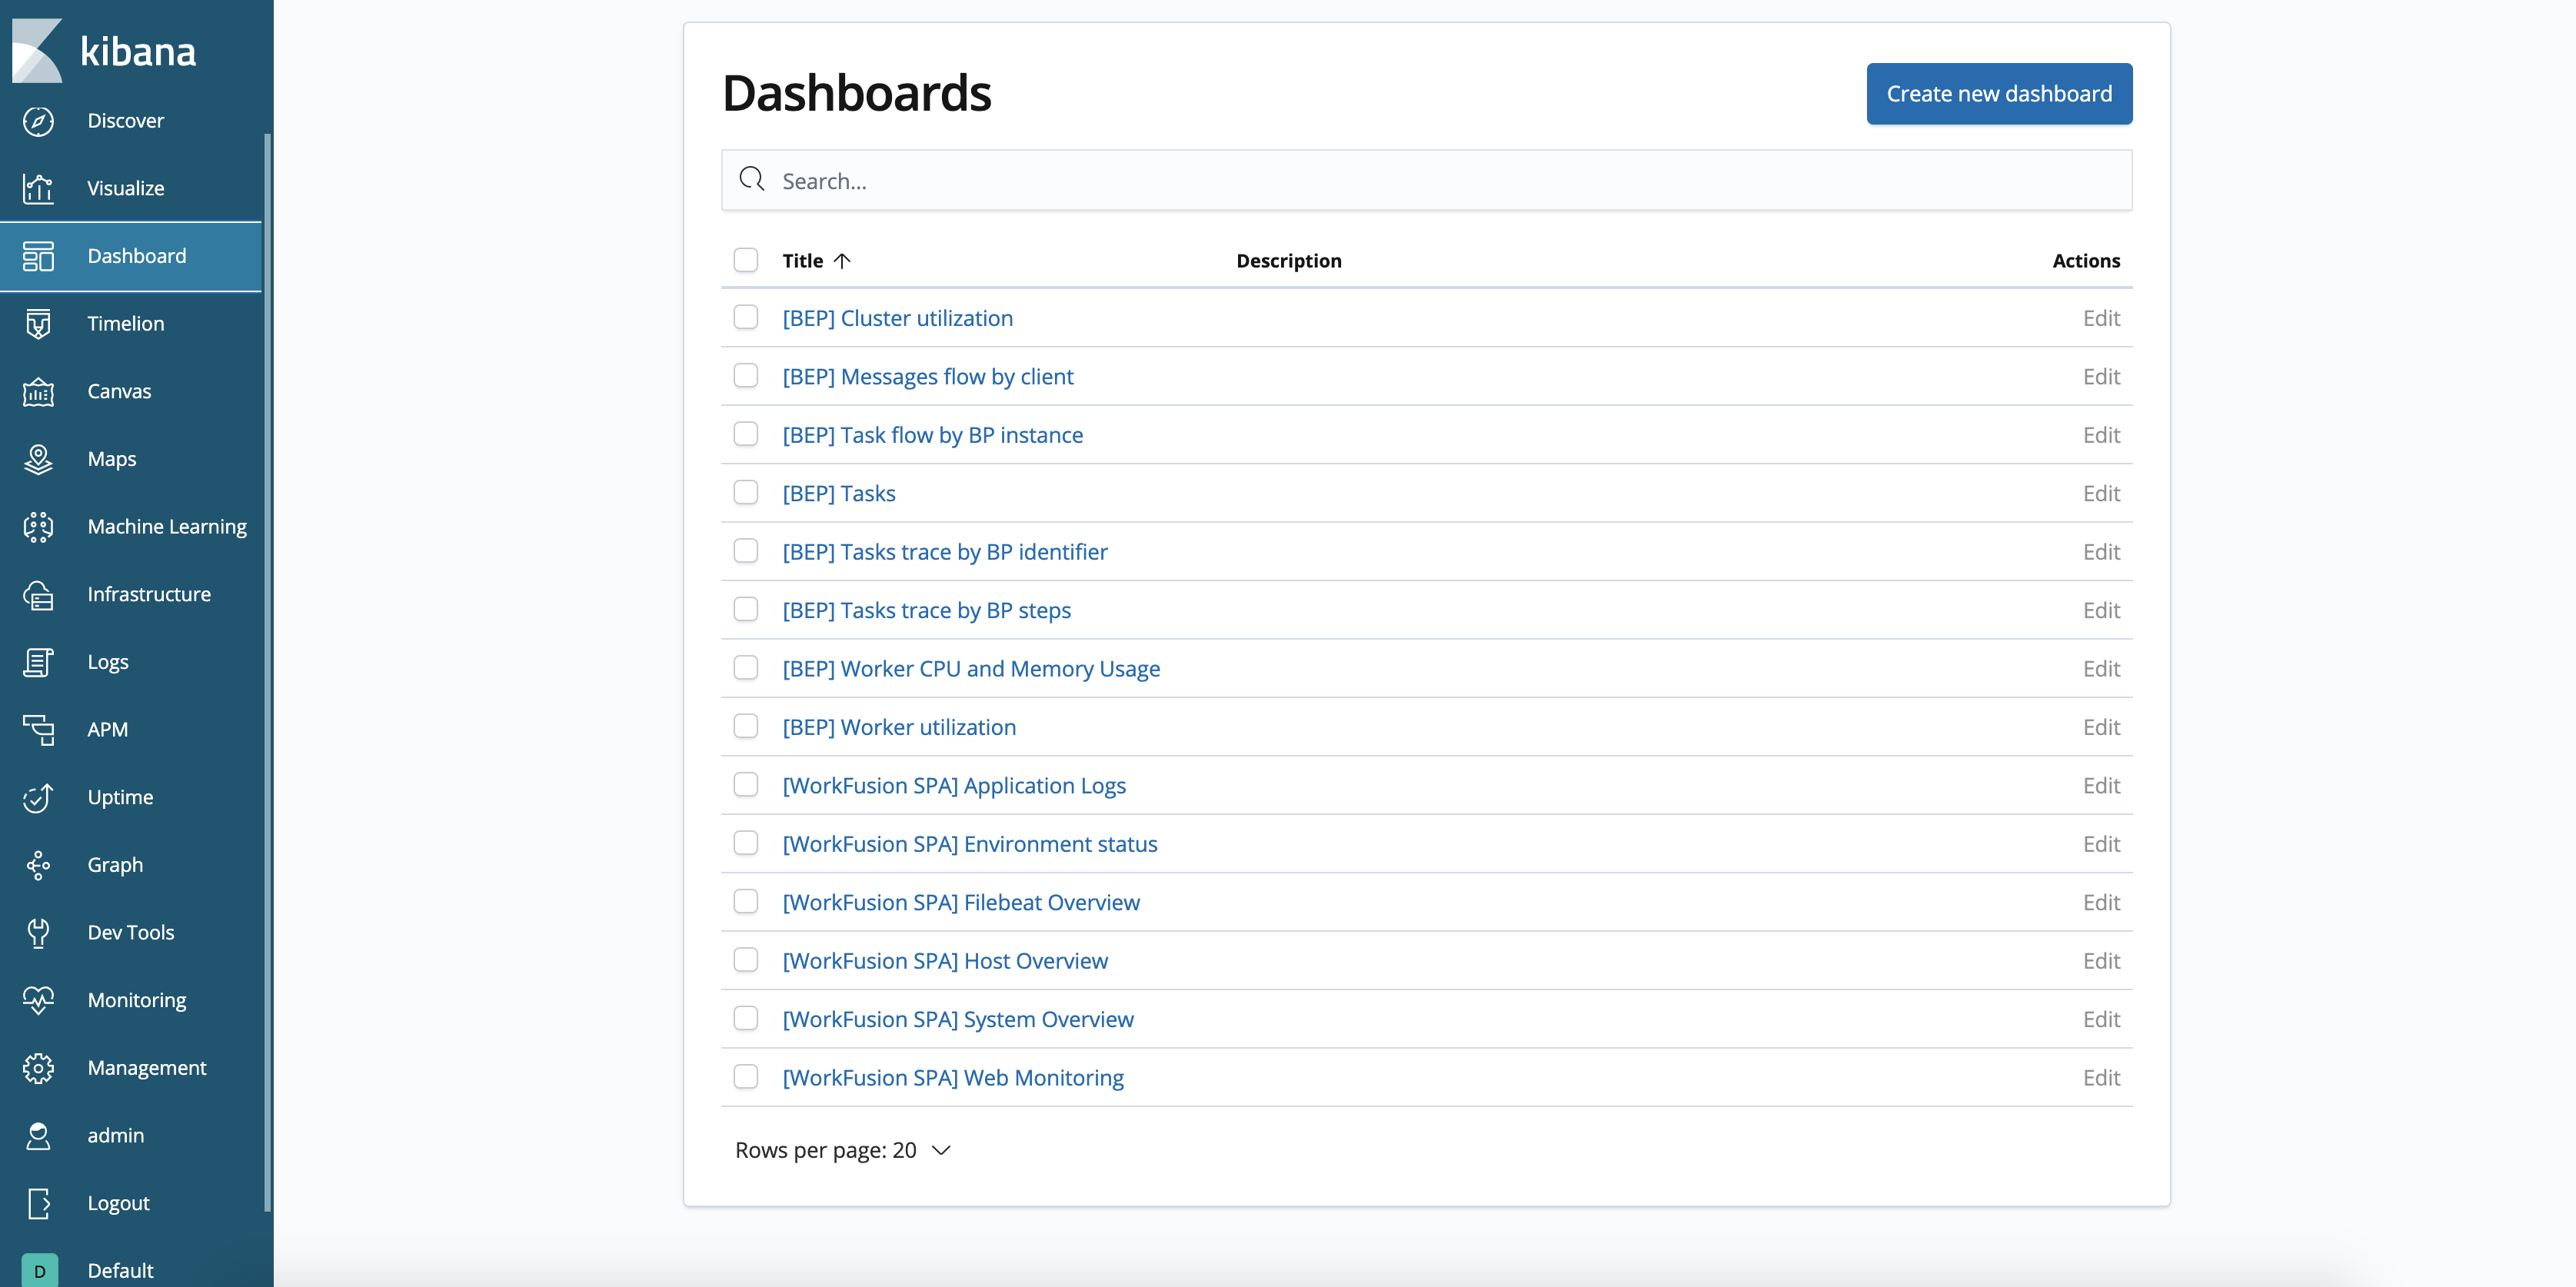
Browse dashboards
System overview
This dashboard contains summary of all configured hosts:
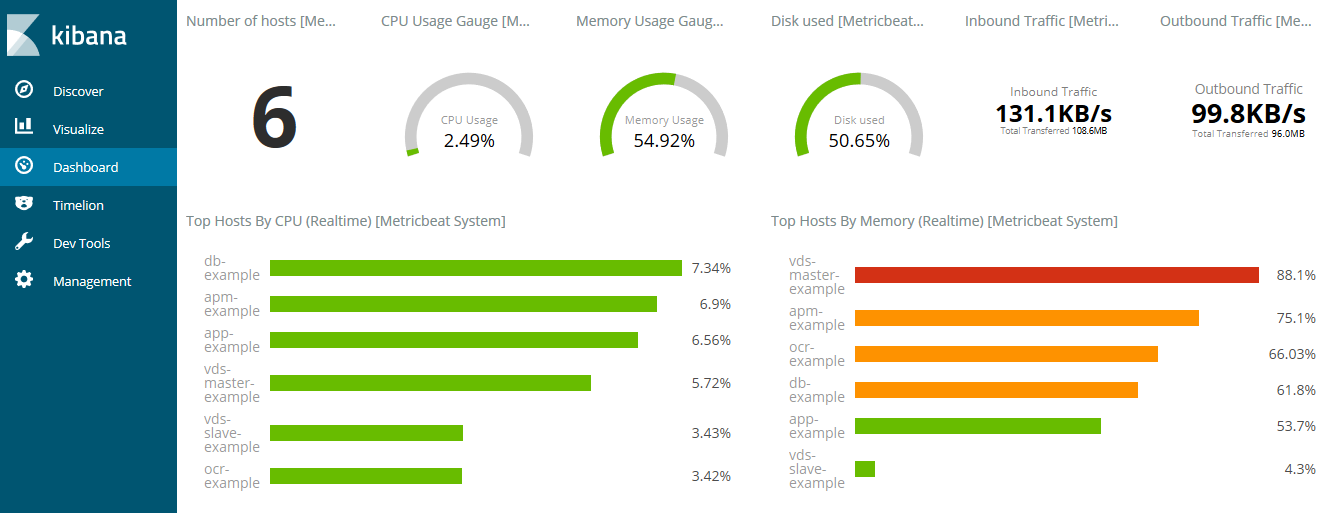
Click a host to open page Host overview dashboard with detailed information on the respective instance.
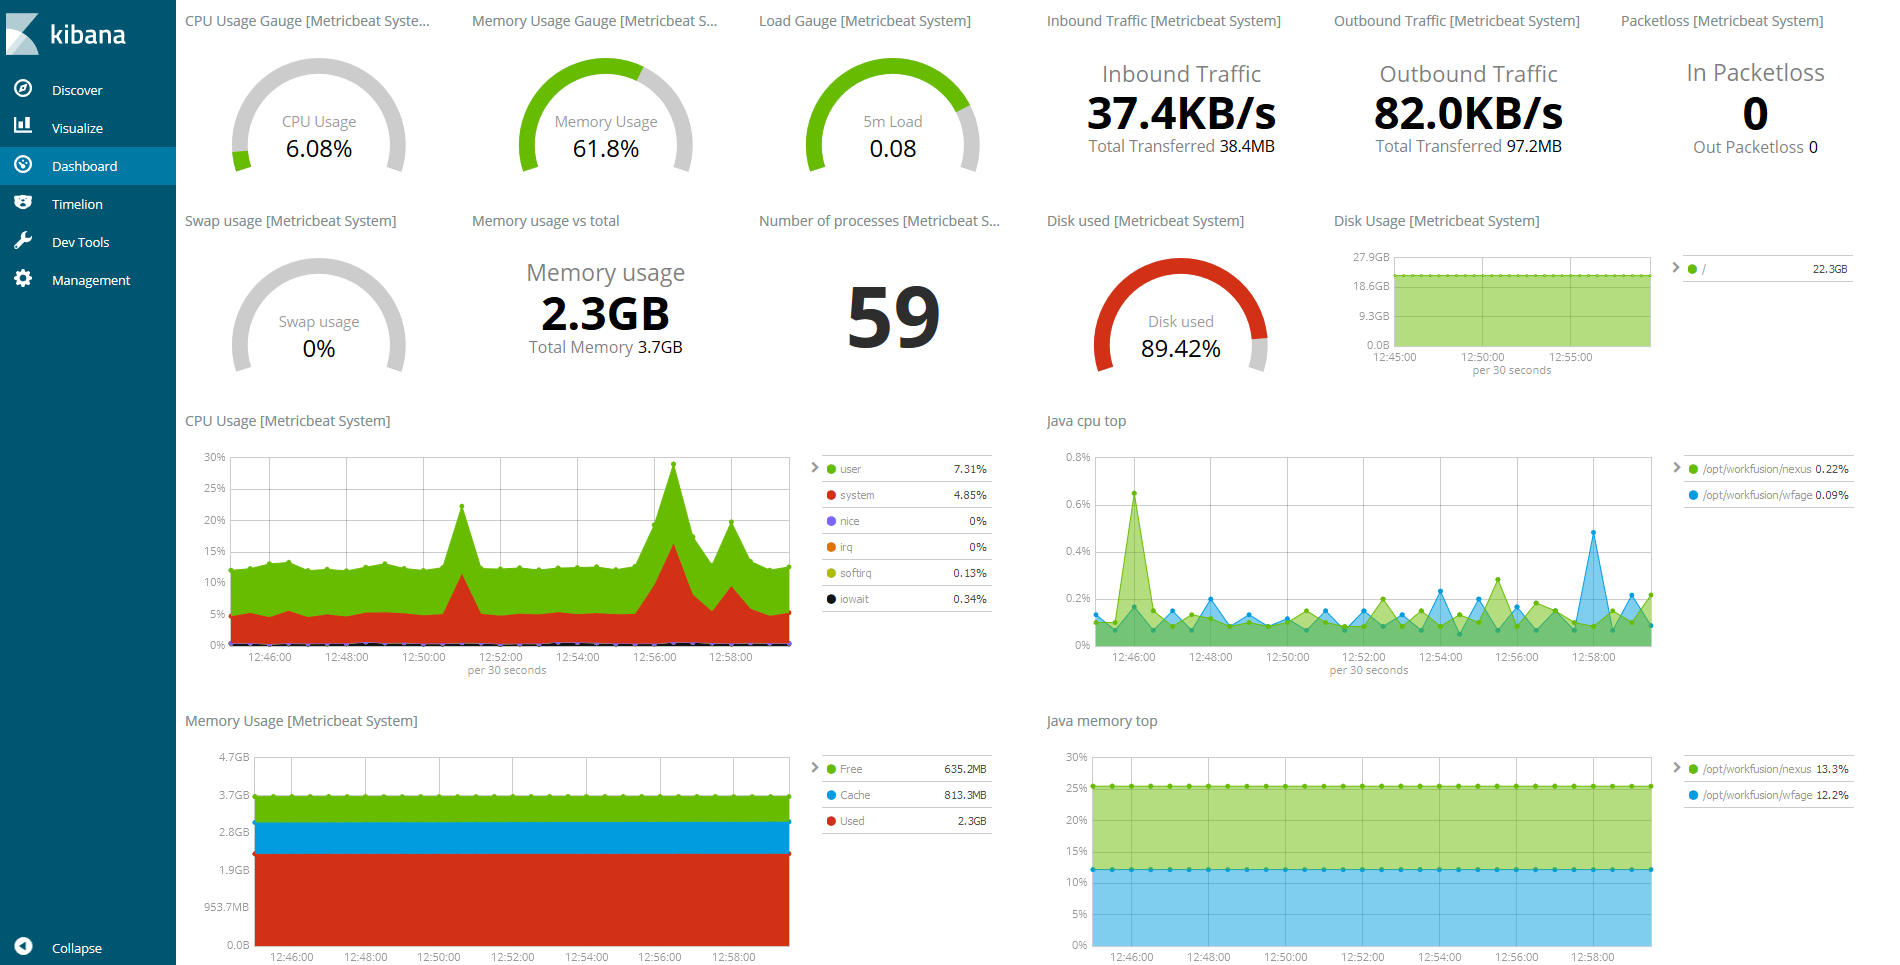
Host overview
This dashboard contains detailed time-series information of the host:
Environment status
This Dashboard displays services' status of Intelligent Automation Cloud environment:
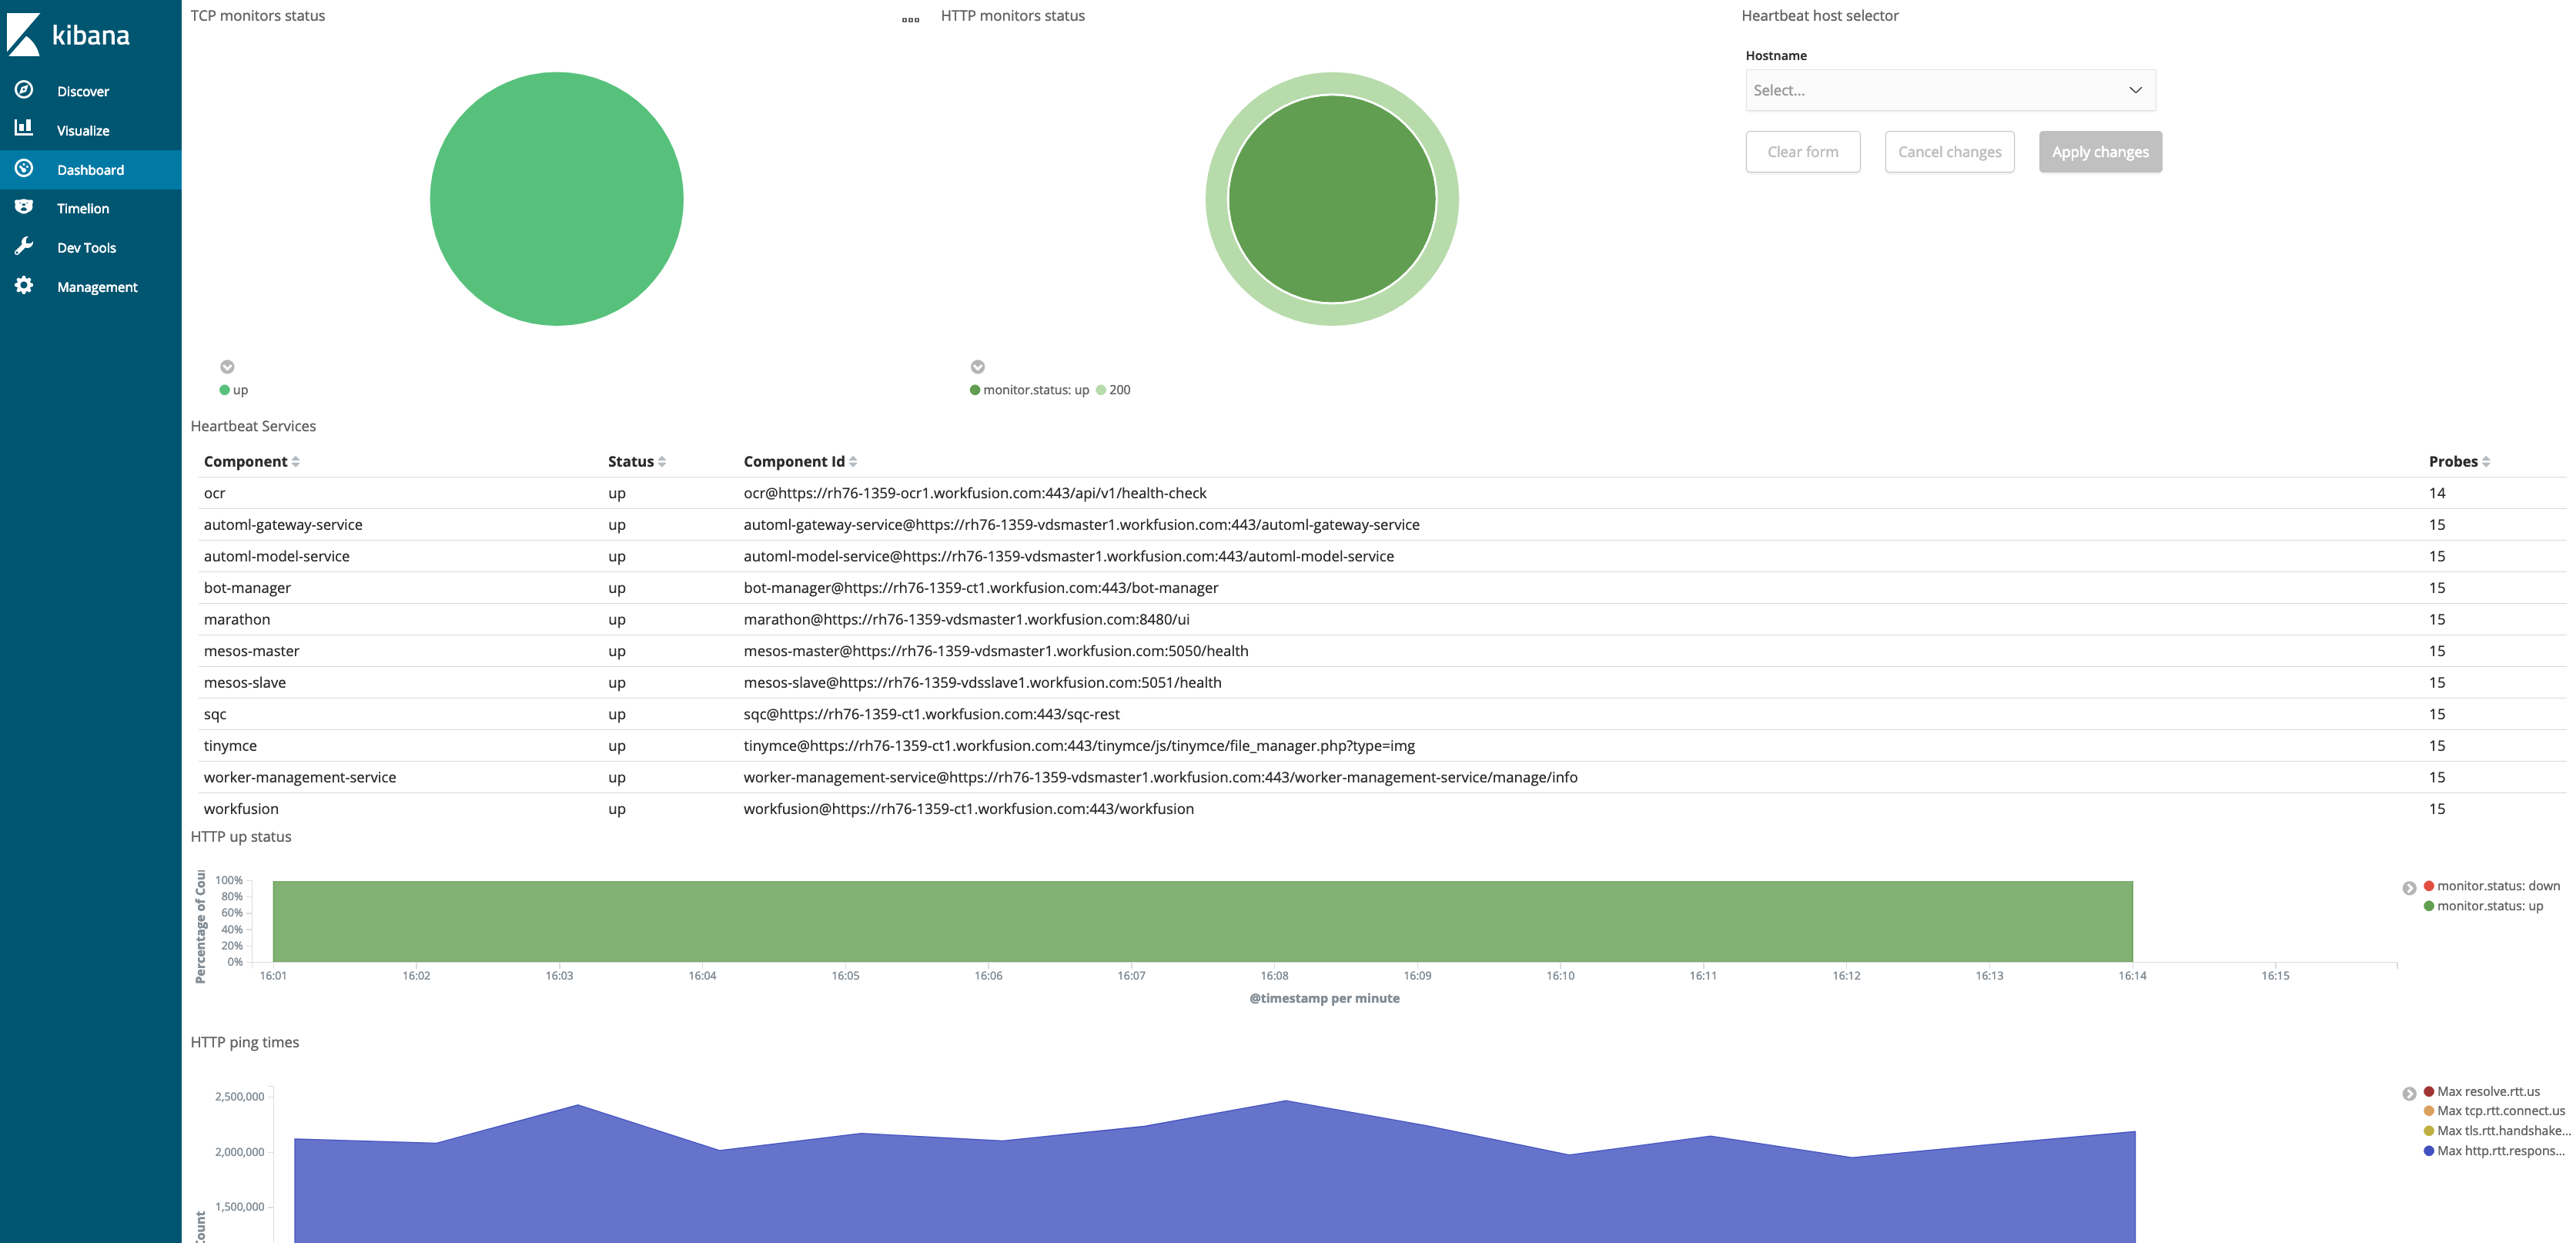
The TCP monitors status and HTTP monitors status diagrams display the overall status:
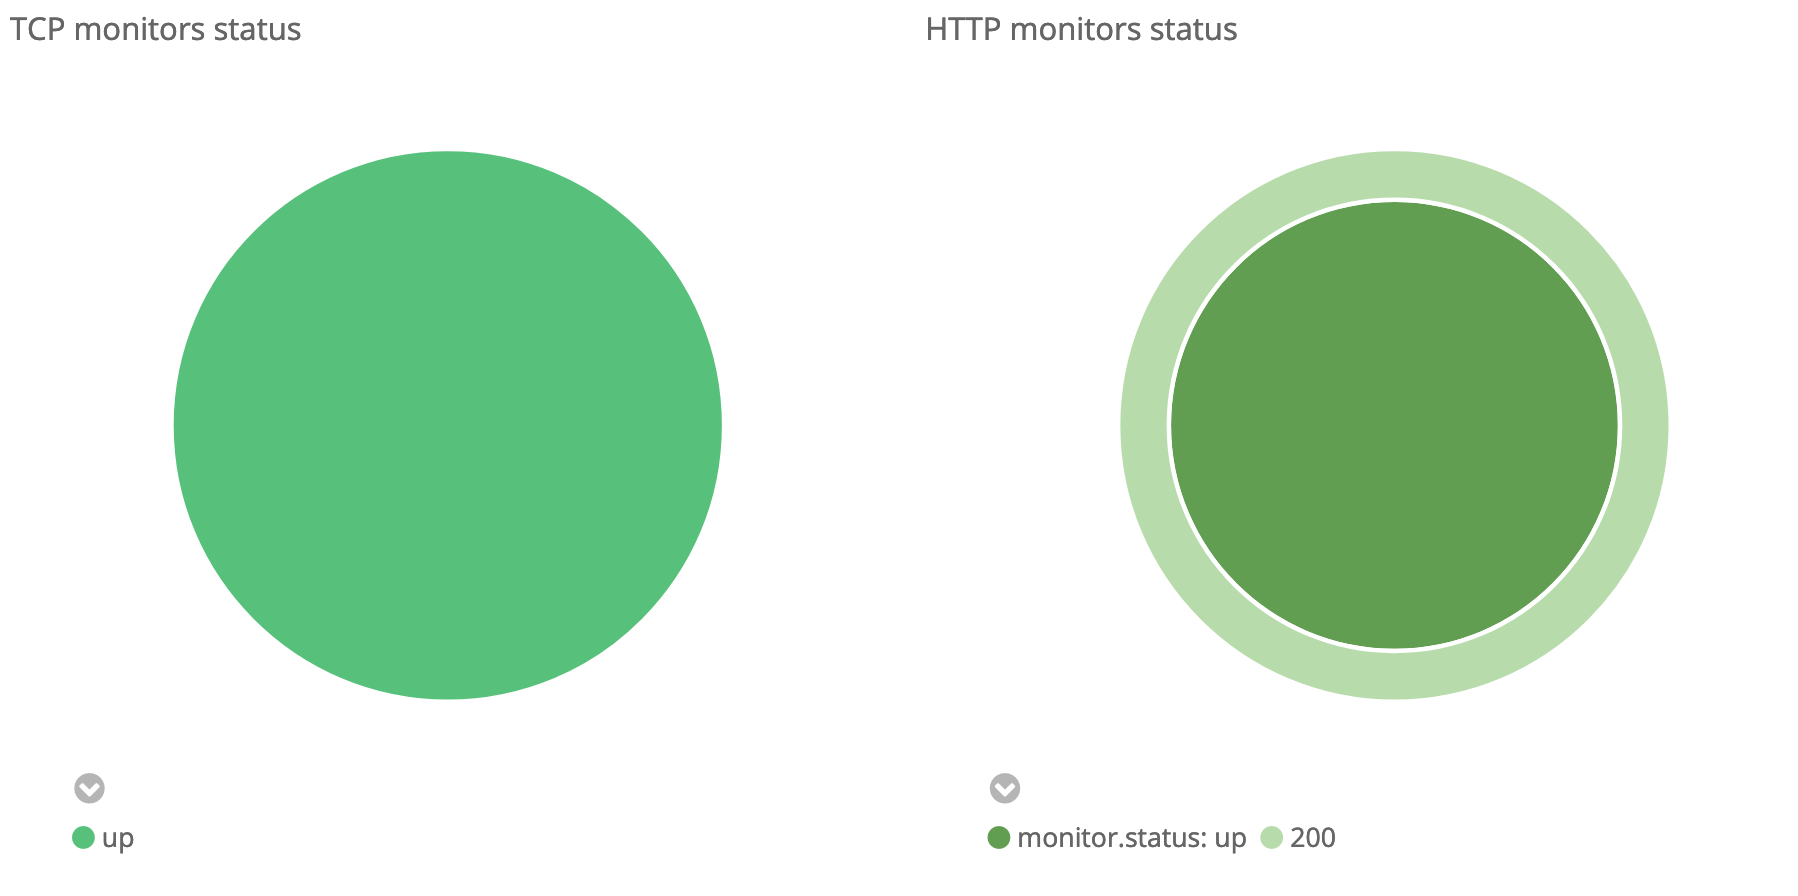
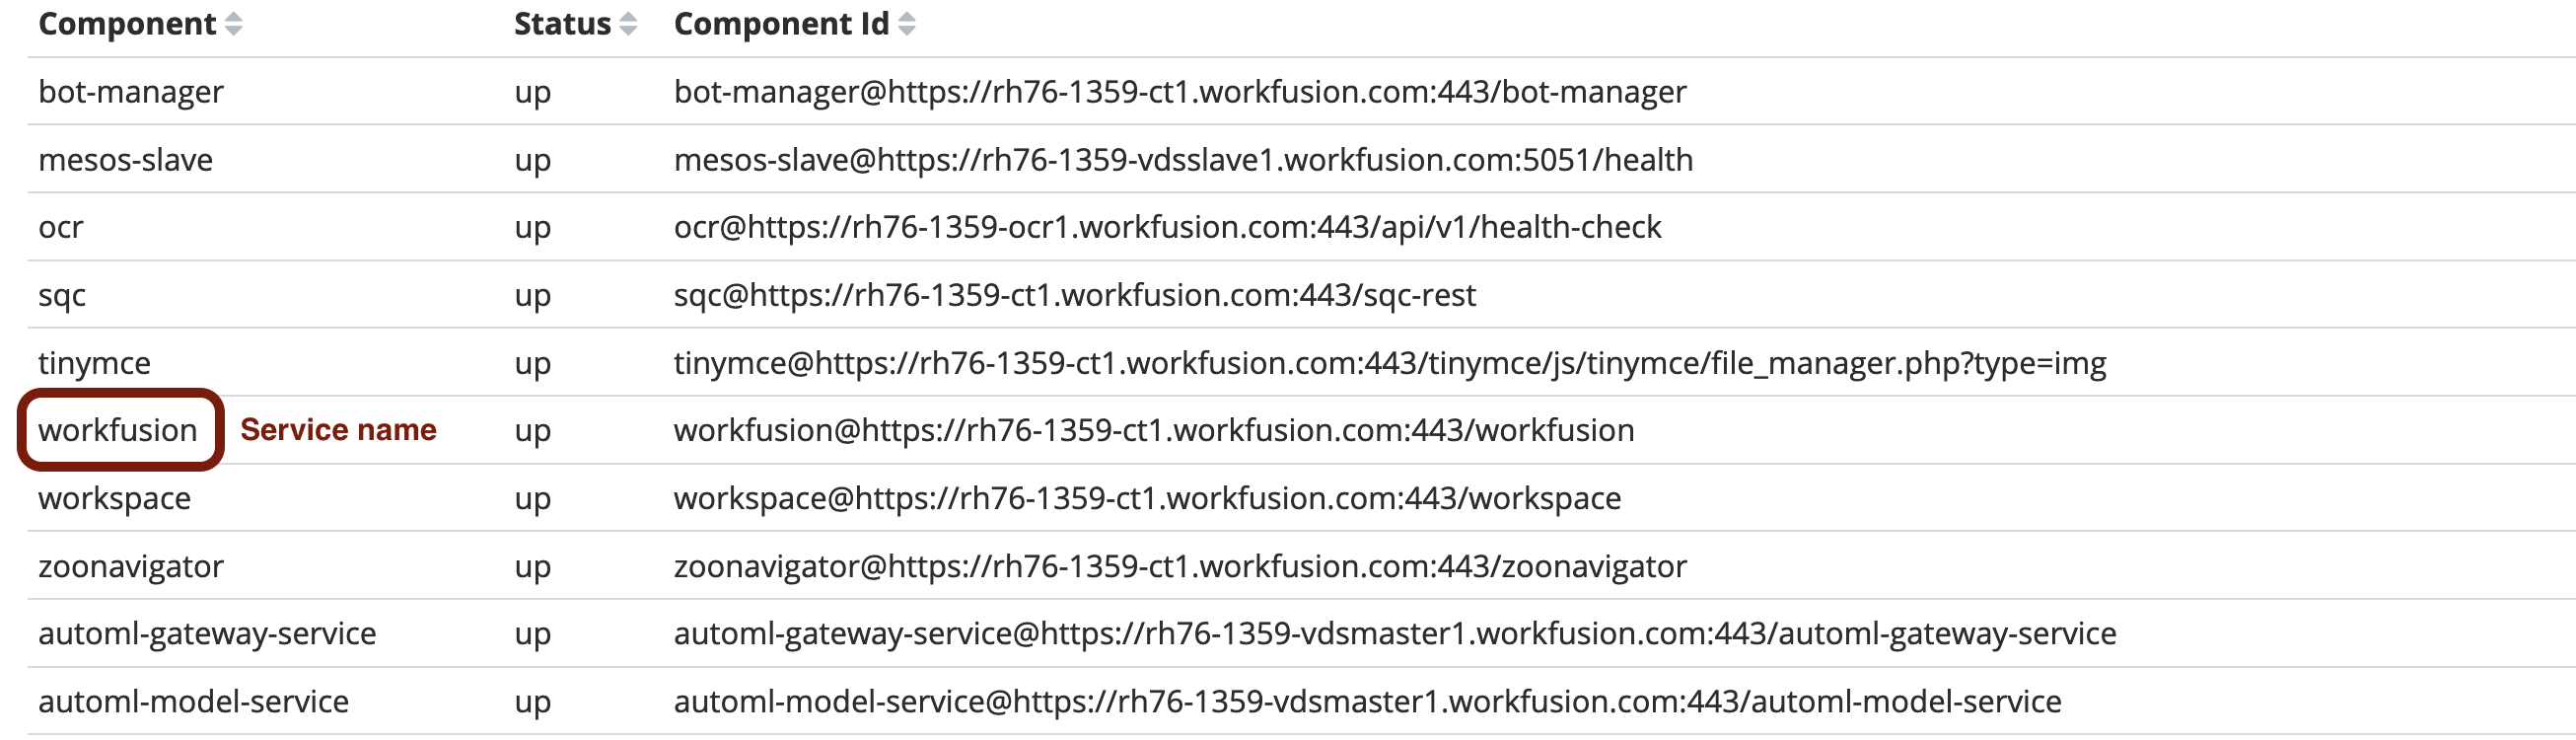
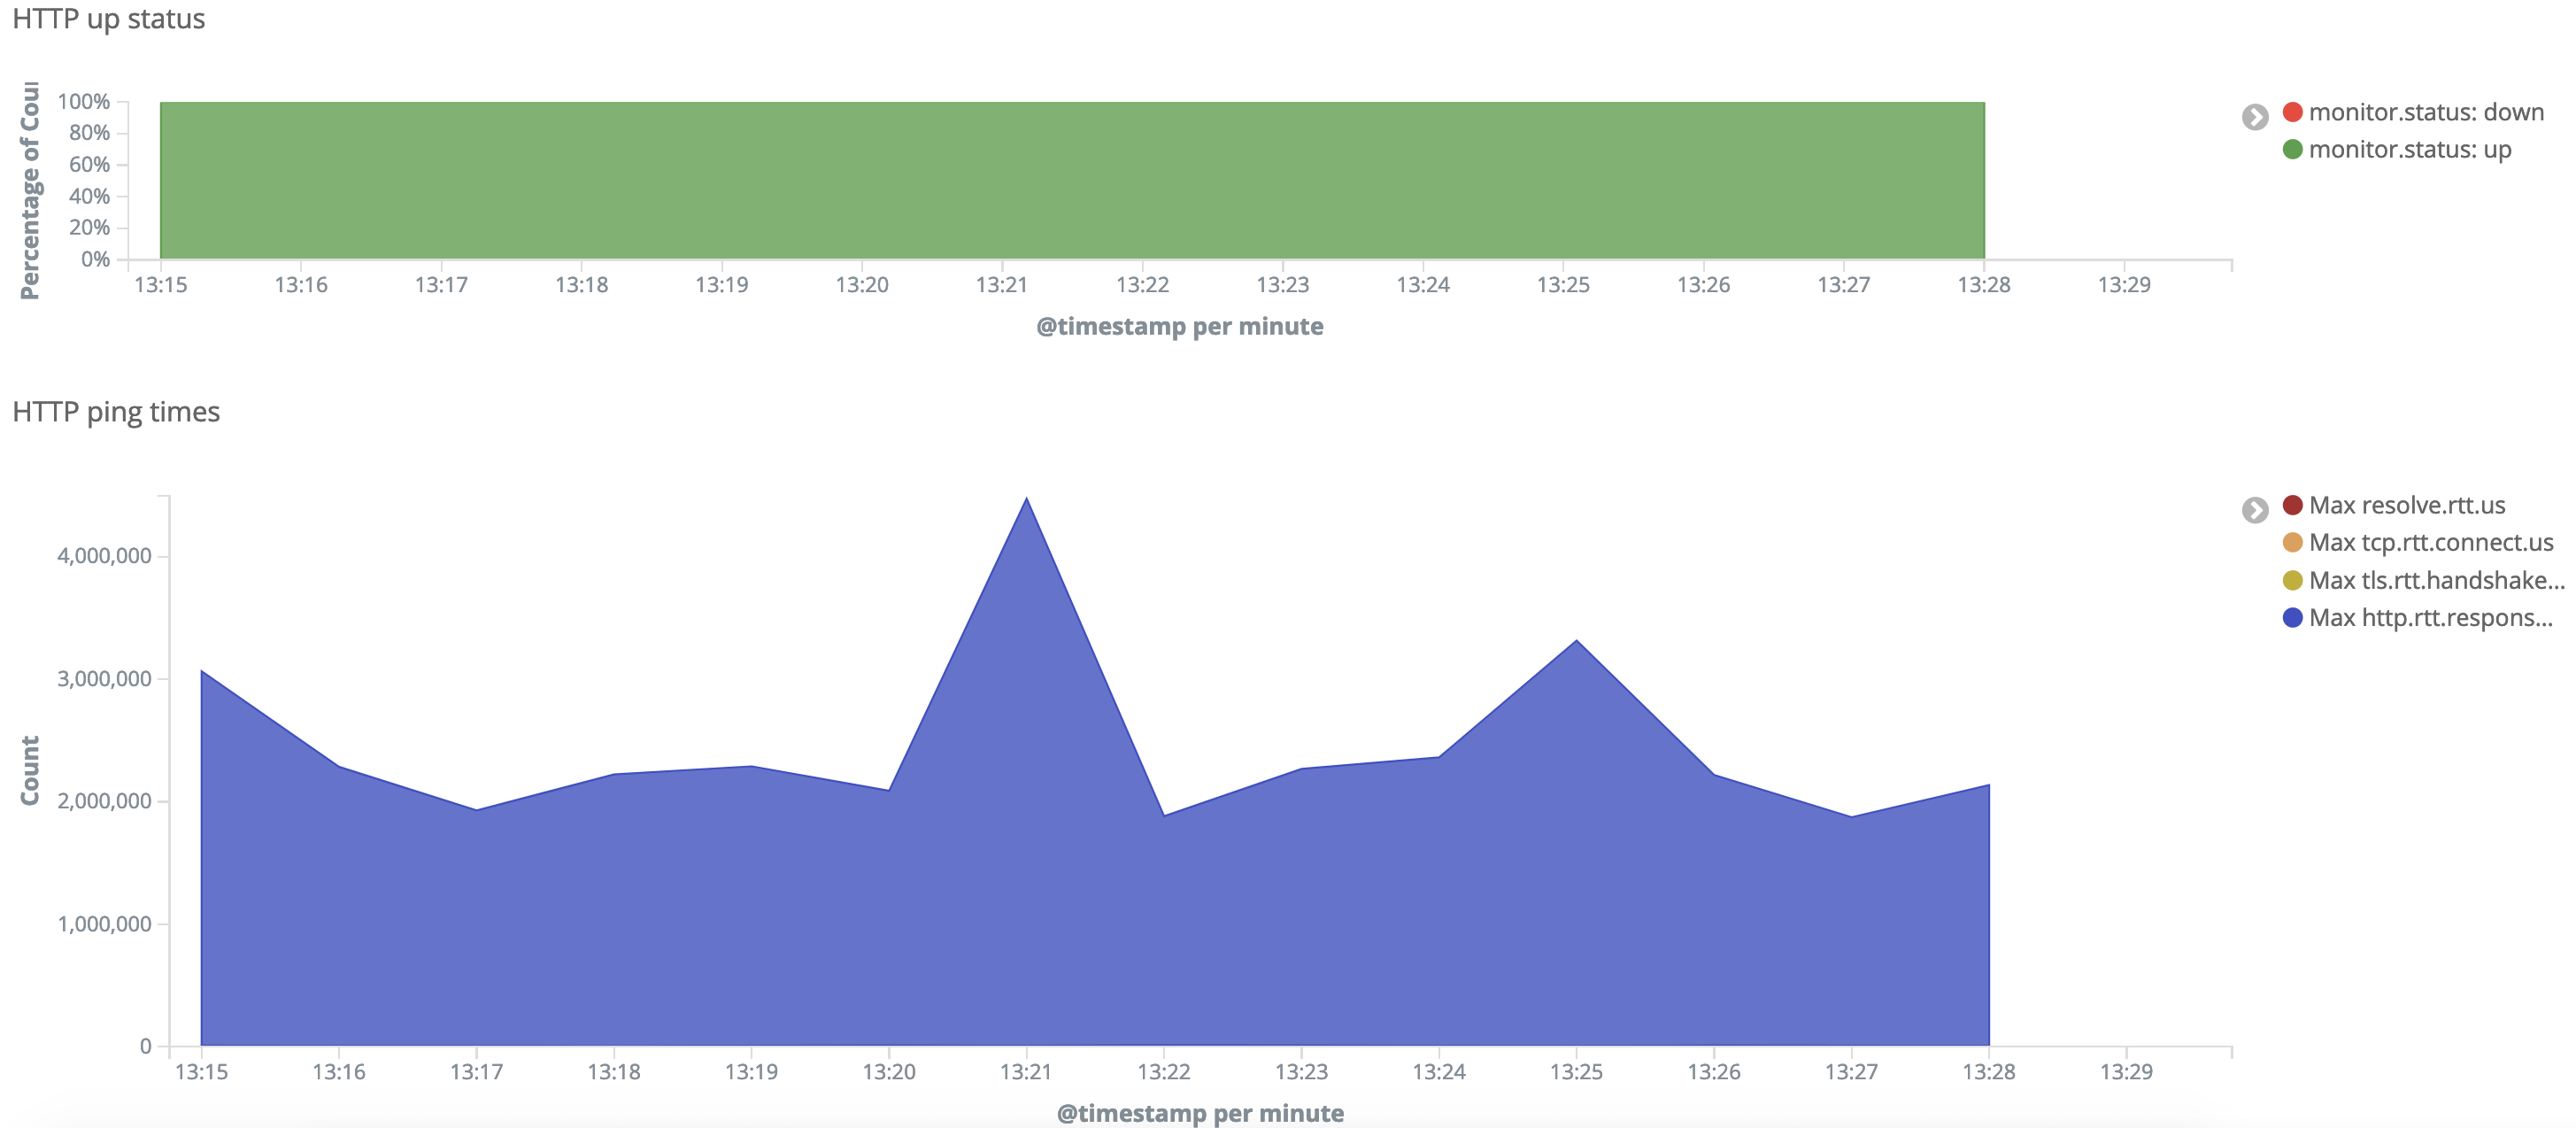
See diagrams Heartbeat Services, HTTP up status, and HTTP ping times for detailed information:
Change monitored directories
Logs can be of several logging level: INFO > WARNING > DEBUG. Most of services emit logs of the INFO type to save space and increase performance of the ELK stack. Increasing the logging level may consume too much RAM and affect the final cost of the system, and thus we don't recommend to track additional directories or increase current logging level of services.
ELK monitors log files of processes in the /logs directories, which are specific for each service. To edit or add a new directory, the Ansible roles must be edited. If such a need arises, create a Service Desk ticket for changing the directories list.