
Overview
The Overview dashboard is the starting point for the analytics across your automation journey. It provides a complete picture of how Business Processes run within Intelligent Automation Cloud Enterprise and allows for drilling down from a high-level view to the execution details of a particular process.
The Overview dashboard aggregates the following data:
- Business Process transaction volumes
- Service Level Agreement (SLA) violation volumes
- SLA violation percentages
The dashboard uses these data to provide the following performance and throughput metrics:
- Volume of Transactions
- Created transactions
- Completed transactions
- Transactions in processing
- Speed
- Processing time
- Wait time
- Total time
- SLA
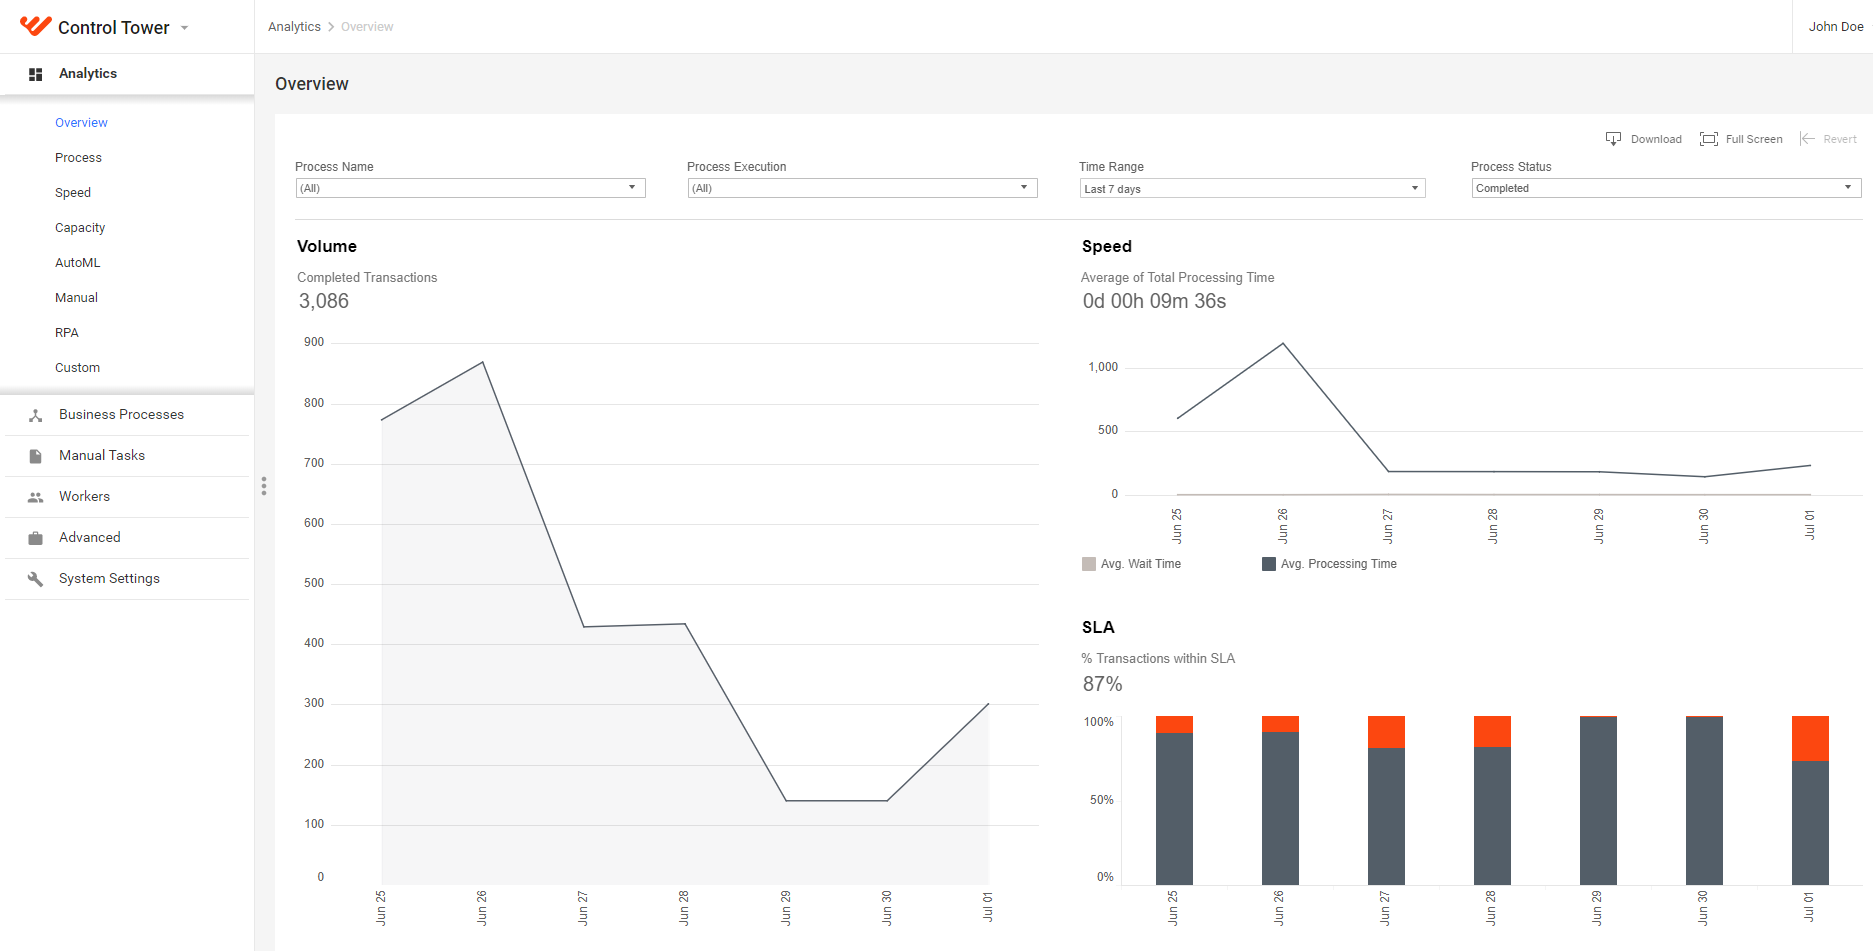
Volume
The Volume chart tracks the number of completed transactions for the day when particular process executions were started.
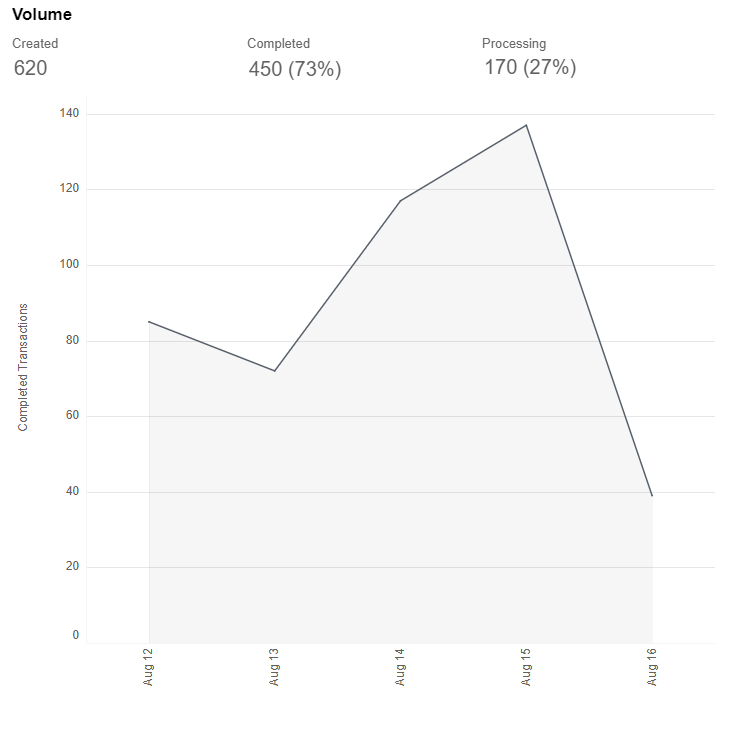
Volume metrics are as follows:
- Created transactions
- Completed transactions and their percentage of total created transactions
- Processing transactions and their percentage of total created transactions
Tooltip
The volume tooltip contains the following data:
- Process Execution Start Date
- Number of completed transactions started on the selected day
- Transaction tracking, with both of the following options indicating the tracking status for the process executions started on a selected day:
- Activated: tracking enabled
- Not Activated: tracking disabled
Speed
The Speed chart provides data on the average Wait and Processing Time per transaction completed daily.
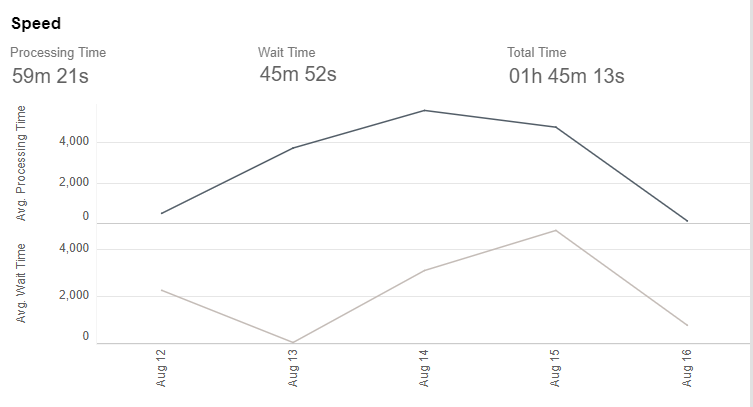
Speed metrics are as follows:
- Processing Time: the average time per completed transaction.
- Wait Time: the average time spent in queues per completed transaction.
- Total Time: the average end-to-end time per completed transaction, including Processing Time and Wait Time.
Tooltip
The speed tooltip contains the following details:
- Process Execution Start Date
- Average Processing Time
- Average Wait Time
Service Level Agreement (SLA)
Service Level Agreement (SLA) is used to define whether transaction processing meets business expectations. SLA can be set only if transaction tracking is enabled. For details, refer to Track transactions.
The SLA chart shows the percentage of transactions within SLA relative to the total of transactions completed daily.
note
If SLA is not set for a process execution, all associated transactions are considered to be within SLA by default.
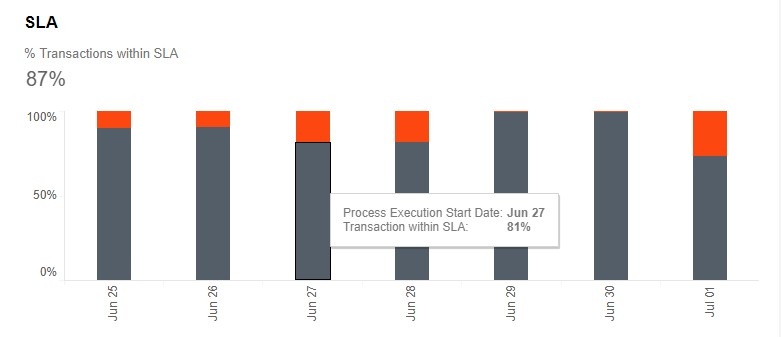
Transactions within SLA are highlighted in grey, SLA violations are marked with red.
Tooltip
The SLA tooltip contains the following details:
- Process Execution Start Date
- Percentage of transactions within SLA or percentage of SLA violations, depending on the bar area you are hovering over