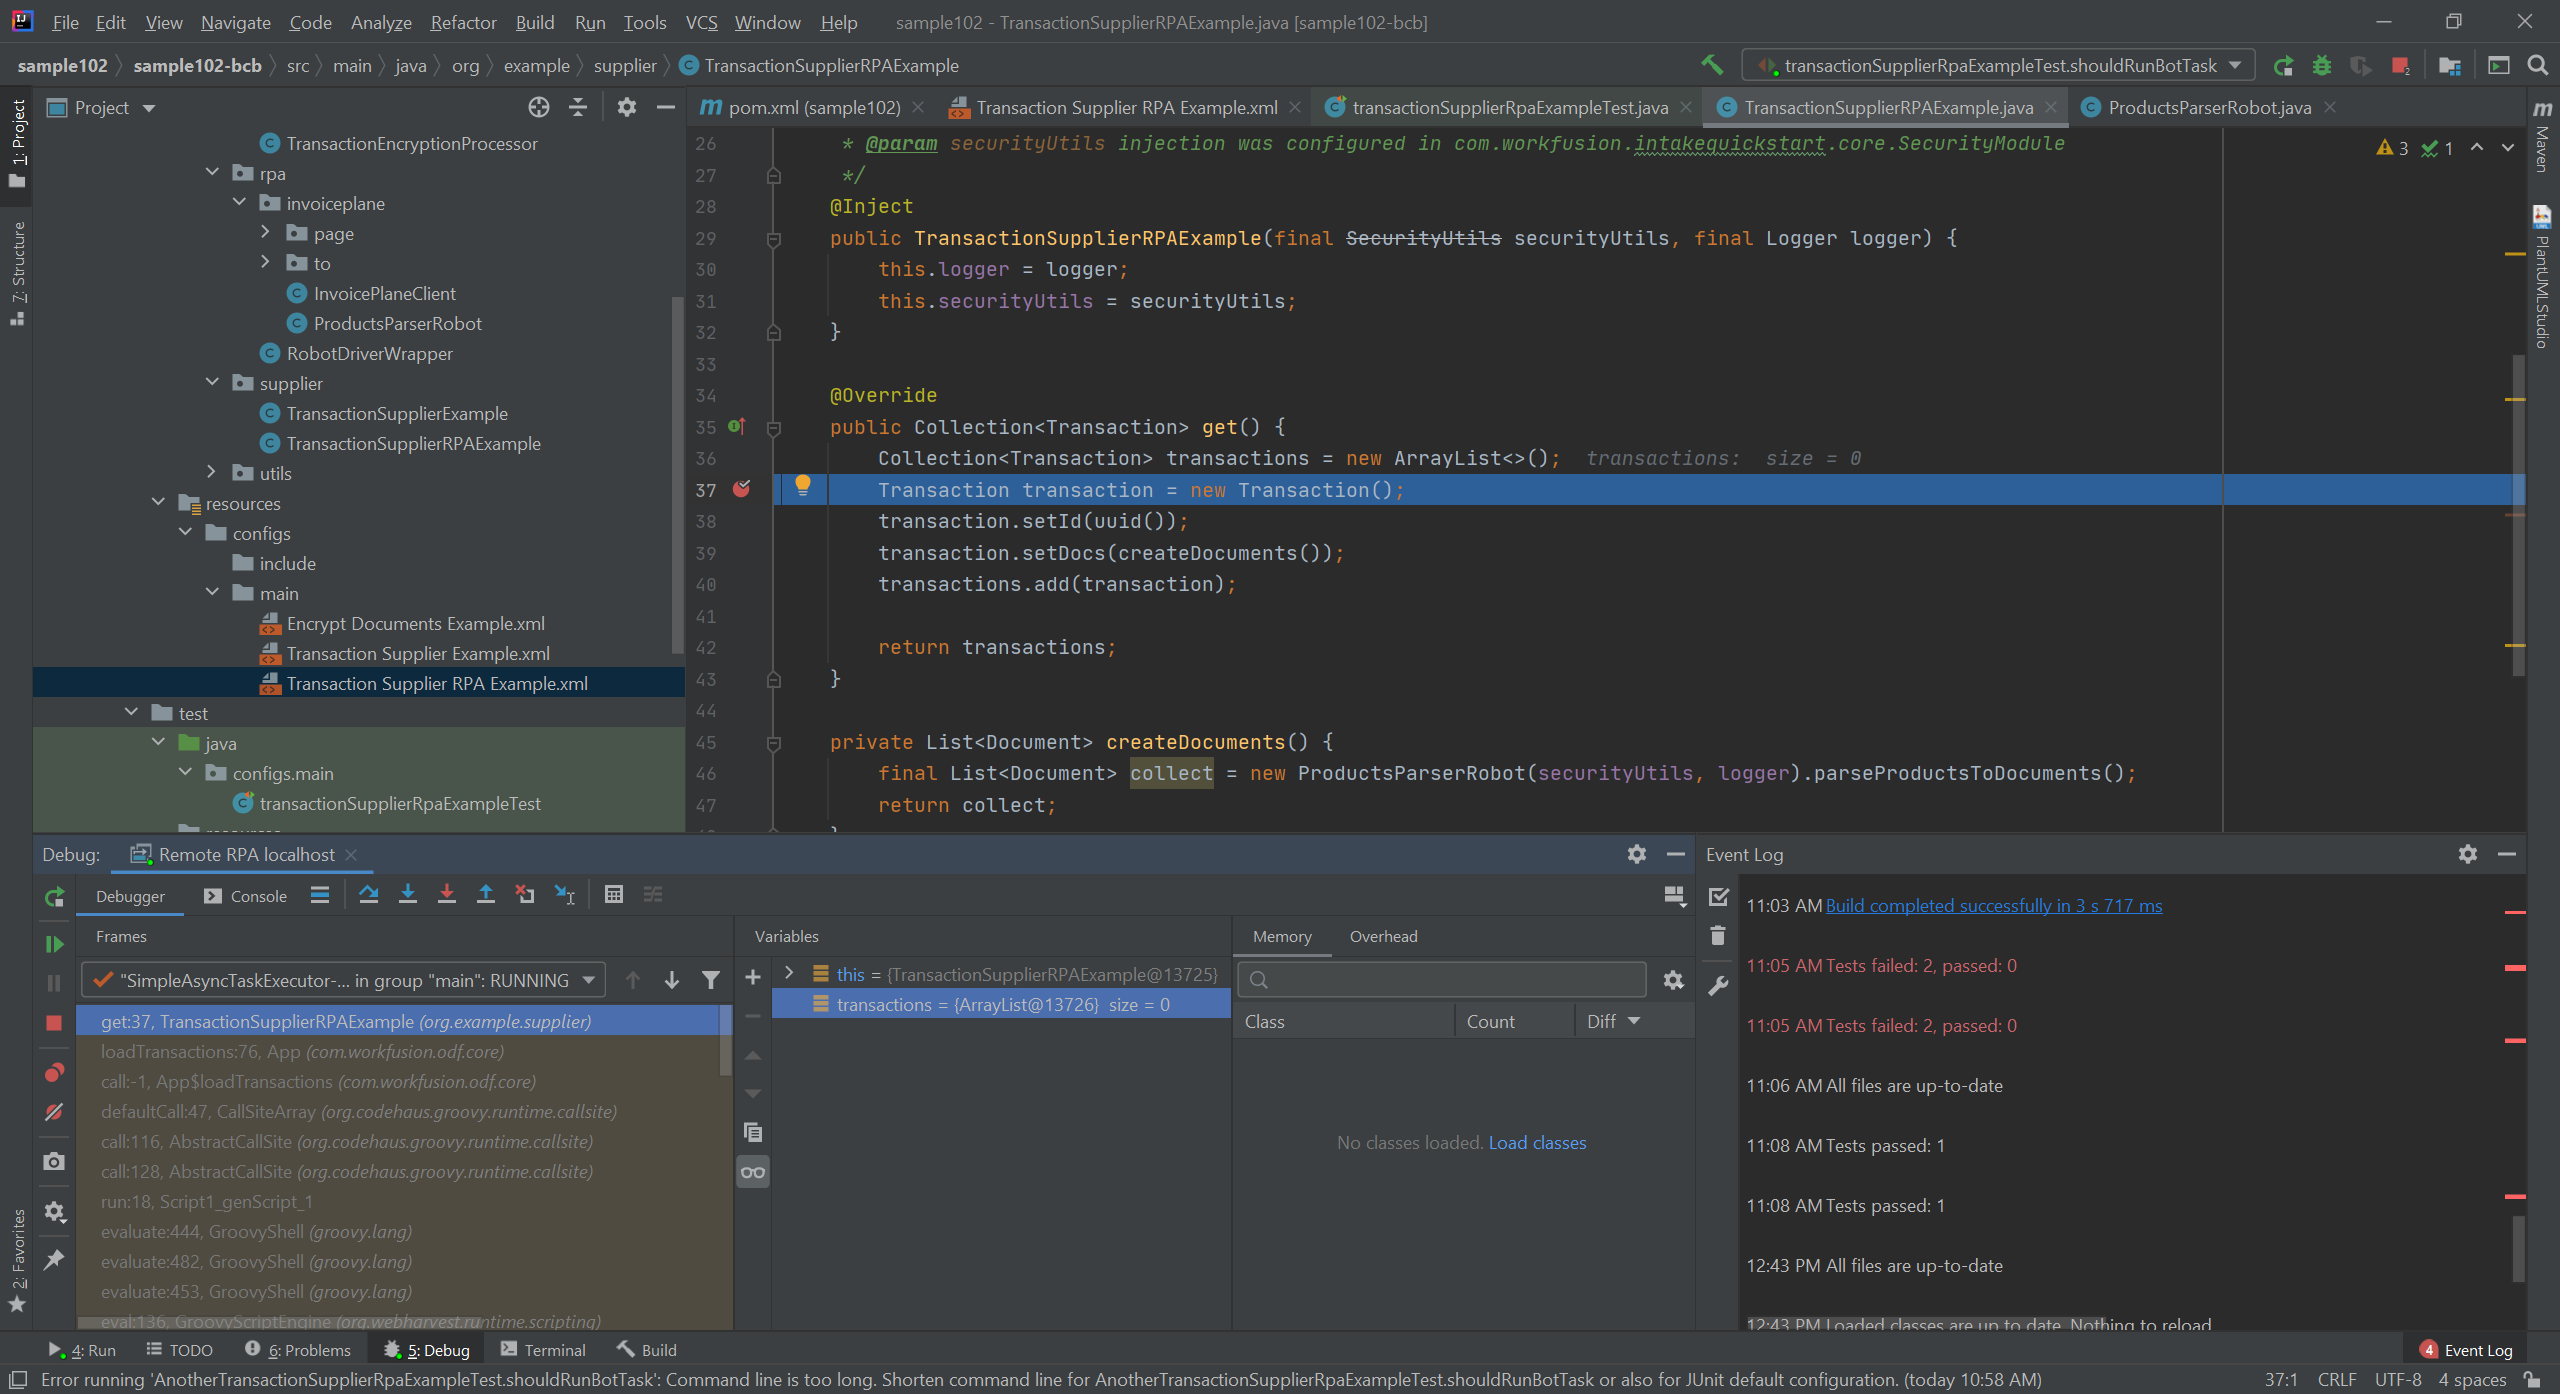
Run and debug Bot Task
The tutorial below helps to learn how to debug RPA (actually any Bot Task in your Maven project) in IDEA with the help of IA Cloud Developer:
note
Ignore the IDEA plugin installation shown in this video. WorkFusion terminated the plugin support.
To run or debug a Bot Task, you must generate and execute a Bot Task unit test. Any settings required for the specific Bot Task run must be coded in the test itself. WorkFusion provides Bot Task JUnit API for that.
Start IA Cloud Developer and its components
tip
Launching of Server components is optional. It is required in case your Bot Task code contains work with RPA.
It is recommended to launch Server components on a local workstation:
- Start IA Cloud Developer. The Launcher application runs automatically.
- To work with RPA, start the RPA Worker group. Wait until the server components start. The indicator will become green. Now, you are ready to execute Bot Tasks from IDEA.
Run Bot Task
To run the Bot Task unit test, perform the following actions:
If your Bot Task contains RPA code, make sure you have started IA Cloud Developer and the RPA Worker group in Launcher.
In IDEA, open a Bot Task XML.
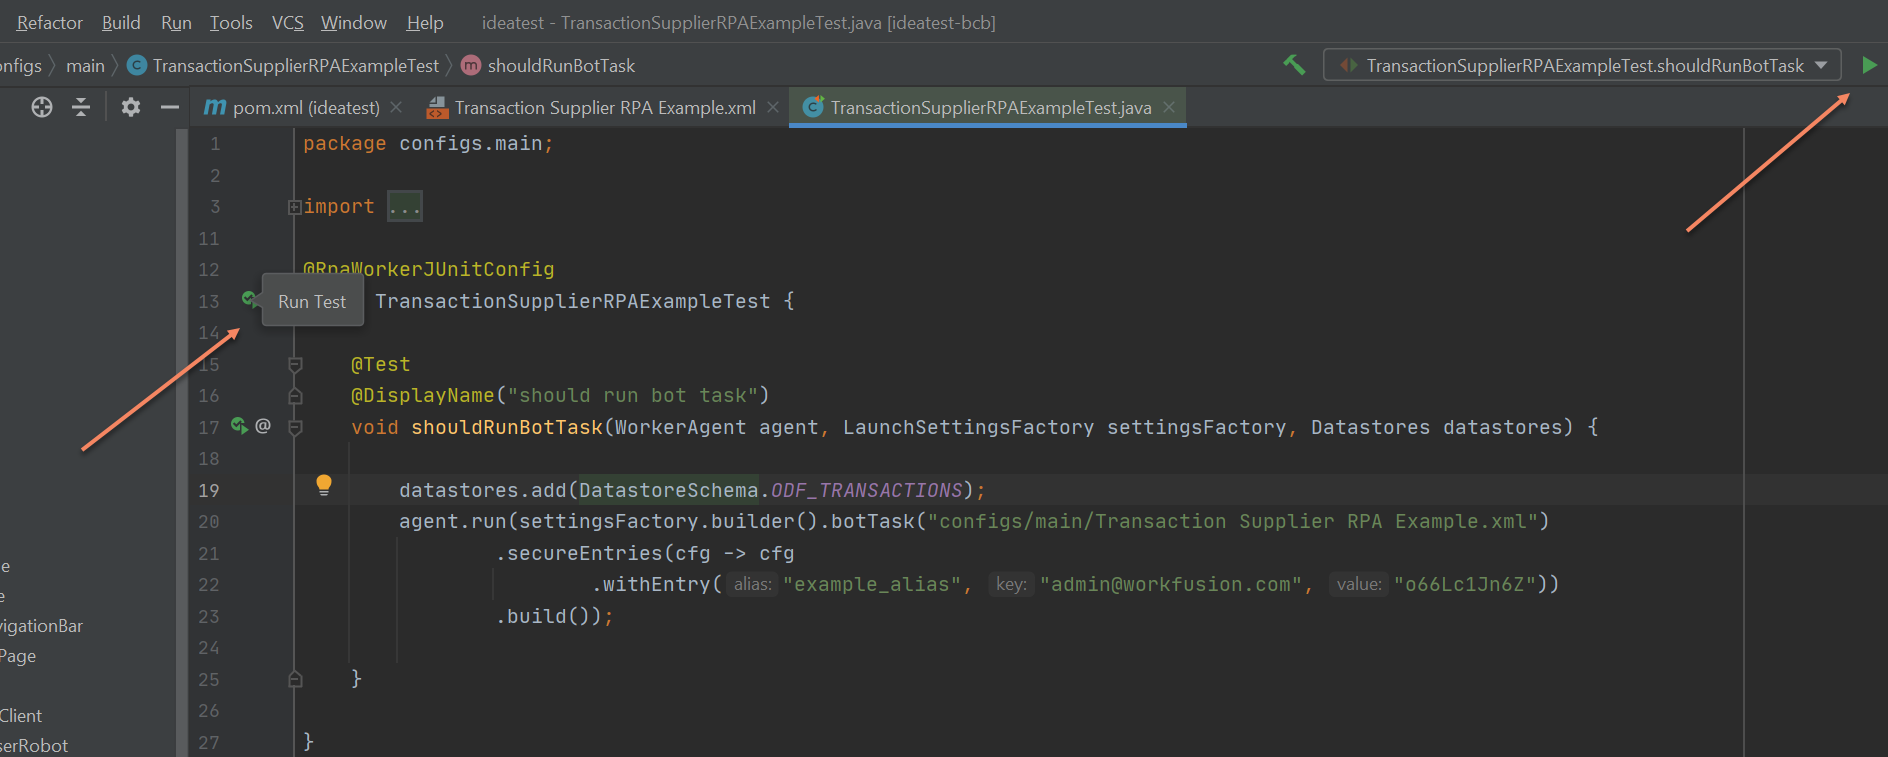
Code a Bot Task test using examples generated by the recent Archetype or copy and modify an example from the documentation.
Once you finish coding the Bot Task unit test, you can run it immediately using any standard IDEA way.
Possible issues
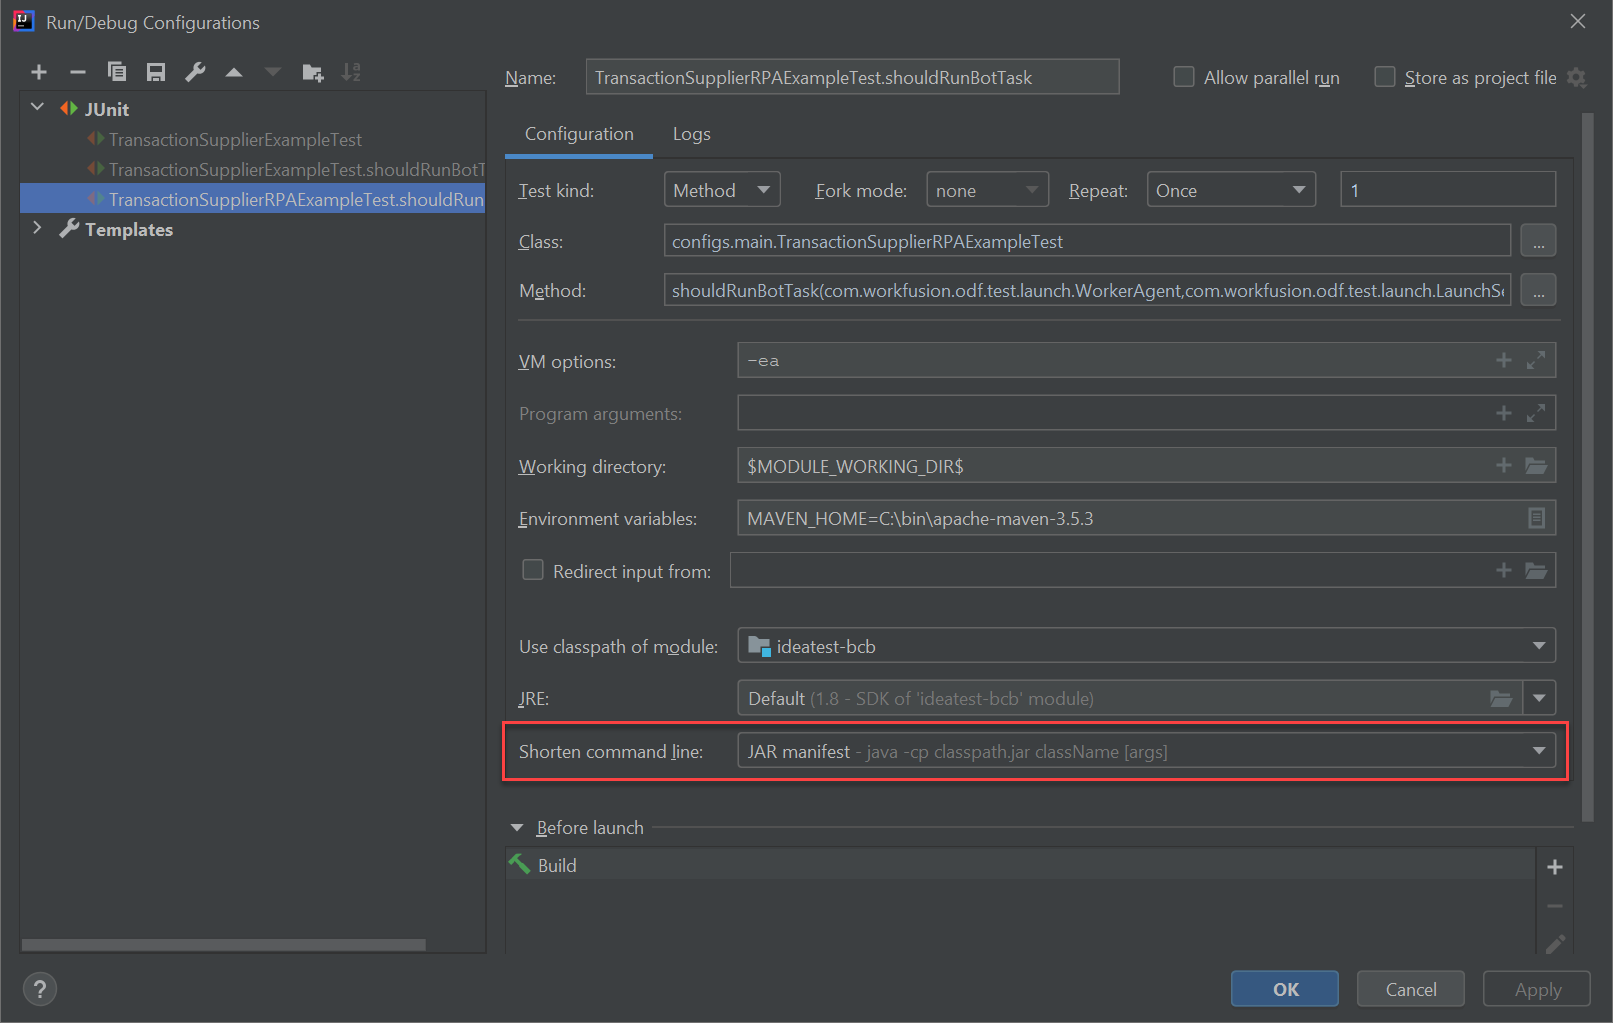
If the Bot Task test fails with the CLASSPATH exception, ensure you have the JAR manifest value selected for the Shorten command line property in the JUnit configuration of your Bot Task test.
Debug Bot Task
There are two different approaches to debug.
- If a Bot Task does not contain the RPA code, it's executed in Worker launched by test. Running your test in the Debug mode will do the job; execution stops on any breakpoint in Java classes.
- When a Bot Task contains RPA, the execution is performed on an "external" or remote Java process. Here, you should apply the remote debug approach. To configure remote debug, follow the instructions below.
Configure and launch RPA Worker in remote debug mode
To configure and launch RPA Worker in remote debug mode:
Open C:\IntelligentAutomationCloudDeveloper\RPA\start-worker.bat and add additional configuration to have RPA Worker started in remote debug mode:
Add the
-agentlib:jdwp=transport=dt_socket,server=y,suspend=n,address=5005parameter into the last command in the file which launches RPA Worker.java\bin\java -agentlib:jdwp=transport=dt_socket,server=y,suspend=n,address=5005 -Djava.awt.headless=false -Xms128m -Xmx256m^ -Dspring.config.additional-location=worker/worker-application.properties^ -Dlogging.config=worker/worker-logback-config.xml^ %MFW_OPTS% %DRIVERS_OPTS% -cp "worker\worker-app.jar;java/lib/tools.jar;worker/lib/h2-1.4.200.jar"^ org.springframework.boot.loader.JarLauncherGo to the Launcher application and start RPA Worker. You should see a green status and the console output beginning with the message
Listening for transport dt_socket at address: 5005.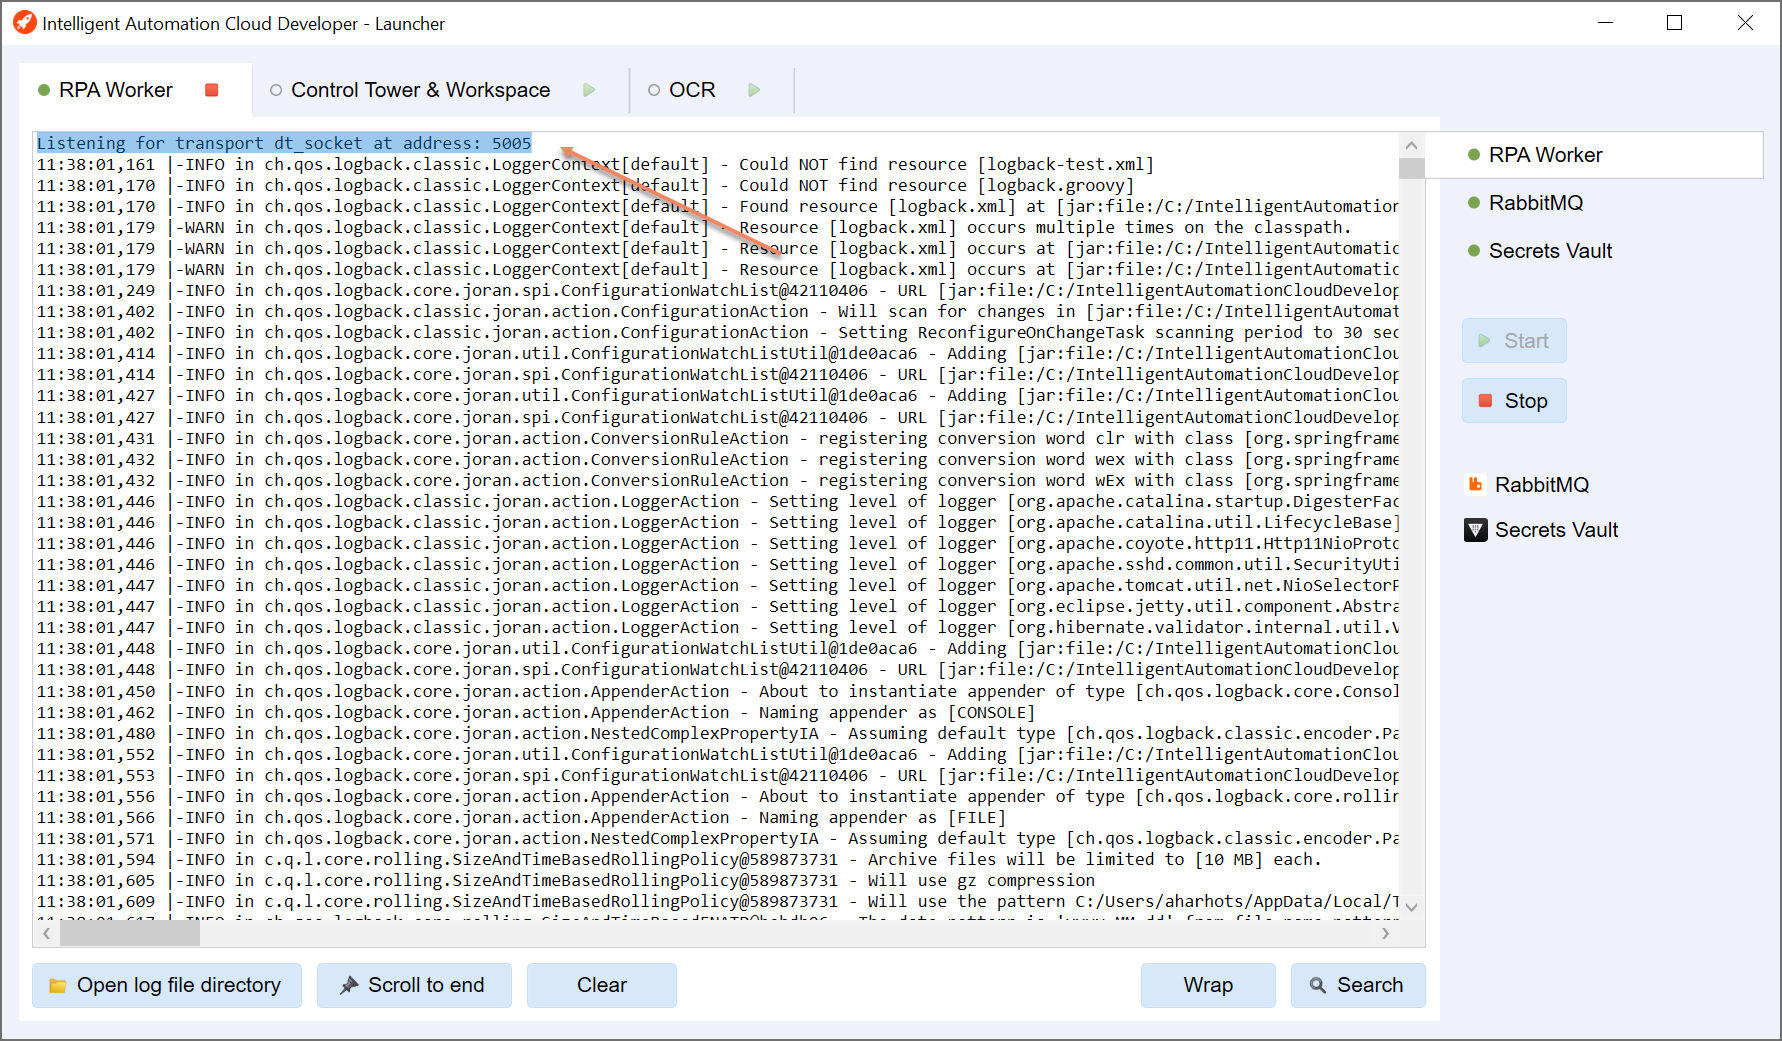
Add breakpoints
In Java class's methods, which you expect to be executed, put your breakpoints. Breakpoints may interrupt RPA driver manipulations with the application at any time.
Create and run remote debug launch configuration
In the IDEA main menu, select Run/Edit Configurations or press
Alt+Shift+F10and then0.In the Run/Debug Configurations window, click the Add New Configuration button ("+") and select Remote.
Enter a configuration name. Leave default port as 5005.
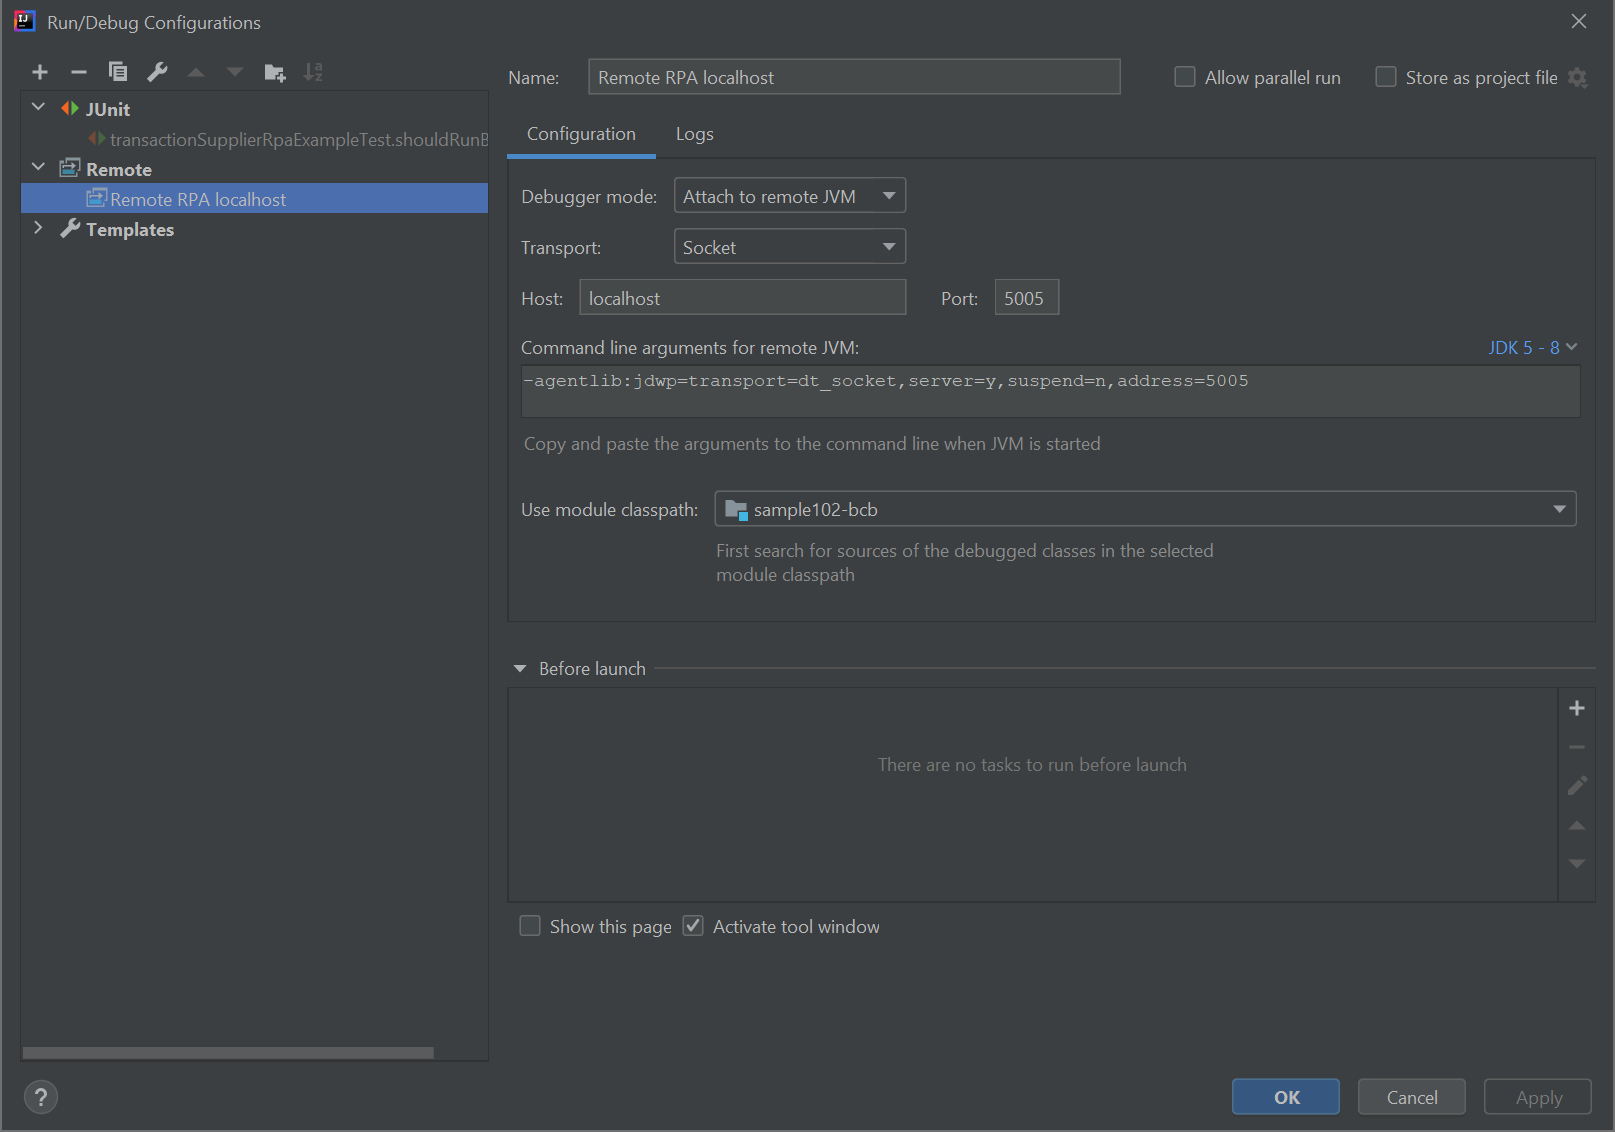
Click Apply.
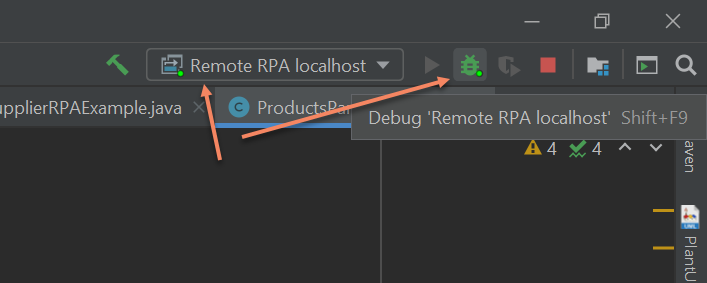
Launch this configuration in the Debug mode.
Launch your Bot Task test
Now you can run your Bot Task test. It doesn't matter whether you run or debug it.
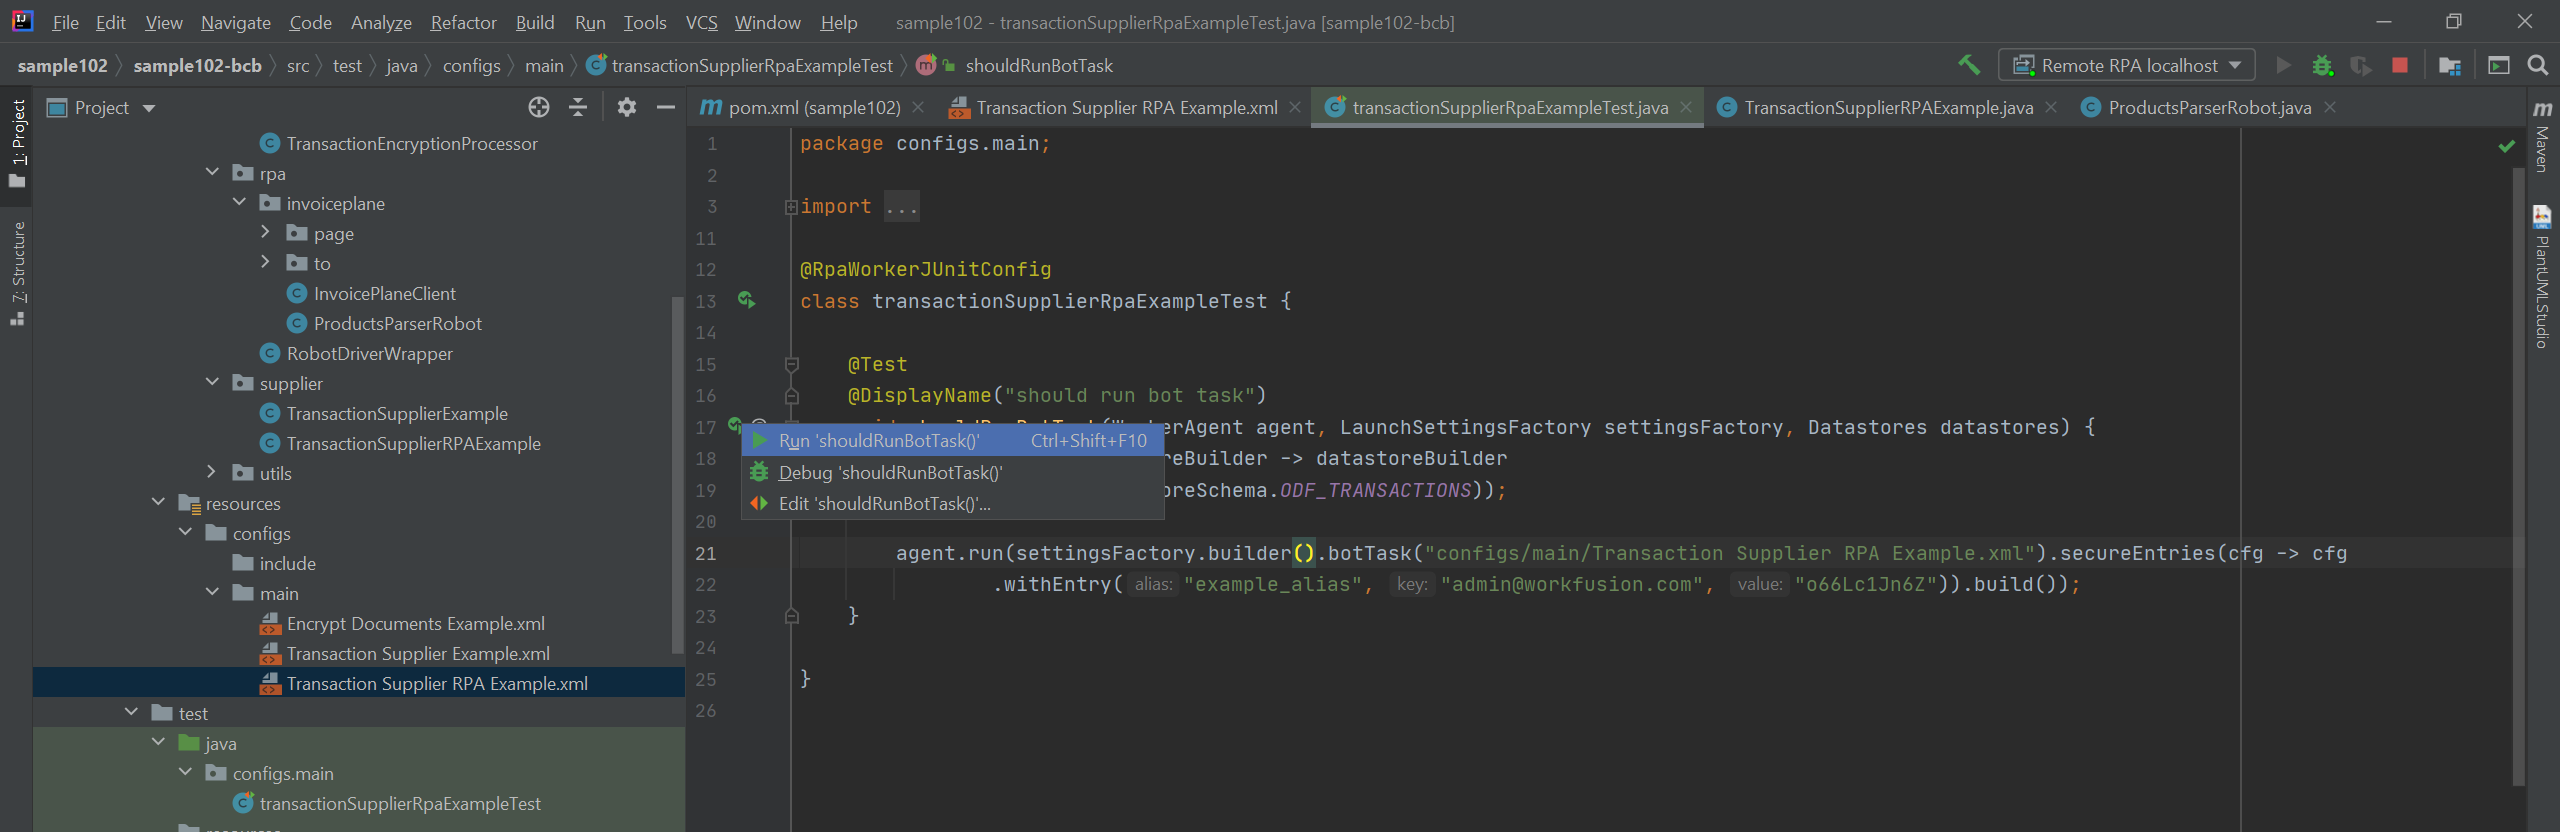
The remote debugger will catch and stop on the breakpoint.