Monitor Business Process schedules with Tableau analytics
The article addresses uses cases for legacy Tableau-based Analytics.
When you have many Business Processes (BP) and schedules, you might struggle to see clearly what and when is running and how to manage those optimally. To get a comprehensive overview of scheduled Business Processes, build a custom dashboard in Tableau based on the data stored in the Control Tower's MS SQL database.
A custom dashboard built as described in this article can help you do the following:
- Get a clear picture of planned and active runs.
- Fix overlapping schedules.
- Find the best-suited maintenance time.
- Identify BP schedule gaps.
- See available time slots to move schedules conveniently.
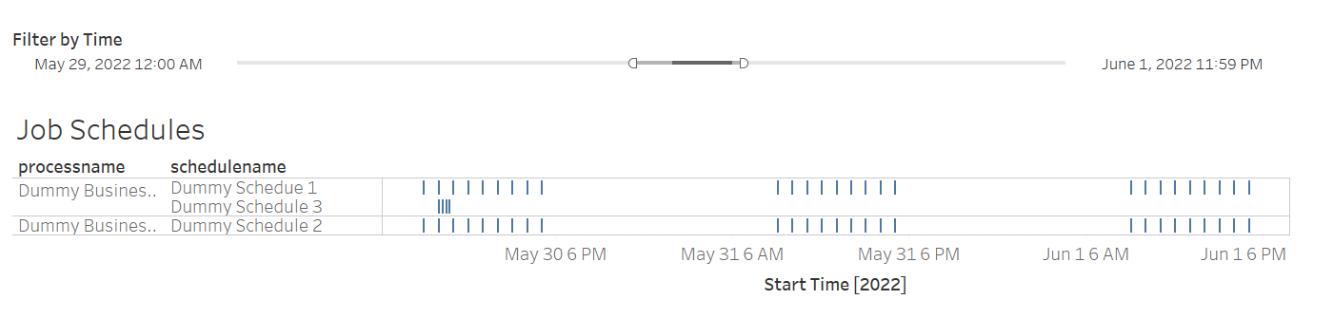
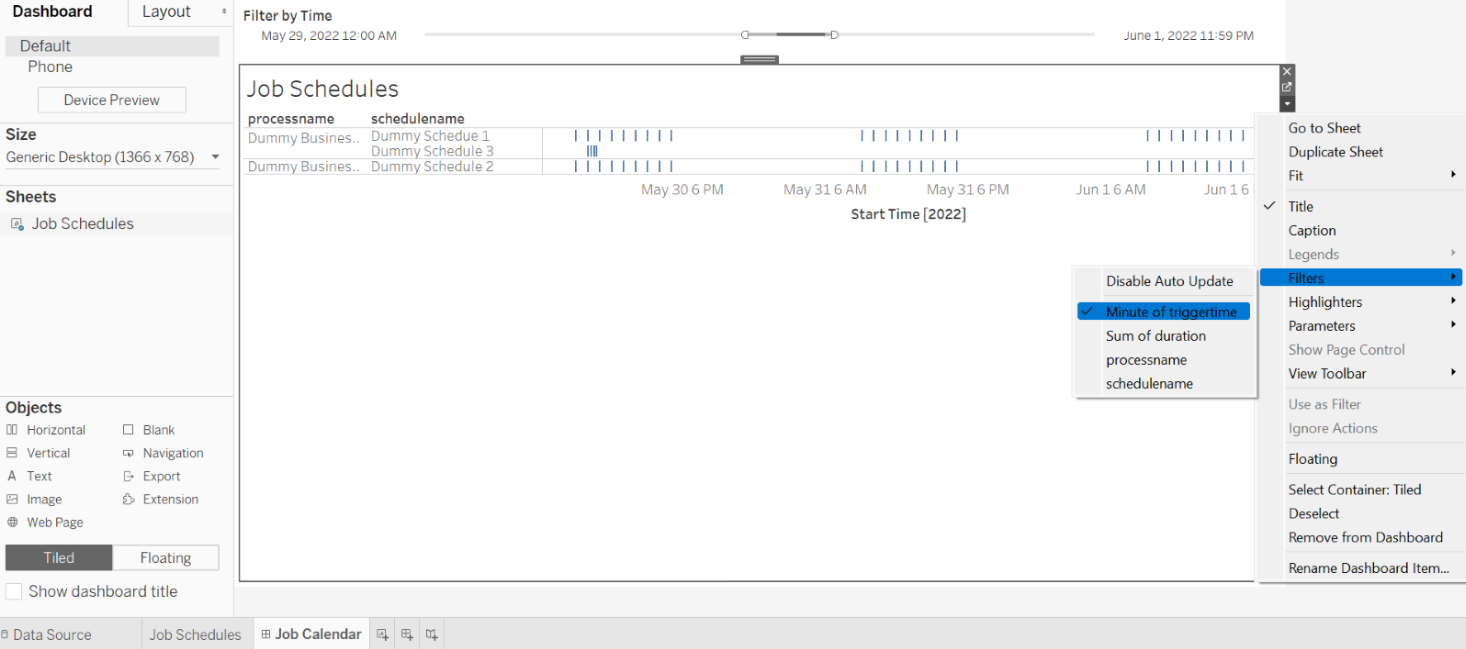
In the custom dashboard above, you can see where BP executions can overlap, given the existing schedules. Each row represents a single schedule of a Business Process. Every tick stands for a period in time when execution is underway. The width of a bar corresponds to the average BP execution duration in the past. Using the slide at the top, you can filter the dashboard by date and time.
Build custom dashboard
To build a custom dashboard for monitoring BP schedules, follow the steps below:
Create a stored procedure to convert Cron schedules into a series of datetime data points.
Create a dataset to capture the data stored in the Control Tower's MS SQL database and convert it into a series of execution events.
Deploy the dashboard visualizing the execution calendar.
Create function in MS SQL
The steps below are based on the SQL Server Crontab instructions.
To create a stored procedure for converting a Cron schedule into a series of timestamps, act as follows:
Click the link to download the
CLRfolder and copy the DLL files zipped in there to a location where the SQL Server can access them, for example,C:\workfusion\Microsoft_SQL_SERVER\MSSQL15.WORKFUSION\MSSQL\Binn.Execute the following code to enable the CLR usage in SQL:
EXEC sp_configure 'show advanced option', 1;
RECONFIGURE;
    EXEC sp_configure 'clr strict security', 0;
RECONFIGURE;
EXEC sp_configure 'clr enabled', 1;
RECONFIGURE;
In SQL, create an assembly:
CREATE ASSEMBLY [NCrontab.Samples]
FROM 'C:\workfusion\Microsoft_SQL_SERVER\MSSQL15.WORKFUSION\MSSQL\Binn\NCrontab.Samples.dll' -- supply the path before the file name here
GO
Create an SQL function:
CREATE FUNCTION [dm].[fn_CrontabSchedule](
            @Expression NVARCHAR(100),
            @Start DATETIME,
            @End DATETIME)
RETURNS TABLE (
            [Occurrence] DATETIME)
AS
EXTERNAL NAME [NCrontab.Samples].[NCrontab.Samples.SqlCrontab].[GetOccurrences]
GO
Verify if it is working:
SELECT * FROM [dm].[fn_CrontabSchedule]('0 12 29 feb *', '1900-1-1', '2000-1-1')
Capture data about schedule executions
To capture the data about future schedule executions from the MS SQL database, act as follows:
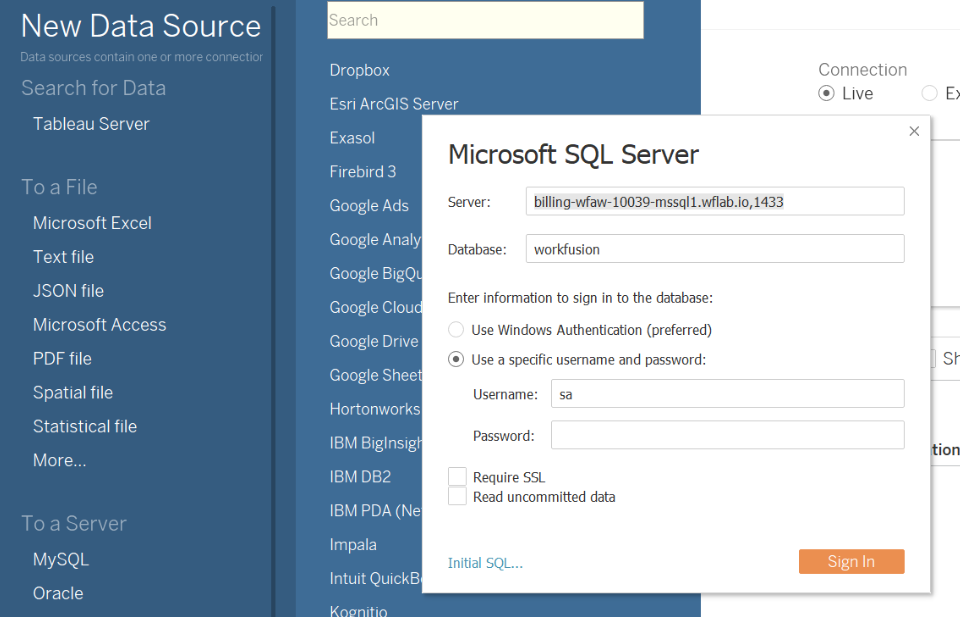
Connect to the WorkFusion MS SQL database:
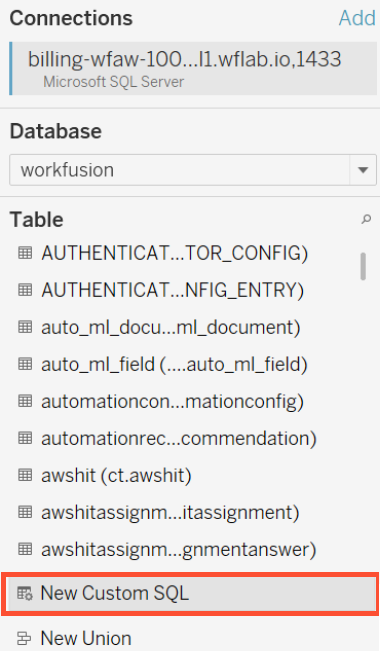
Create a custom SQL:
Copy-paste the following query:
select schedules.id, schedules.processname, schedules.schedulename, schedules.firstschedulepoint, schedules.lastschedulepoint, schedules.cronexpression,
DATEADD(day, -1, occurrence) triggertime, duration from (
SELECT
schedule.id,
campaign.title processname,
scheduleduploadrequirement.name schedulename,
schedule.firstschedulepoint,
schedule.frequency,
schedule.lastschedulepoint,
cast(campainduration.durationseconds as float)/(60*60*24) duration,
SUBSTRING(
replace(schedule.cronexpression, '?', '*'),
PATINDEX ('% %' , schedule.cronexpression),
len(replace( schedule.cronexpression, '?', '*')) - PATINDEX ('% %' , schedule.cronexpression) + 1
) cronexpression
FROM ct.schedule
left join ct.machinecampaignschedule on machinecampaignschedule.scheduleid = schedule.id
left join ct.scheduleduploadrequirement on scheduleduploadrequirement.machinecampaignschedule = machinecampaignschedule.id
left join ct.campaign on campaign.id = machinecampaignschedule.campaignid
left join (
select campaign_id, avg(datediff(SECOND, startdate, enddate)) durationseconds
from workfusion.ct.run
group by campaign_id
) campainduration on machinecampaignschedule.campaignid = campainduration.campaign_id
where schedule.deleted = 0
)schedules
cross apply dm.fn_CrontabSchedule(schedules.cronexpression, schedules.firstschedulepoint, schedules.lastschedulepoint)
The query does the following:
- Pulls the schedules from the database and matches them to BPs.
- Converts the Cron codes of the schedules into a series of timestamps.
- Generates a set of future timestamps for the Business Process and schedule executions along with the expected execution duration based on historical data.
If you are using Tableau, you can create a new Data Source with a custom query based on the above.
Create Tableau dashboard to visualize schedules
The step is optional.
You can build a dashboard using the Data Source based on the custom SQL query you created in the previous step. To do that, follow the steps below:
Create a new sheet plugged into the created Data Source.
On the sheet, do the following:
Drag triggertime to Columns.
Drag processname and schedulename to dimensions.
Use duration as a measure.
For visualization, use Gantt.
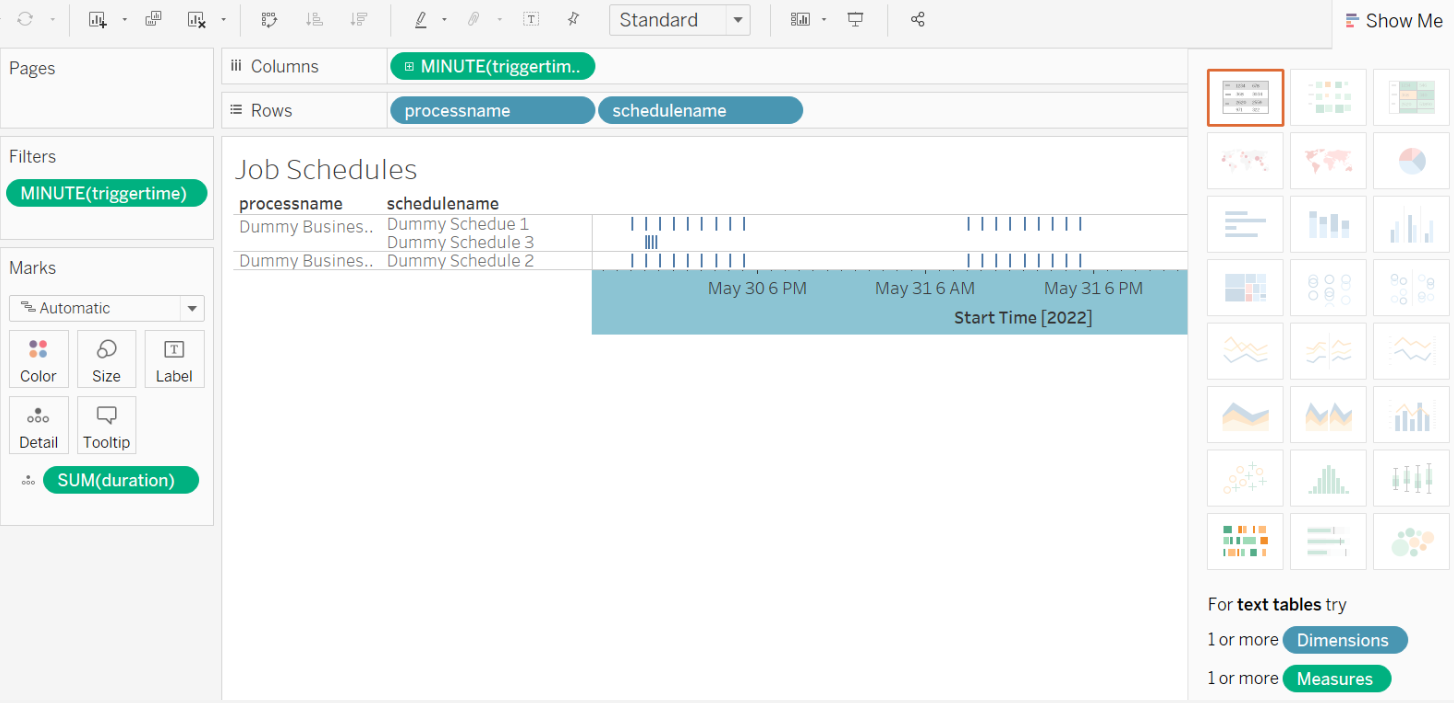
Build a dashboard using the sheet you created in Step 2 and drag the triggerdate filter to the palette above the new sheet:
Deploy dashboard to Control Tower
The step is optional. If you want to deploy the custom dashboard to Control Tower, follow the Deploy custom dashboards instruction.