AutoML (legacy)
The legacy AutoML dashboard provides insights into the following data:
- AutoML task performance
- Failed documents during AutoML processing
- Forecast for AutoML in production
- Processing statistics for AutoML fields
On the dashboard, you can find the key metrics listed below:
- Documents processed by AutoML models
- Total Manual Efforts spent on document processing
- Manual Efforts saved per process
- Straight-Through Processing (STP): proportion of documents handled by bots without manual processing
STP (Straight-Through Processing)
The chart provides data on Straight-Through Processing—the rate of documents processed entirely by bots without manual effort.
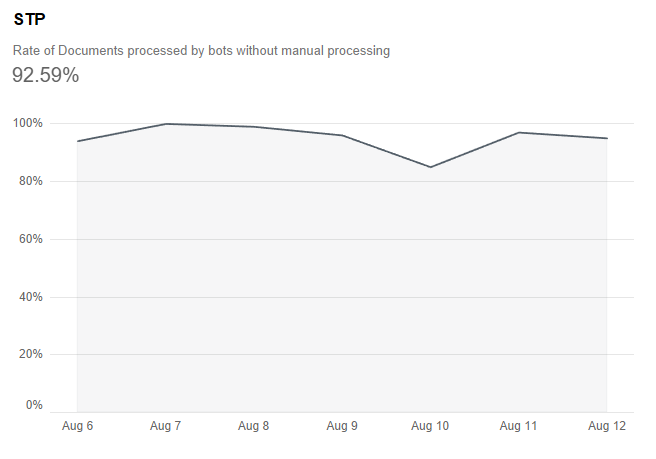
The STP rate is calculated in the following way:
STP Rate = (1 - DPM/DO) * 100
where:
- DPM—Documents processed manually, both fully manual and bot-assisted processing
- DO—Documents overall
Volume
The Volume chart shows how many documents were processed daily.
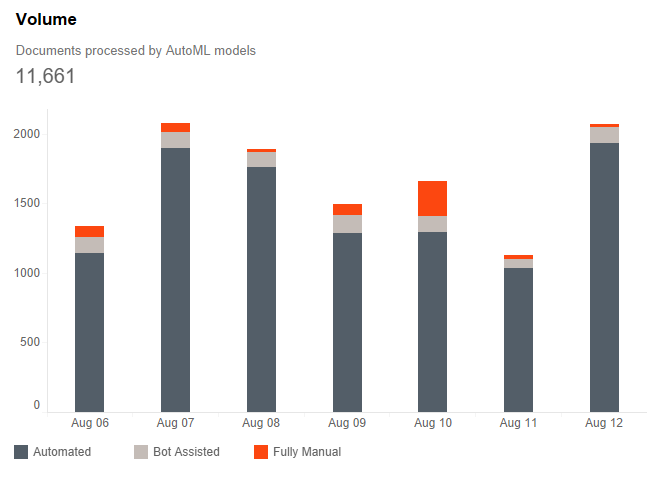
The processed volume is split by the execution type:
- Bot Assisted: fields were partly extracted by a model.
- Automated: a document was fully processed by a model.
- Fully manual: a document was handled manually without a model.
Manual Work Reduction
The Manual Work Reduction chart shows how much time was saved relative to the baseline.
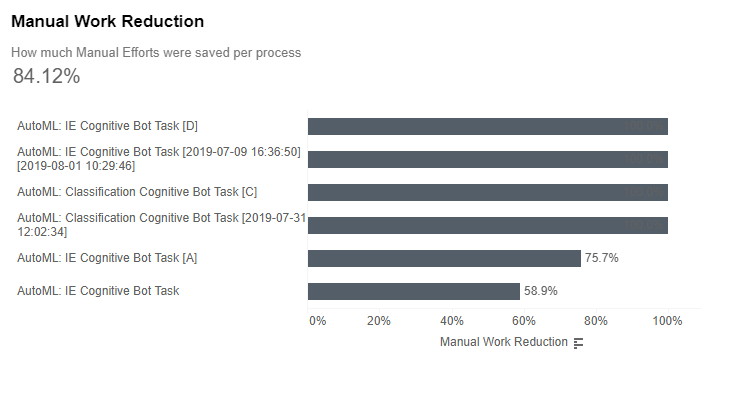
The values are calculated based on the associated metrics:
Manual Efforts (Hours): real time spent on performing a task. The time spent manually extracting the fields the model failed to extract.
Baseline Hours: total time required to complete a task if all fields were to be extracted manually. The manual efforts for baseline hours are calculated based on the historical data in the system and the number of processed documents. It's the time spent on fully manual or bot-assisted processing of documents. In case there are only fully automated documents, manual work reduction is 100%.
Saved Hours: the difference between Baseline Hours and Manual Efforts.
Manual Efforts
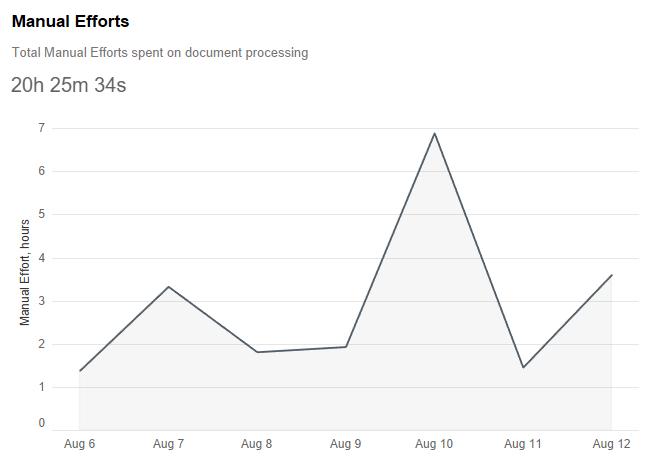
This chart shows the total amount of manual efforts spent on document processing, both fully manual and bot-assisted.
Manual Effort (in hours) equals the real time spent to perform a task: the time spent manually extracting the fields the model failed to extract.
Manual work reduction is a relative representation of the saved time in hours.
AutoML Production Performance Forecast
The animation below illustrates the working principle of the Production Performance Forecast feature.
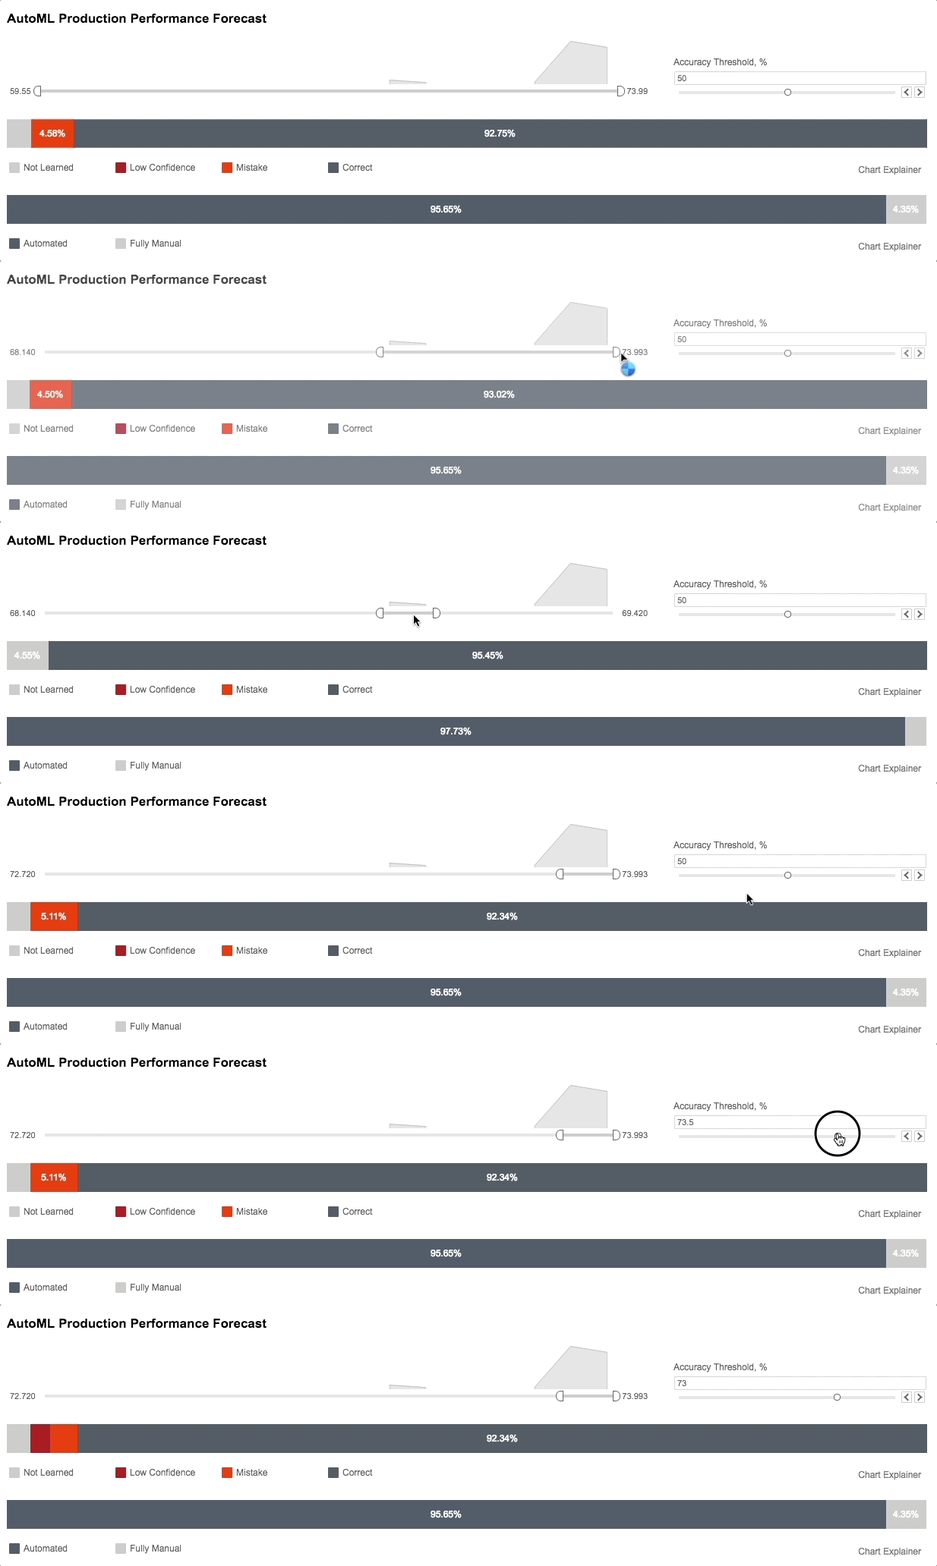
The AutoML Production Performance Forecast features information about model performance and quality results. It consists of the following areas:
- Quality description metrics
- Overall automation rate
You can filter the quality description metrics using the Score filter and the Accuracy Threshold parameter. The area above the Score filter shows the number of fields extracted with the corresponding score.
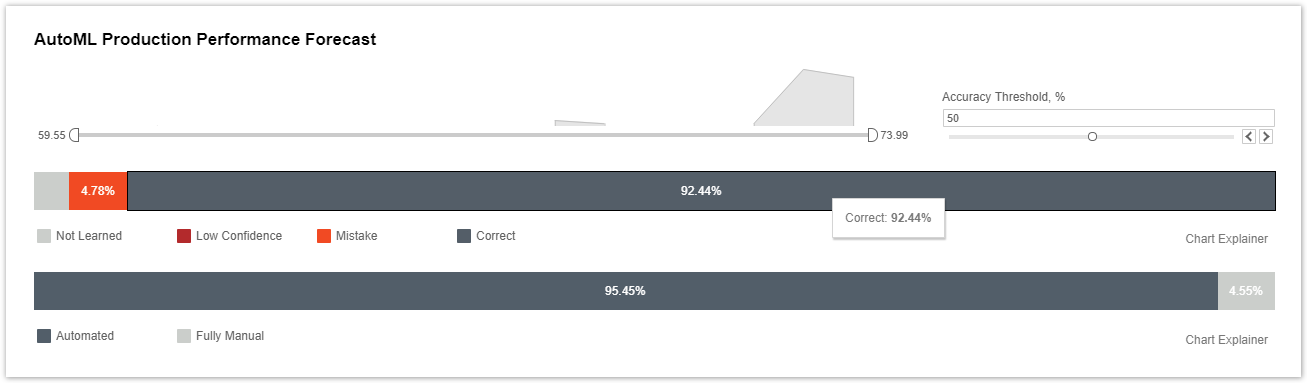
Quality description metrics are as follows:
- Not Learned—a ratio of fields that were supposed to be extracted but were not extracted by a model.
- Low Confidence—a ratio of fields that were not supposed to be extracted but were or weren't extracted with a model score lower than the selected Accuracy Threshold.
- Mistake—a ratio of fields that were not supposed to be extracted but were or weren't extracted with a model score equal or greater than the selected Accuracy Threshold.
- Correct—a ratio of correctly extracted fields.
The Automation Rate chart includes the following metrics:
- Automated—a ratio of documents processed successfully by a model, with or without human assistance.
- Fully Manual—a ratio of documents processed by humans.
The Chart Explainer contains a metrics description.
AutoML Statistics by Field
The AutoML Statistics by Field chart shows the model quality results per each field across all documents.
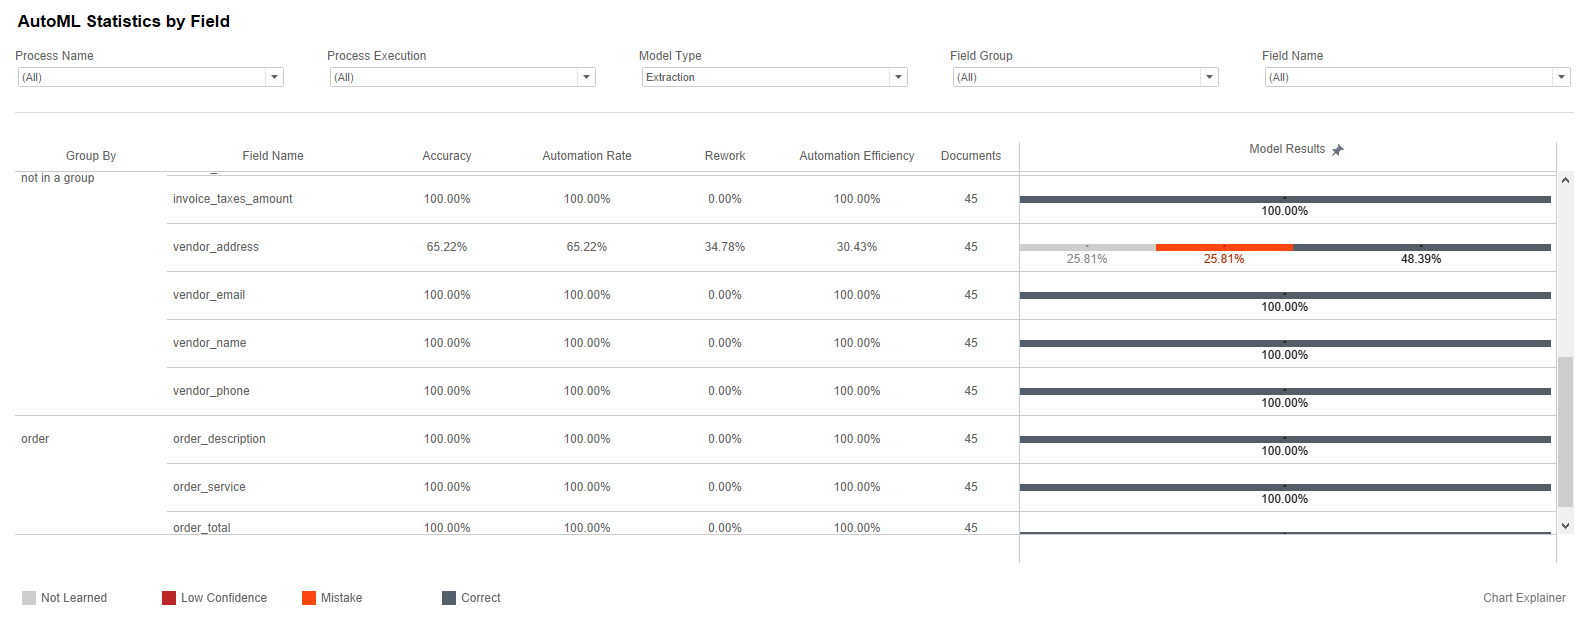
Using the Model Type filter, set a model type— Classification or Extraction.

For the Extraction (Information Extraction) model type, the Group by column displays the name of the group if a field contains a group of answers. For Classification, the Group by column displays gold values.
The Documents column shows the number of documents containing a displayed field.
Model Metrics
Automation Accuracy
Information Extraction
For Information Extraction, Automation Accuracy equals Precision in data science terms. The value reflects how precise an extraction is. Hence, it is calculated as the ratio of correctly extracted (True Positive) objects to all extracted objects, meaning TP (True Positive) + FP (False Positive).

Classification
For Classification problems, Automation Accuracy equals Accuracy in data science terms. The value reflects how accurate classification is. Hence, it is calculated as the ratio of correctly classified objects to all classified objects.

Automation Rate
In data science terms, it is recall. The Automation Rate reflects how many correct results a machine found from ALL correct results (gold data). The value is calculated as the ratio of correctly classified or extracted objects (Correct or True Positive) to all objects of the type existing in the data set (gold or TP + FN).

Rework
If the Automation Accuracy is 100%, the Automation Rate reflects Automation Efficiency. However, a machine does make errors that need to be corrected by a person. Rework reflects the amount of effort required from a person to correct machine's errors. This metric is calculated as the ratio of the values extracted incorrectly (Precision mistakes or FP) to all correct values in a data set (gold data).

Rework can be more than 100% in case of too many FPs.
Automation Efficiency
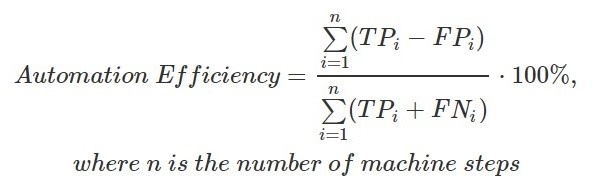
Automation Efficiency indicates the total amount of work automated by a machine. It is calculated as the amount of useful work done by the machine—meaning the Automation Rate minus the number of errors made by the machine (Rework):

Automation Efficiency can be negative in case the Rework value is more than the Automation Rate.
In a general case, a Business Process contains multiple steps, and each step requires multiple object types to be extracted or classified. Efficiency for the entire automation step or the entire BP can be calculated as the ratio of completed effective work (the sum of useful work minus rework at each sub-step, field, or document type) to all work that should have been automated (the sum of gold values at each sub-step, field, or document type).
Model Results
- Not Learned—a ratio of fields supposed to be extracted but were not extracted by a model.
- Low Confidence—a ratio of fields that were not supposed to be extracted but were or weren't extracted with a model score lower than the selected Accuracy Threshold.
- Mistake—a ratio of fields that were not supposed to be extracted but weren't extracted with a model score equal or greater than the selected Accuracy Threshold.
- Correct—a ratio of correctly extracted fields.
The Chart Explainer provides a metrics description.
Quality metrics are only available if gold data is used.
Gold vs Extracted Statistics
The Gold vs Extracted Statistics table shows detailed extraction or classification information per field and has an additional filter panel.
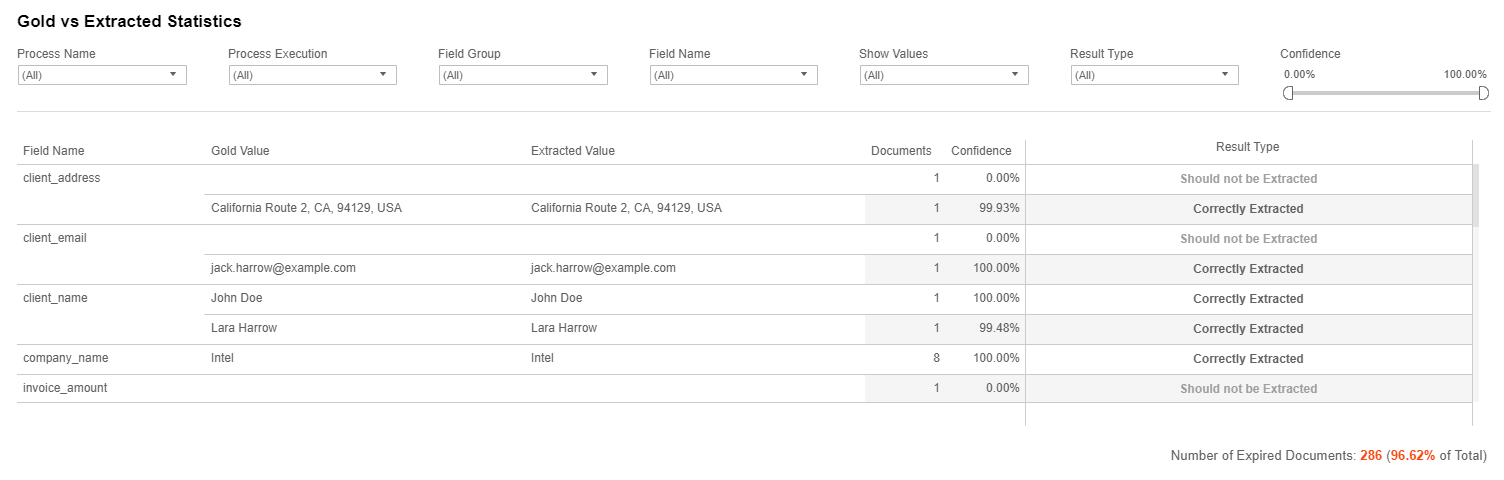
Using the table, you can compare gold and extracted data for each field and see the aggregated number of documents where the exact pair of gold and extracted value appears.
Here, Confidence is a variable representing estimated accuracy for a given threshold returned by a model.
Result Type helps to filter fields and their values to understand what kind of post-processing is required in a particular case. The result type decision is based on the following conditions:
- If sum(FP+FN)>0 or sum(FP)>0, the result type is Extracted with Errors.
- If sum(FN)>0, it is Failed to Extract.
- if sum(TP)>0, it is Correctly Extracted.
- Otherwise, the result type is Should not be Extracted.
The Expired Documents element displays the number of expired tasks and their percentage from the total number of tasks. Expired tasks are not included in the chart calculations above.
For a detailed description of the other chart filters, refer to the Filters and tooltips article.