Capacity (legacy)
The legacy Capacity dashboard provides a quick and comprehensive overview of how Work.AI components are used. In particular, it allows monitoring the utilization of the infrastructure resources, such as CPU, memory, disk space, over time. This information helps to determine whether there are enough resources to scale dynamically to process peak workloads in Work.AI. The Bot Execution Platform Agent charts visualize how BEP Workers with different profiles (Control Tower and AutoML) share CPU and memory resources.
CPU Utilization
CPU Utilization is tracked every minute for each component installed. See the sample dashboard below:
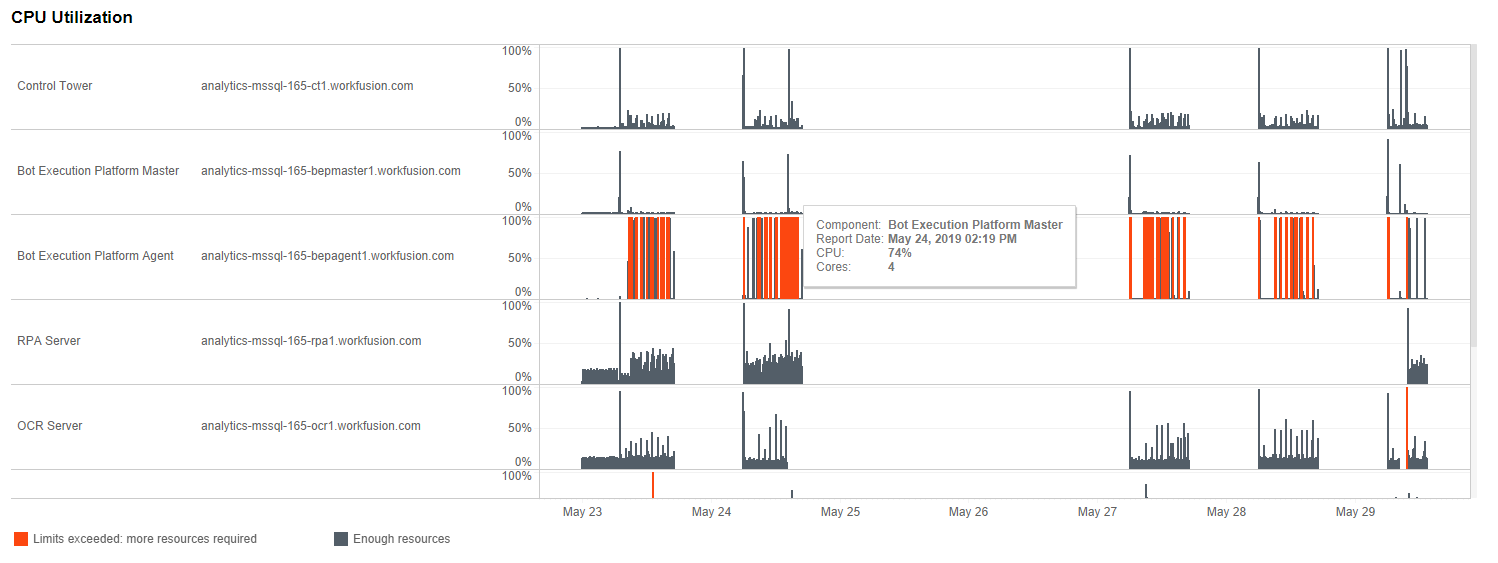
The red color indicates that CPU utilization reached 100%. Gray means that it is below 100%.
Memory Utilization
Memory Utilization is tracked every minute for each component installed. See the sample dashboard below:
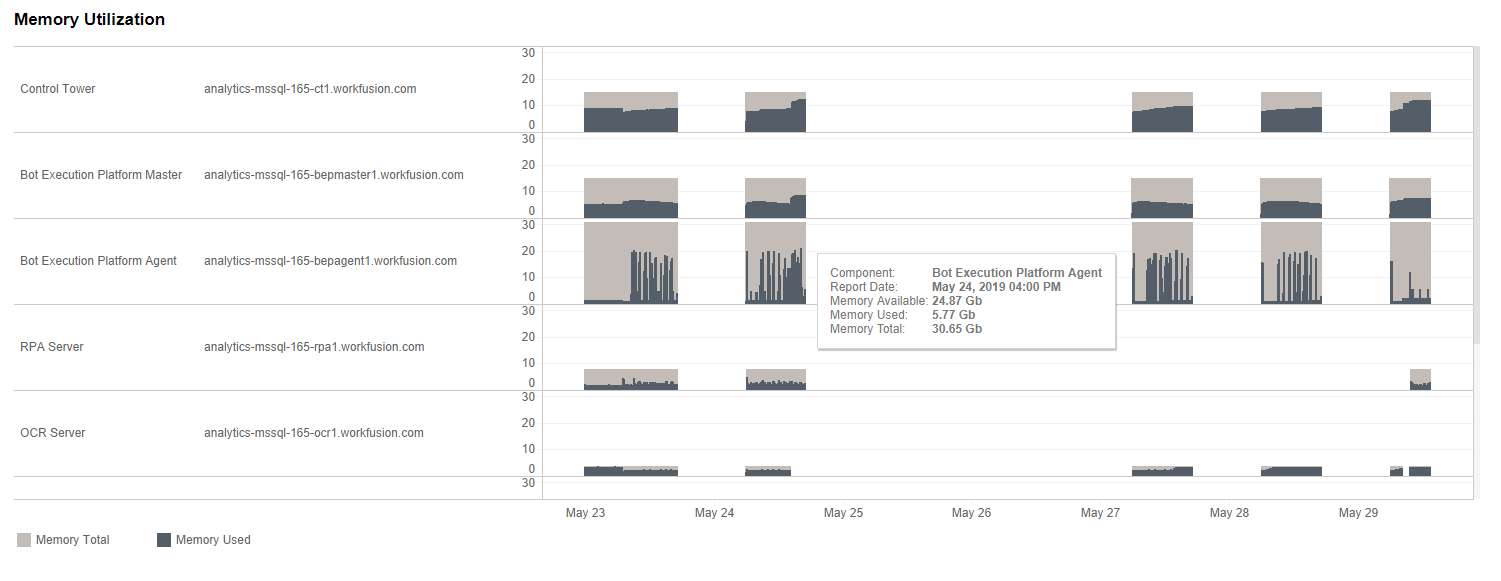
Color indication:
- Gray—the amount of used memory
- Light gray—the total amount of available memory
Disk Utilization
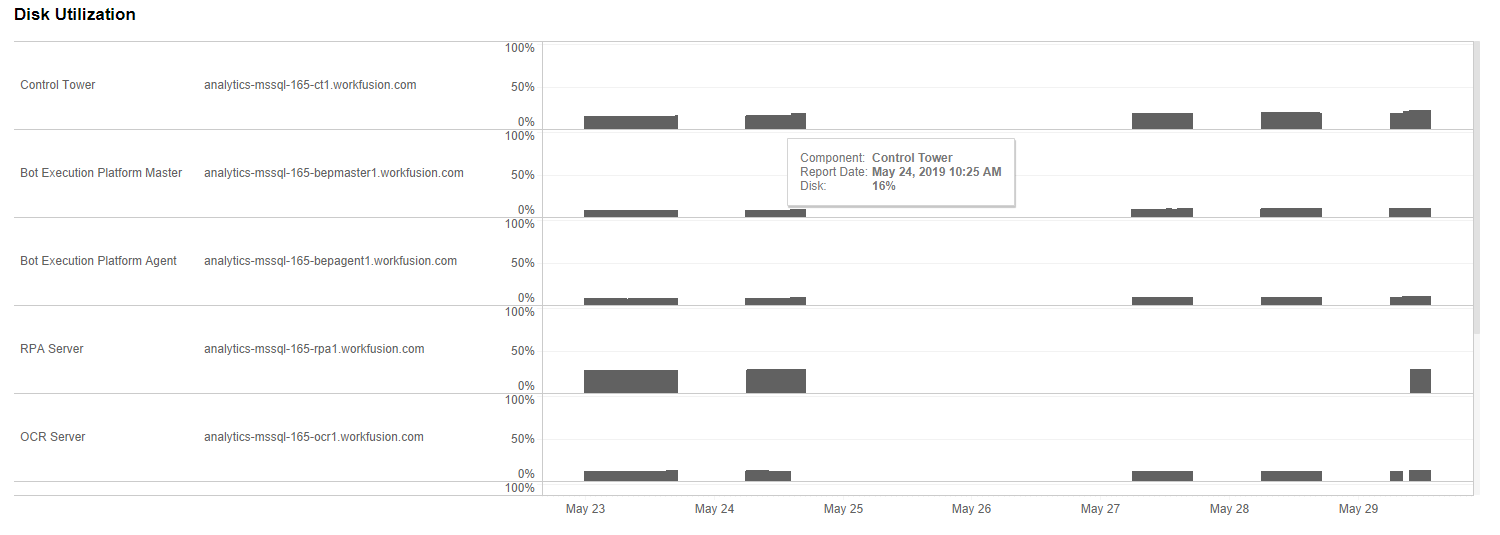
Disk Utilization stands for the percentage of time the disk processes read or write requests. It is tracked every minute for each component installed. See the sample dashboard below:
Bot Execution Platform Agent
Worker profiles are highlighted in color.
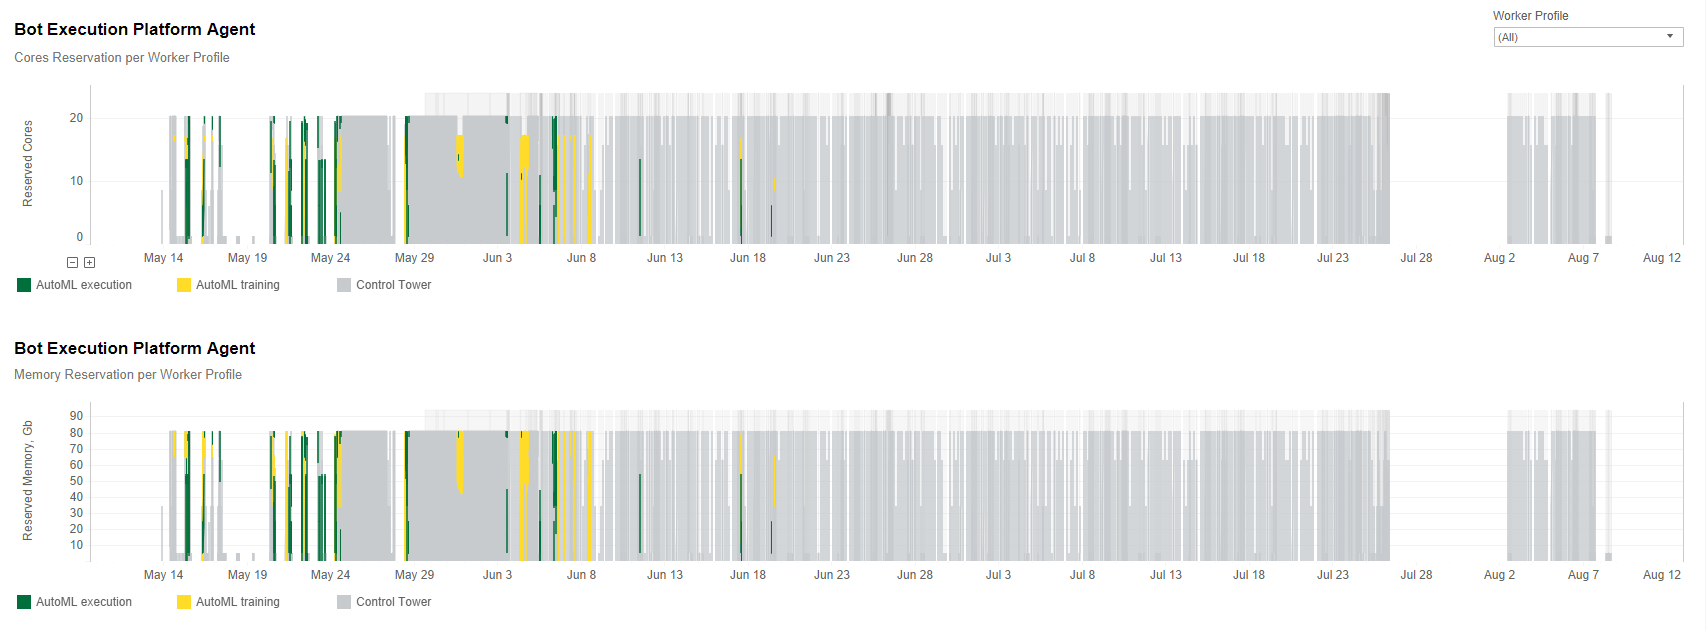
Tooltips show the following metrics:
- Number of cores
- Number of reserved cores
- Memory reserved out of total
- Worker profile
- Report date