Analyze effectiveness
Tara uses pre-built analytics dashboards to monitor the automation solution and specific metrics for actionable insights into a Business Process (BP).
View dashboards
To view Tara dashboards, go to Control Tower > Analytics > Dashboards > Payment Screening Alert Review.
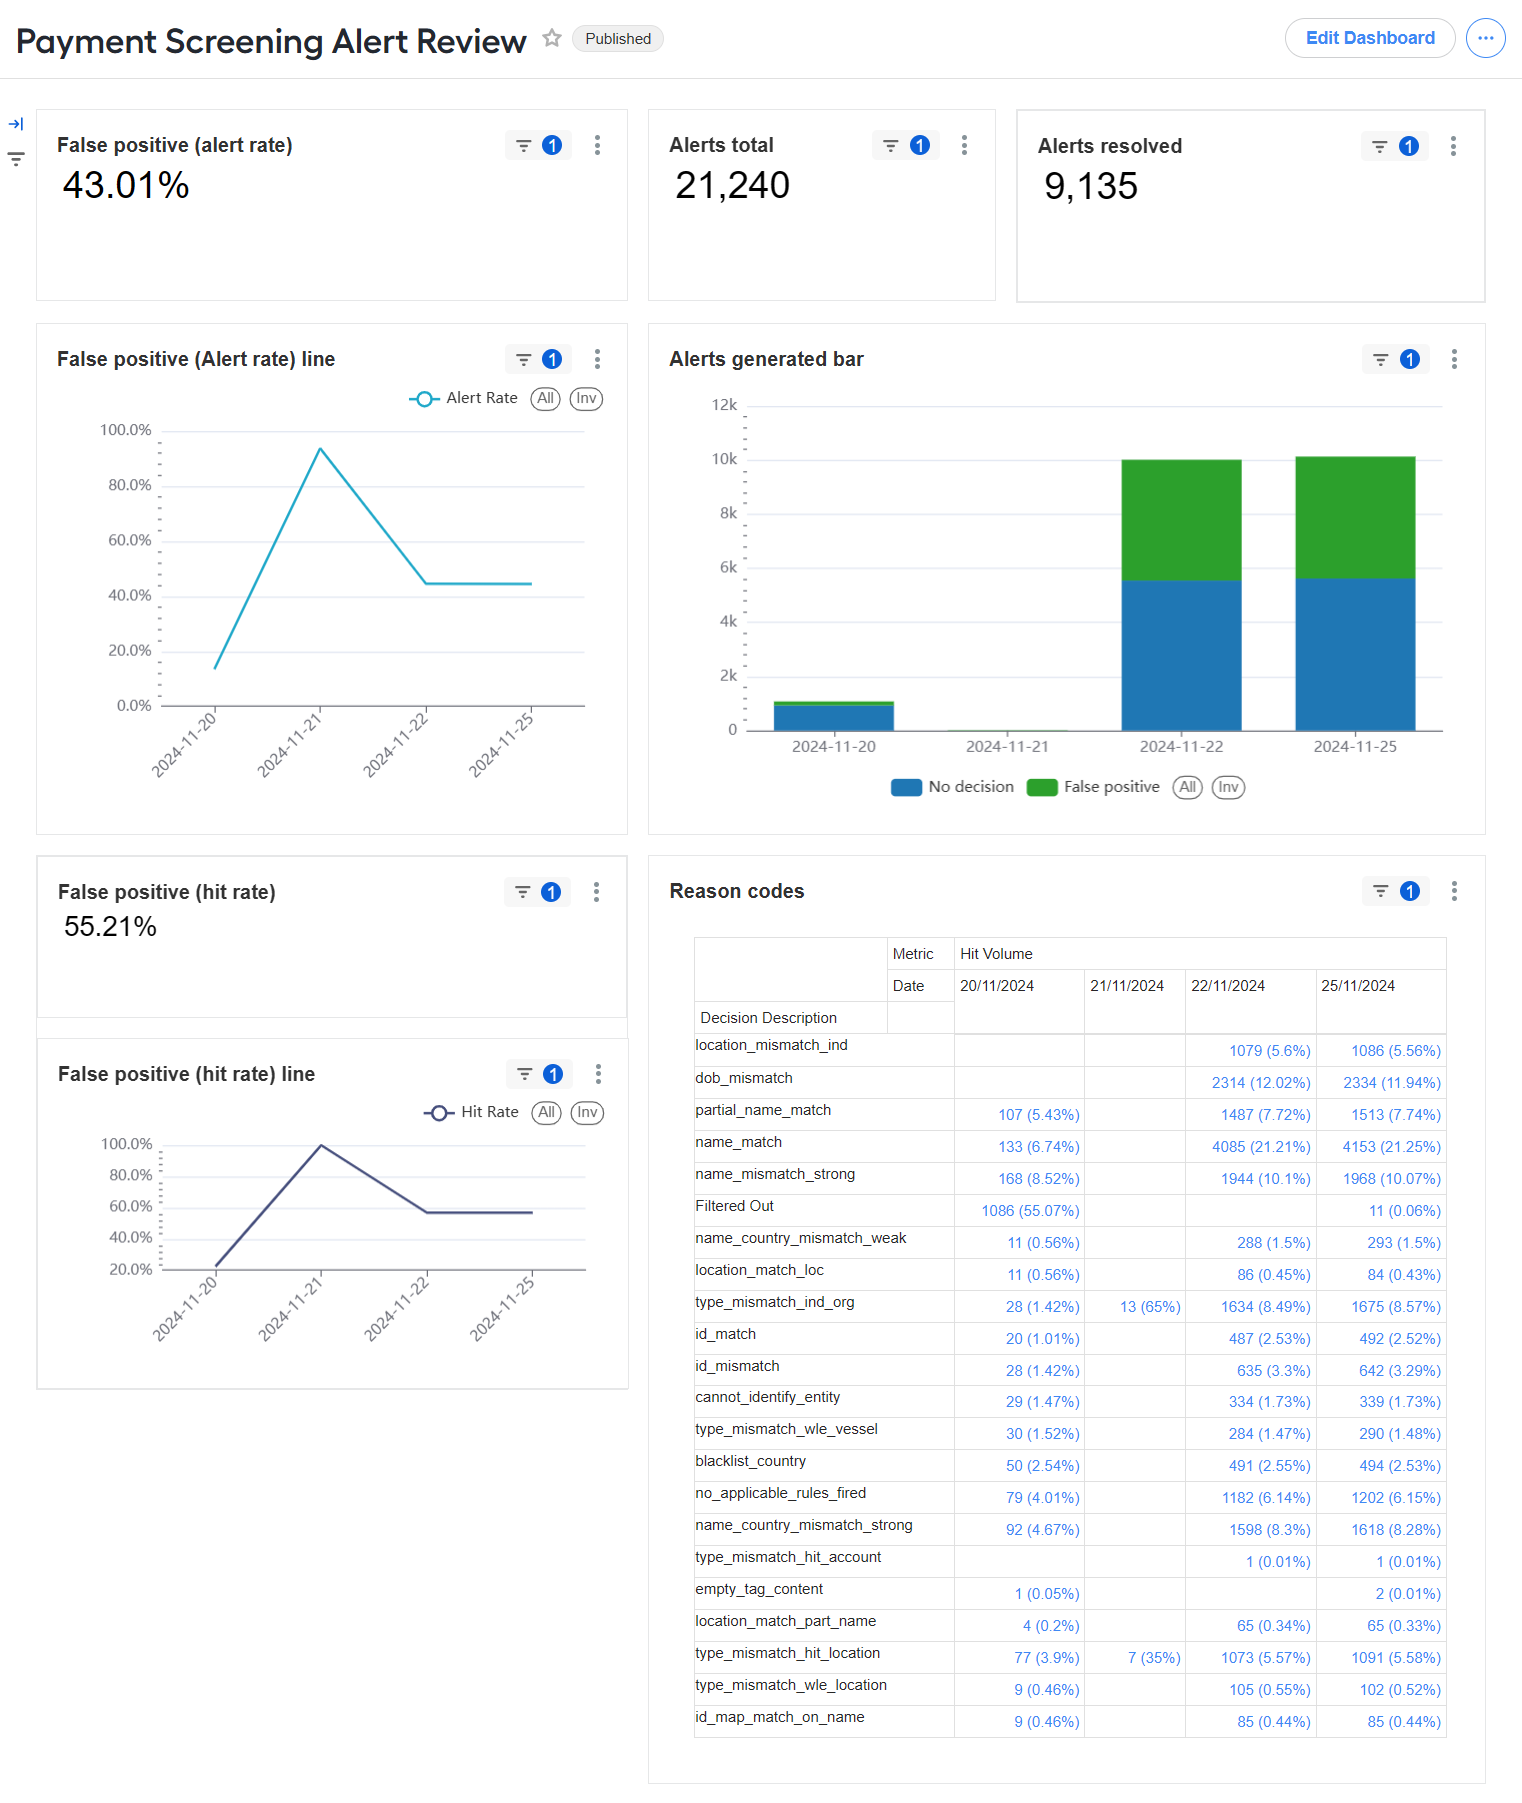
The Payment Screening Alert Review dashboard calculates metrics for finished transactions only. Thus, not all transactions are considered on the dashboard during the BP execution.
The pre-built out-of-the-box analytics includes the following business metrics:
| Chart | Description | Results |
|---|---|---|
| False positive (alert rate) | Percentage of messages identified as false alerts | Total volume of false positive alerts |
| False positive (hit rate) | Percentage of hit alerts identified as false alerts by the ML model and processed automatically | Total volume of false positive hits |
| Alerts total | Volume of alerts by the ML model decision | Total volume of alerts |
| Alerts resolved | Volume of resolved alerts by the ML model decision | Total volume of resolved alerts |
| Alerts generated bar | Volume of alerts by the ML model decision displayed by date | Total volume of alerts |
| Reason codes | Percentage of resolved alerts based on specific mismatch reasons | Percentage of false positive hits by reason code |
You can view the False positive (alert rate) and False positive (hit rate) charts as line charts: False positive (alert rate) line and False positive (hit rate) line, respectively.
View Data Stores
Alert-level analytics Data Store
The pss_messages_analytics_v1 Data Store contains alert-level analytics data.

The available columns are as follows:
campaignId: unique identifier of the BP installationrunUuid: unique identifier of the BP executiontransactionId: unique identifier of a requestclientId: client executing BPmessageId: identifier of an incoming alertmessageType: type of an incoming alertalertsCount: number of hits in the alertmsgDecision: alert decision as a JSON stringmsgReviewDecision: alert gold decision as a JSON stringreportLink: generated link of a HTML reportlastModified: timestamp when a record was last modifiedmsgFilteredOut: flag if alert was filtered outmsgDecisionReapplied: flag if a decision on the alert was made by CLDSmodelId: decision model identifiernerModelId: NER model identifier
Hit-level analytics Data Store
The pss_alerts_analytics_v1 Data Store contains alert-level analytics data.

The available columns are as follows:
campaignUuid: unique identifier of the BP installationrunUuid: unique identifier of the BP executiontransactionId: unique identifier of a requestclientId: client executing BPmessageId: identifier of an incoming alertalertId: identifier of an incoming hitentityType: type of a screened entityalertDecision: final hit decisionalertDecisionCode: hit decision code or a name of the rule executed to make a decisionalertDecisionDescription: hit decision description; currently, the same as the codealertDecisionExplanation: hit decision explanation, a verbal detailed explanation of the codealertReviewDecision: gold hit decisionlastModified: timestamp when a record was last modifiedfilteredOut: flag if a hit was filtered outdecisionReapplied: flag if a decision on the hit was made by CLDSmodelId: decision model identifiernerModelId: NER model identifiercontentFormat: message content formattagName: name of the tag where the hit was
Enrichment data analytics Data Store
The pss_de_analytics_v1 Data Store contains enrichment data analytics.
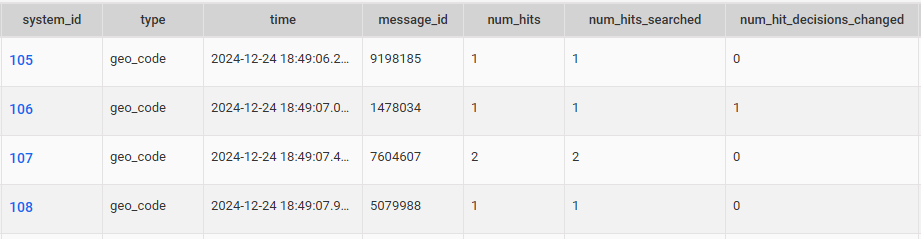
The available columns are as follows:
type: enrichment data providertime: call execution timemessage_id: identifier of an incoming alertnum_hits: total number of hits in an alertnum_hits_searched: number of hits that executed the callnum_hits_decision_changed: number of hits for which the decision was changed because of the call
Also, see View CLDS Data Stores.