Analyze effectiveness
Tara uses pre-built analytics dashboards to monitor the automation solution and specific metrics for actionable insights into a Business Process (BP).
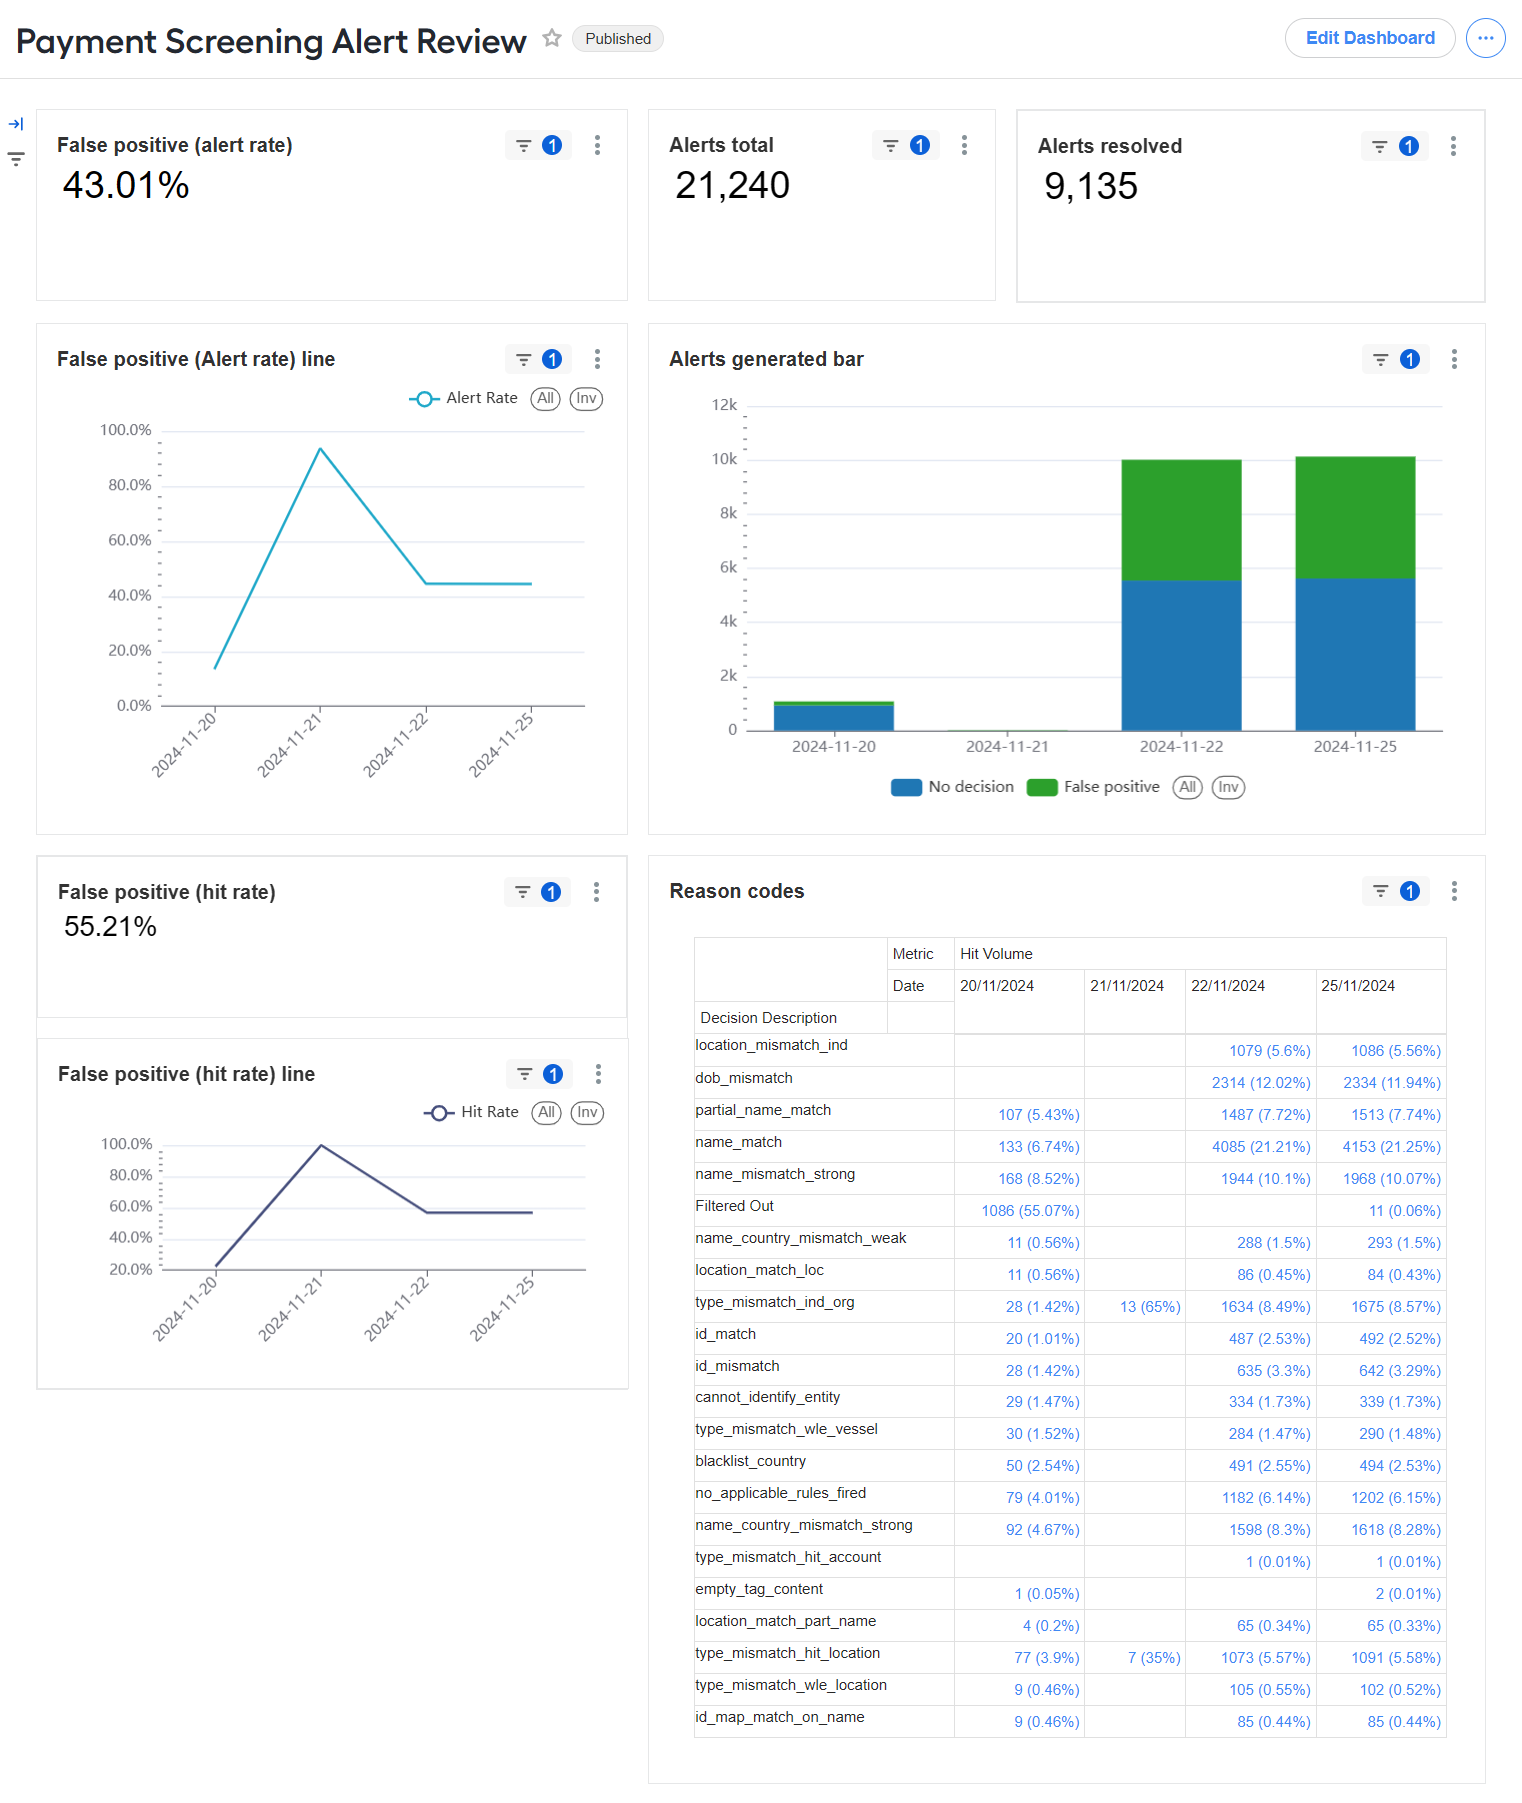
To view Tara dashboards, go to Control Tower > Analytics > Dashboards > Payment Screening Alert Review.
note
The Payment Screening Alert Review dashboard calculates metrics for finished transactions only. Thus, not all transactions are considered on the dashboard during the BP execution.
The pre-built out-of-the-box analytics includes the following business metrics:
| Chart | Description | Results |
|---|---|---|
| False positive (alert rate) | Percentage of messages identified as false alerts | Total volume of false positive alerts |
| False positive (hit rate) | Percentage of hit alerts identified as false alerts by the ML model and processed automatically | Total volume of false positive hits |
| Alerts total | Volume of alerts by the ML model decision | Total volume of alerts |
| Alerts resolved | Volume of resolved alerts by the ML model decision | Total volume of resolved alerts |
| Alerts generated bar | Volume of alerts by the ML model decision displayed by date | Total volume of alerts |
| Reason codes | Percentage of resolved alerts based on specific mismatch reasons | Percentage of false positive hits by reason code |
You can view the False positive (alert rate) and False positive (hit rate) charts as line charts: False positive (alert rate) line and False positive (hit rate) line, respectively.