Set up custom dashboard
The guide describes how to use WorkFusion Analytics Desktop and WorkFusion Analytics Server in integration with WorkFusion applications. Explore the end-to-end setup example for one database table.
Prepare
Install WorkFusion Analytics Desktop on your local machine, following the instruction.
Obtain access to the database in the environment for deploying dashboards. In the example below, you need the credentials to the workfusion SQL Server database.
Alternatively you can work with a local file—text, Excel, and so on.
Obtain access to the WorkFusion Analytics Server integrated with the environment for deploying dashboards.
Launch WorkFusion Analytics Desktop.
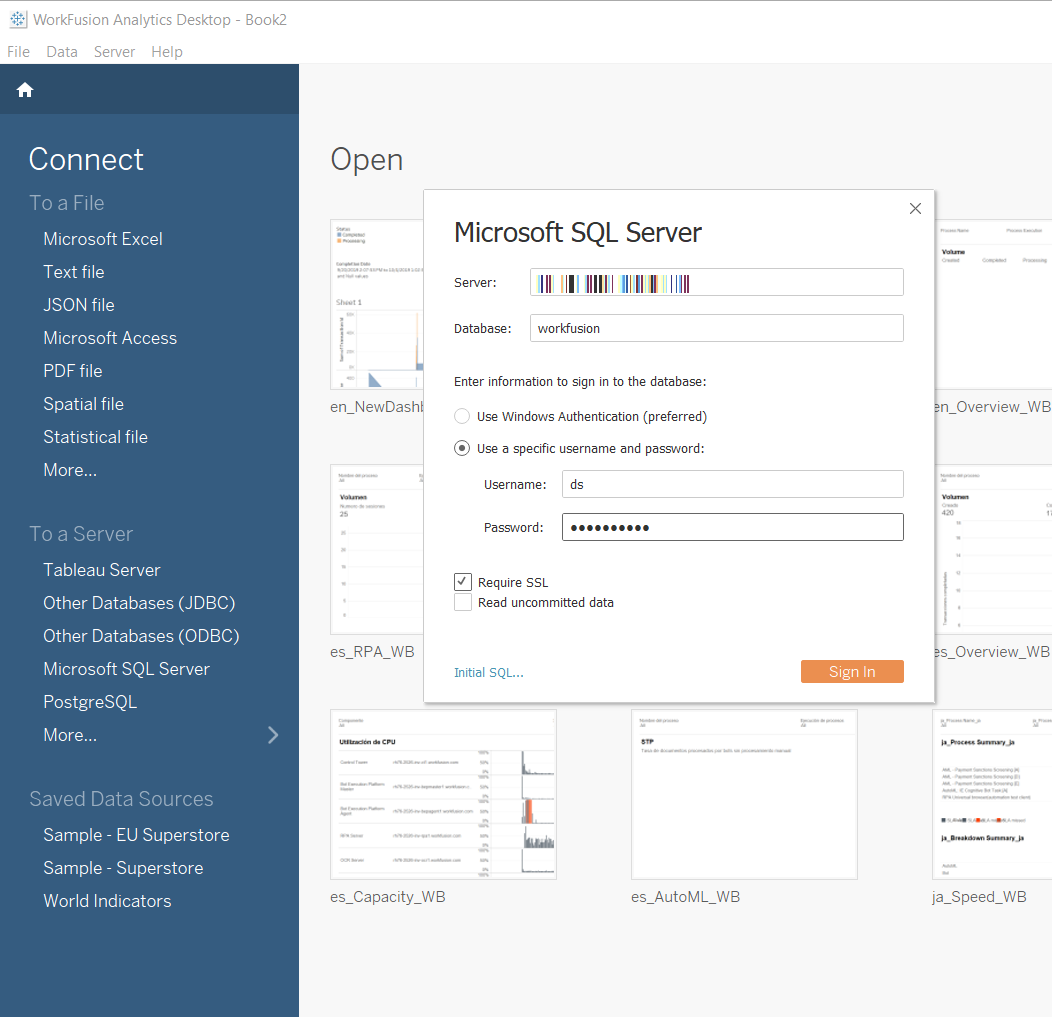
In the top left corner, click Connect > Microsoft SQL Server, and specify the database (DB) credentials. Use the rapi username.
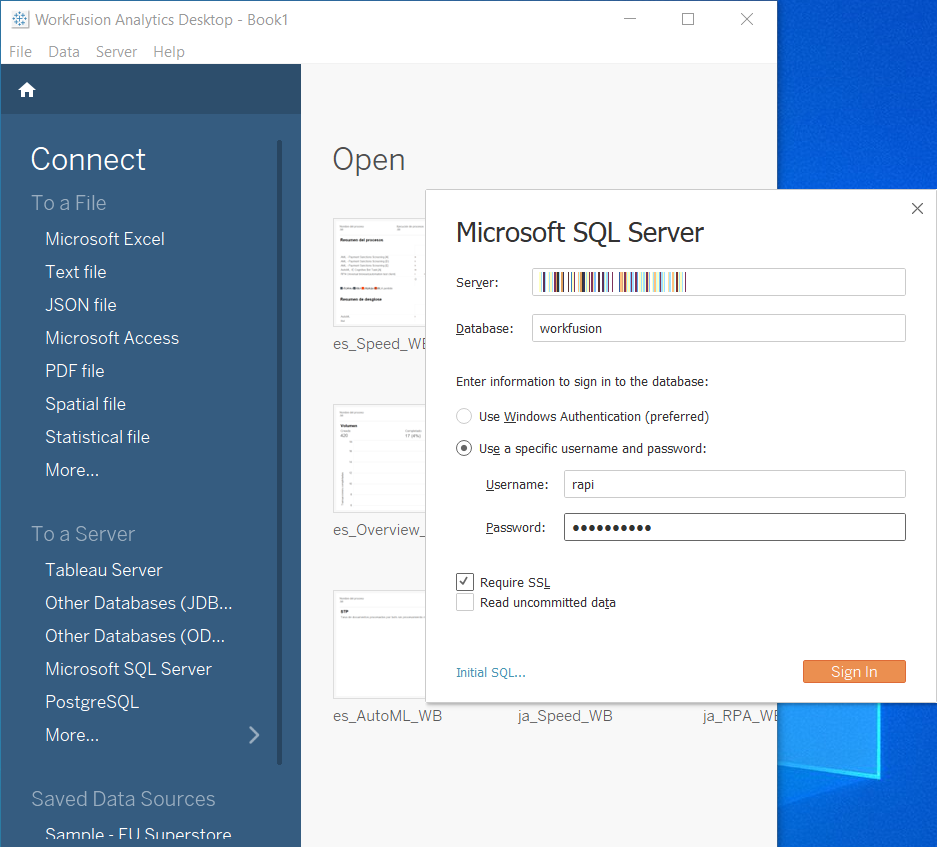
If there are new Data Stores inside your Business Process, enter under the ds user.
note
If you cannot connect to your DB, try installing appropriate DB drivers.
For the rapi user, the following objects are accessible upon sign-in:
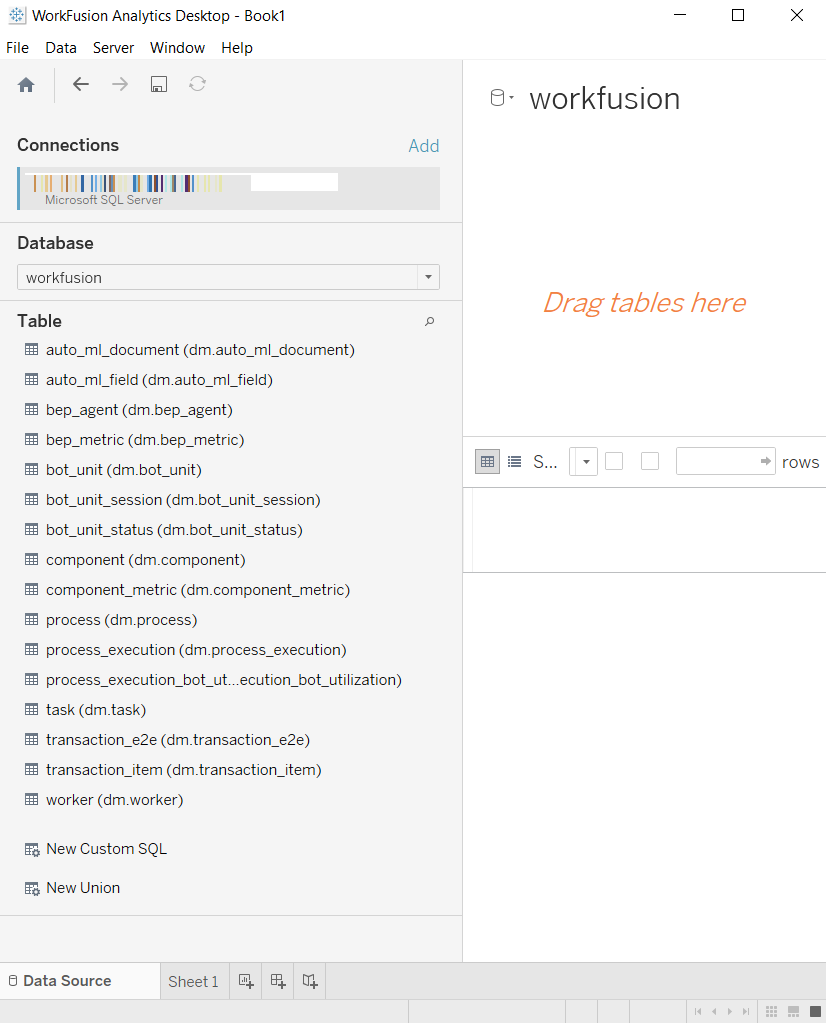
If you need to extend access, contact your DB administrator.
Select data source
The data source is the source DB table (one or more) from where you will build your dashboard. In the example below, it is transaction_e2e.
To select a data source, perform the following steps:
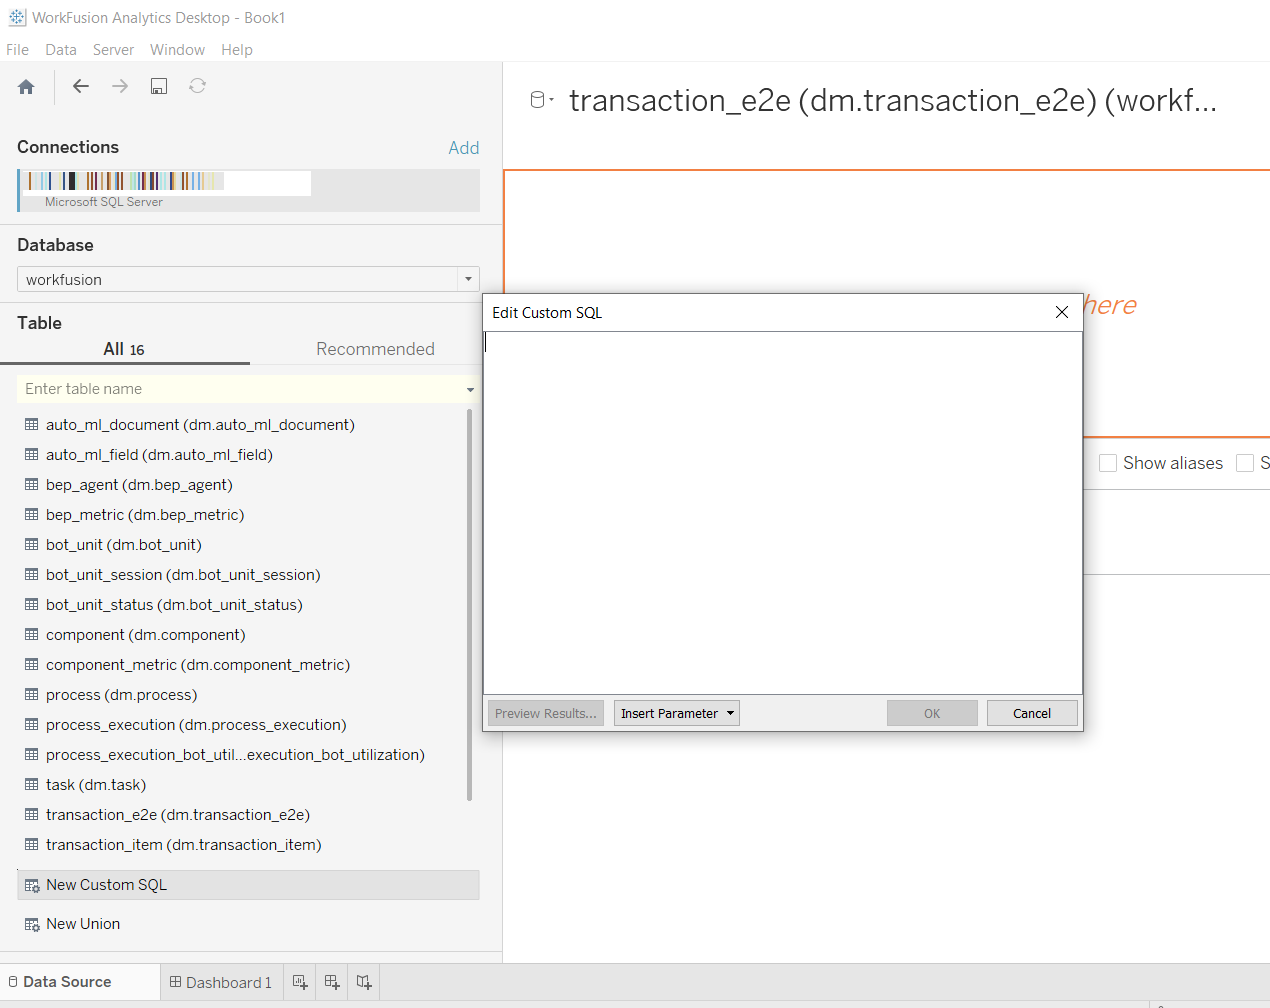
Drag the transaction_e2e table to the white area on the right. Click the Update Now button. You will see the actual data from your table.
To add a specific query, drag New Custom SQL to the end of the list. Then, specify the required SQL query for accessible DB tables.
In the center of the window, click the Go to Worksheet button to proceed to the visual editor.
Setup Worksheet
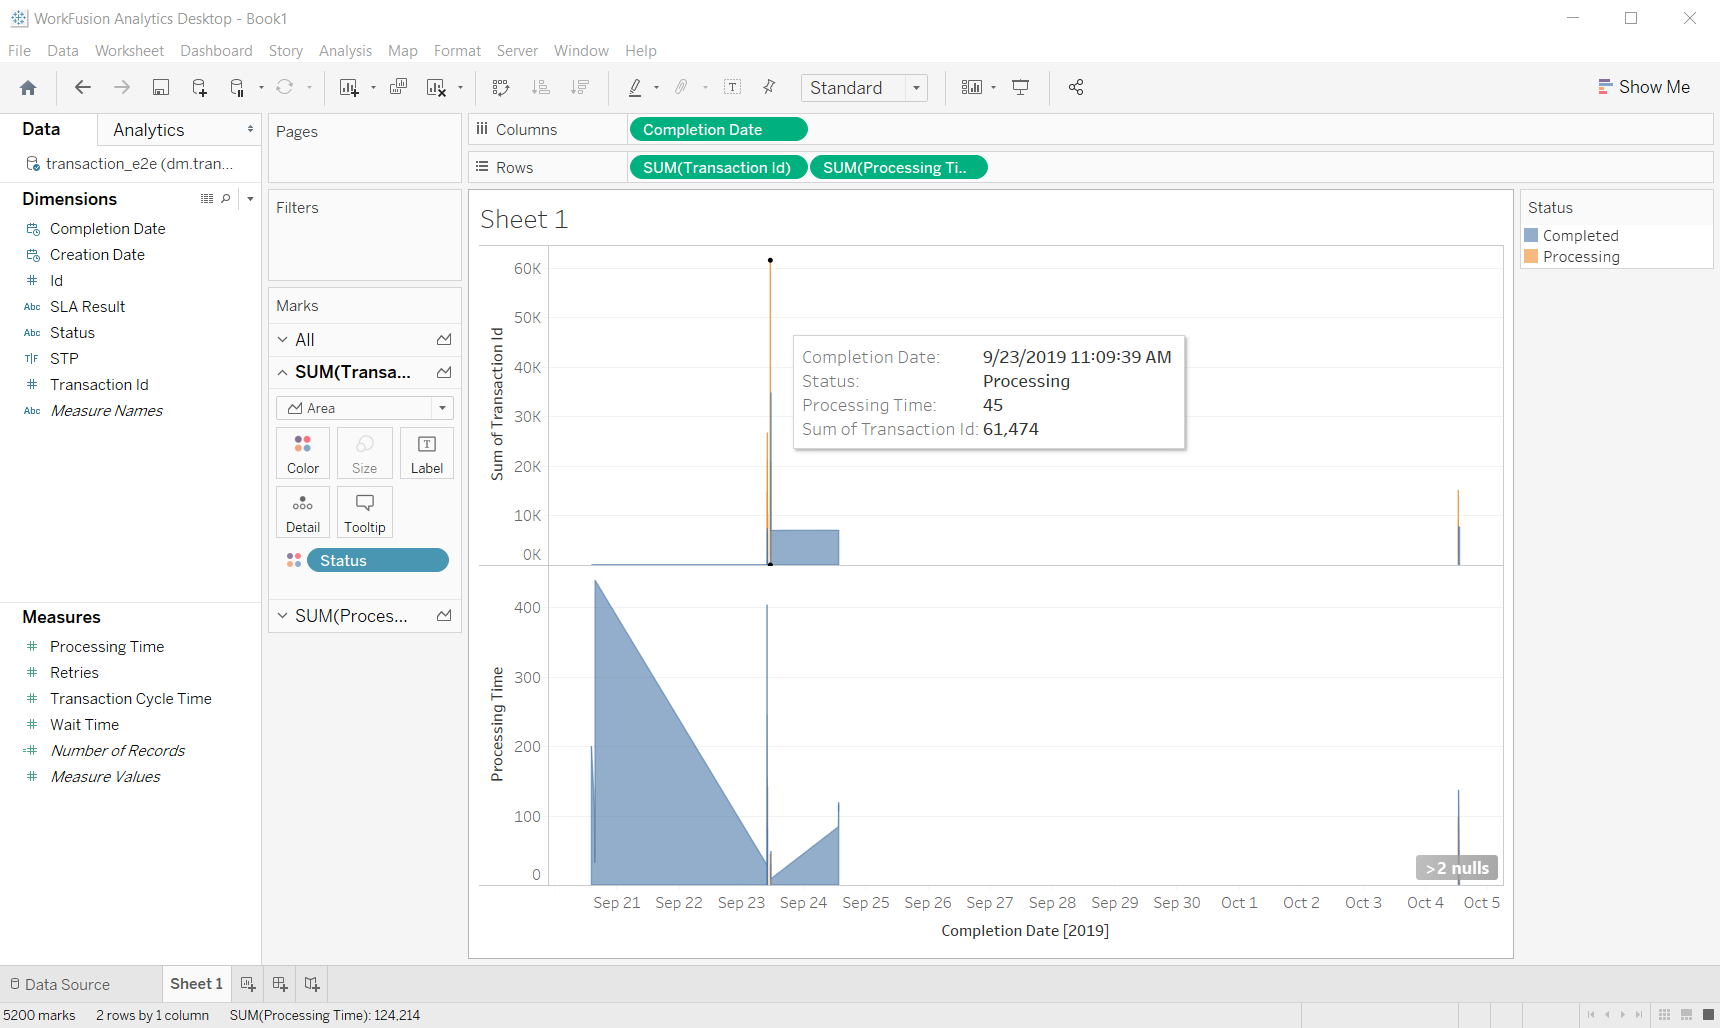
On the Worksheet page, the following major working areas are available:
- Dimensions/Measures
- Pages/Filters/Marks
- Chart Preview Area
- Columns/Rows
- Chart Type (Show Me)
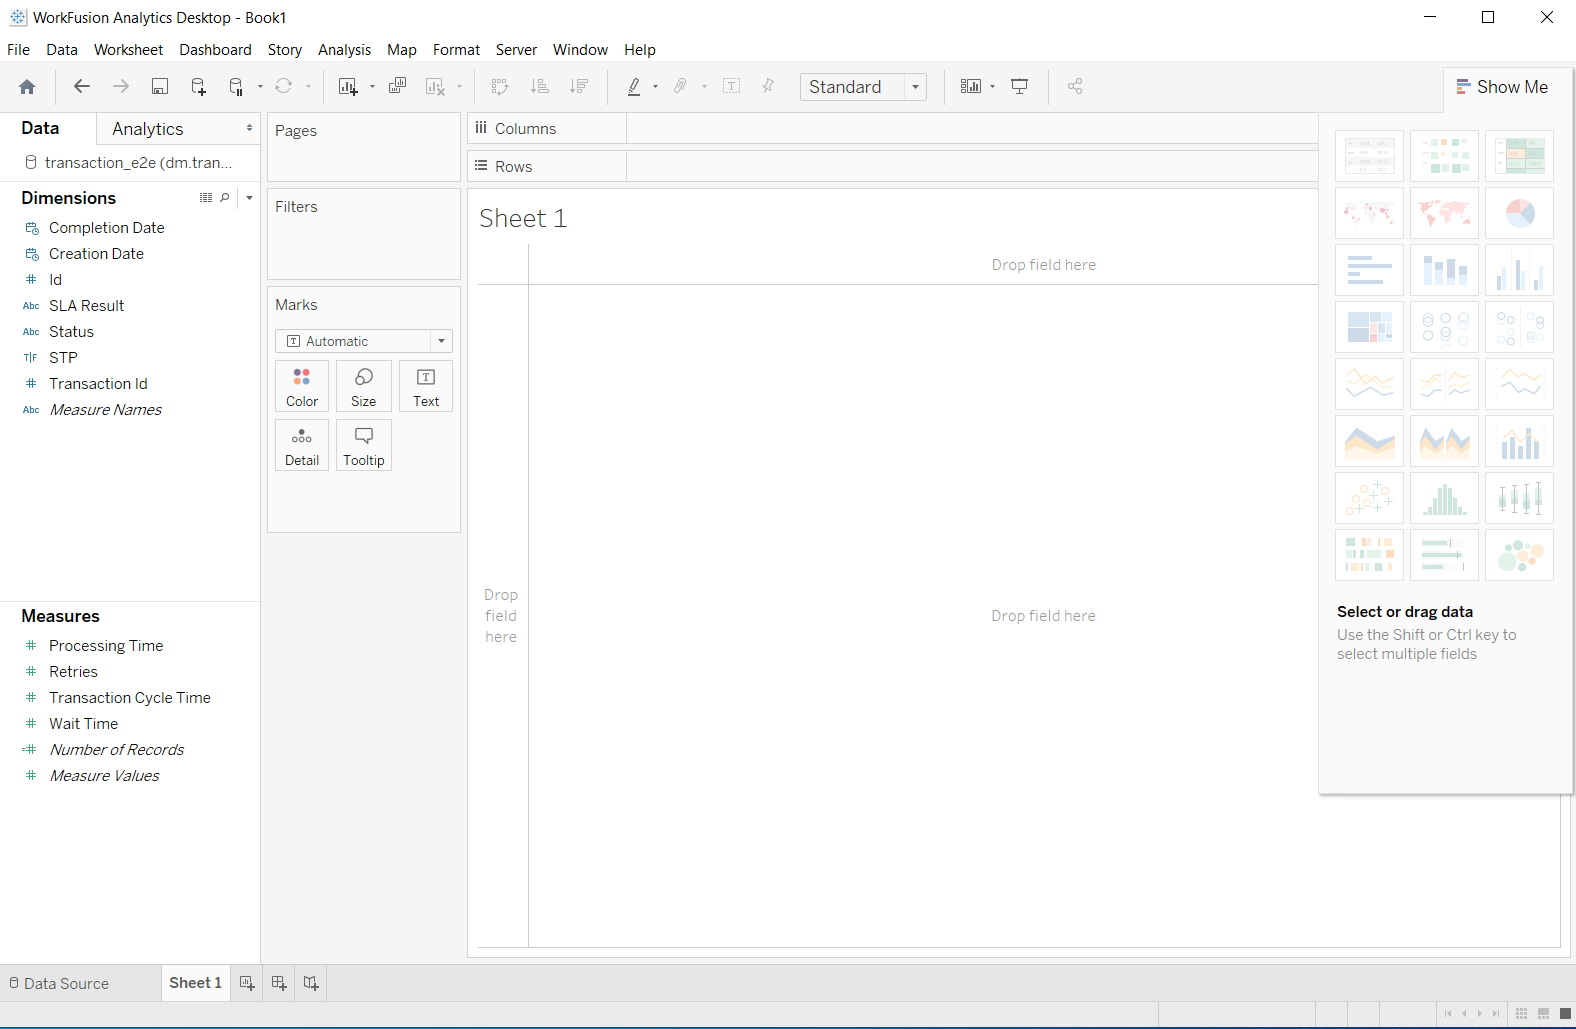
To setup a worksheet, follow the instruction:
Drag the following elements:
- Dimensions > Completion Date to the Columns
- Dimensions > Transaction Id to the Rows
- Measures > Processing Time to the Rows
Try different chart types to find the most suitable representation.
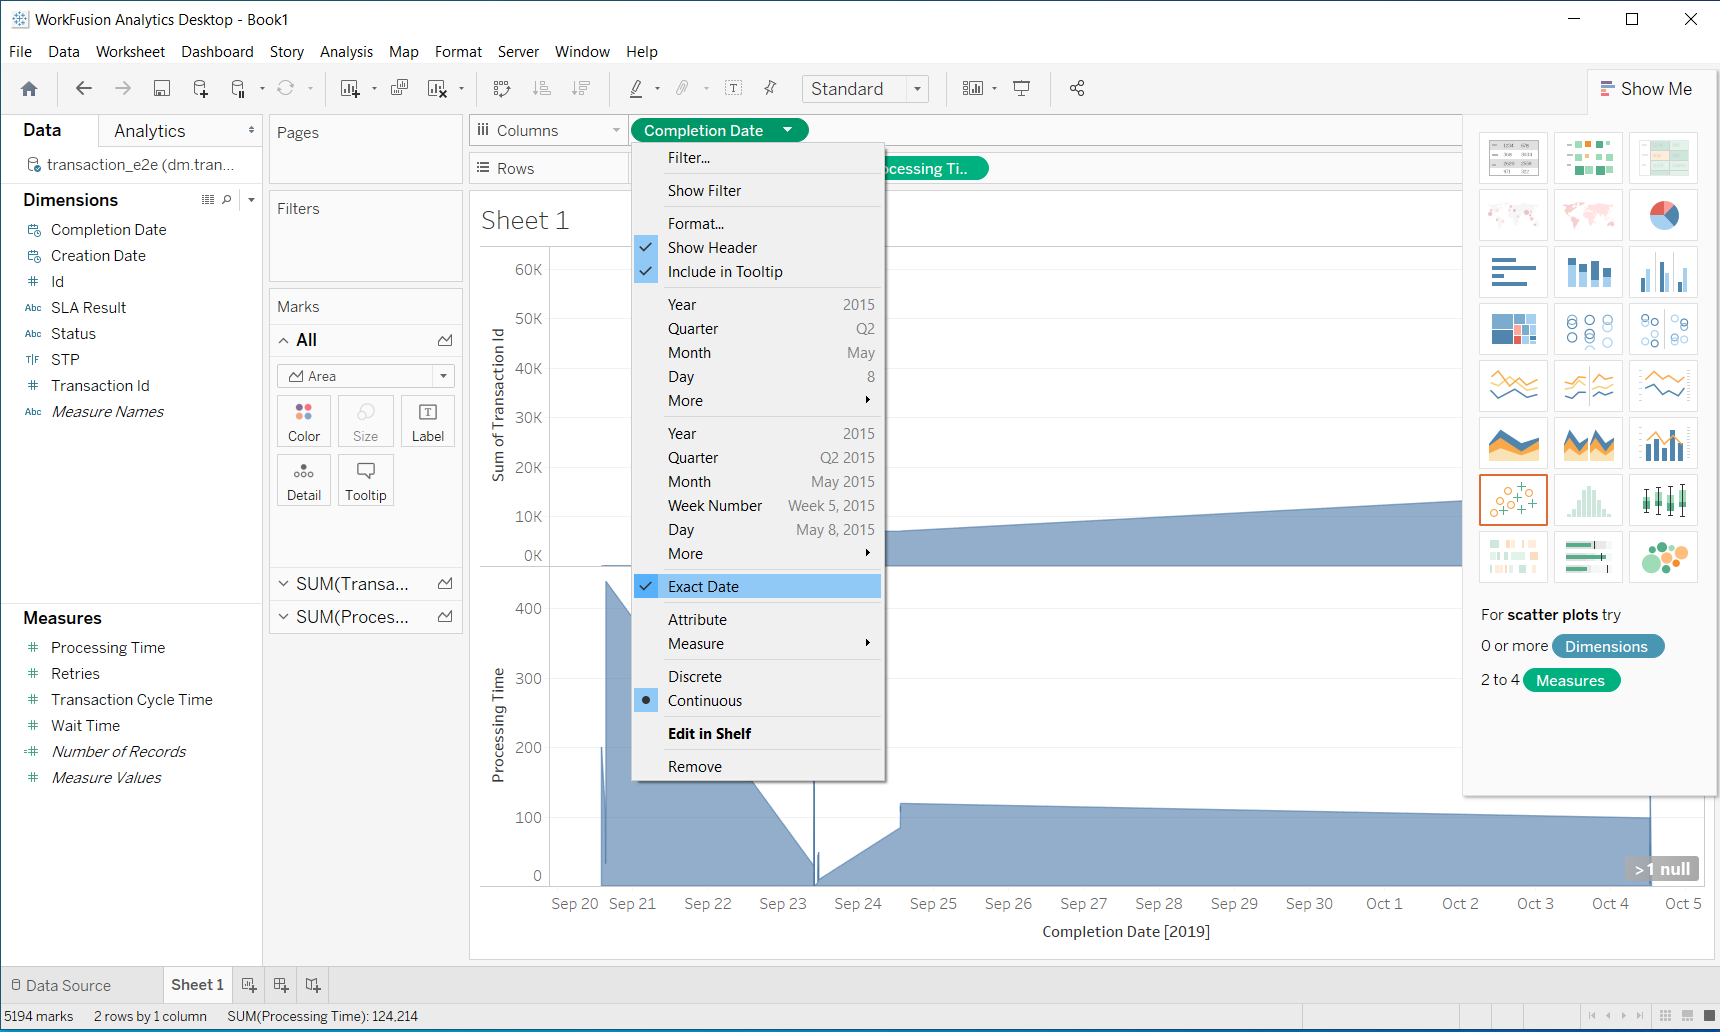
In the Columns area, right-click the Completion Date element and select the Exact Date option.
In the Rows area, right-click the Transaction Id element and select the Measure > Sum option.
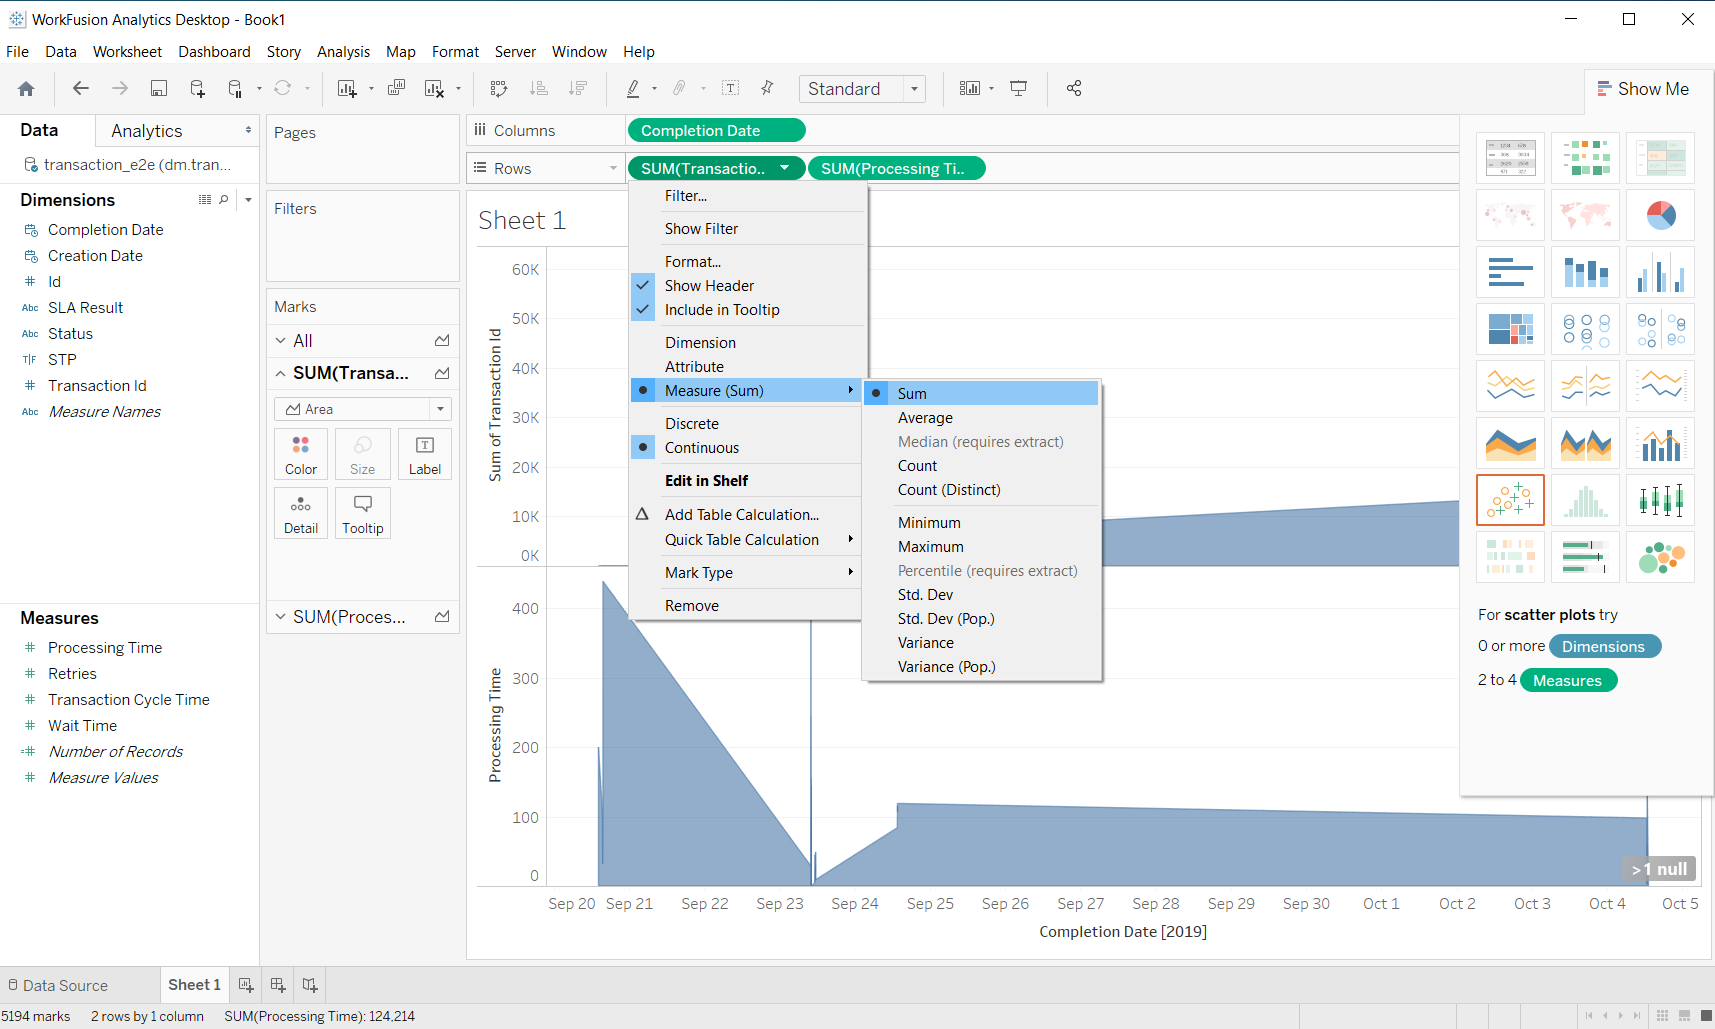
In the Marks toolbox, select the Area type. The area below the chart is filled with color.
To add differentiation by the Status column, drag the Status column from Dimensions to the bottom of the Marks toolbox. From the context menu to the left of it, select Color.
Setup dashboard
When your worksheet chart is ready, add filters as described below to set up a dashboard:
On the main menu, select Dashboard > New Dashboard to create a dashboard.
On the Dashboard view, drag your chart from the left menu to the design area. The Chart appears.
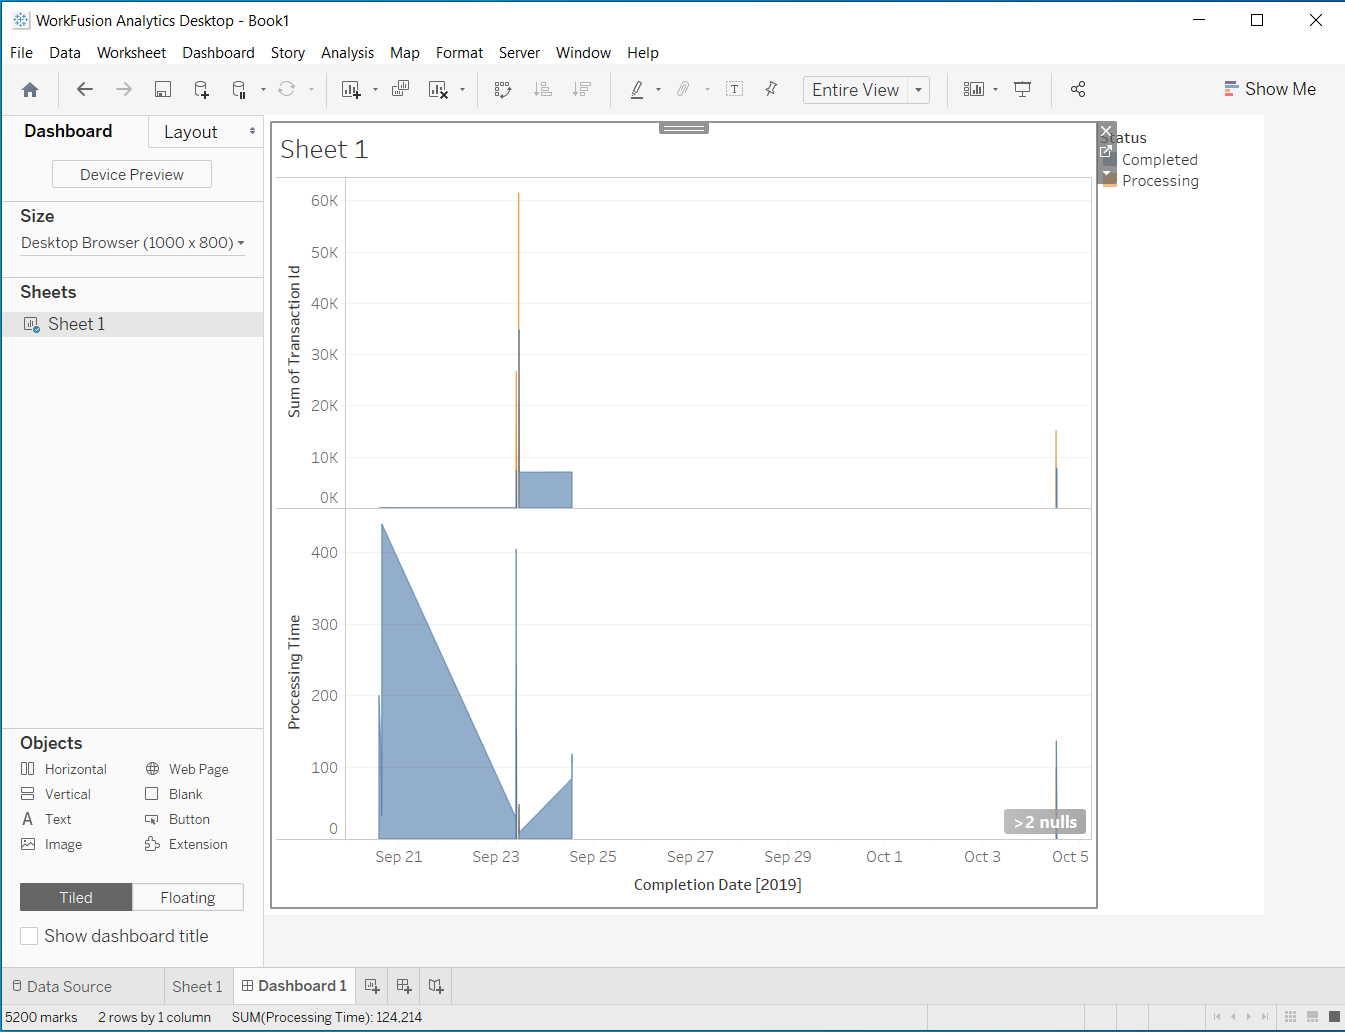
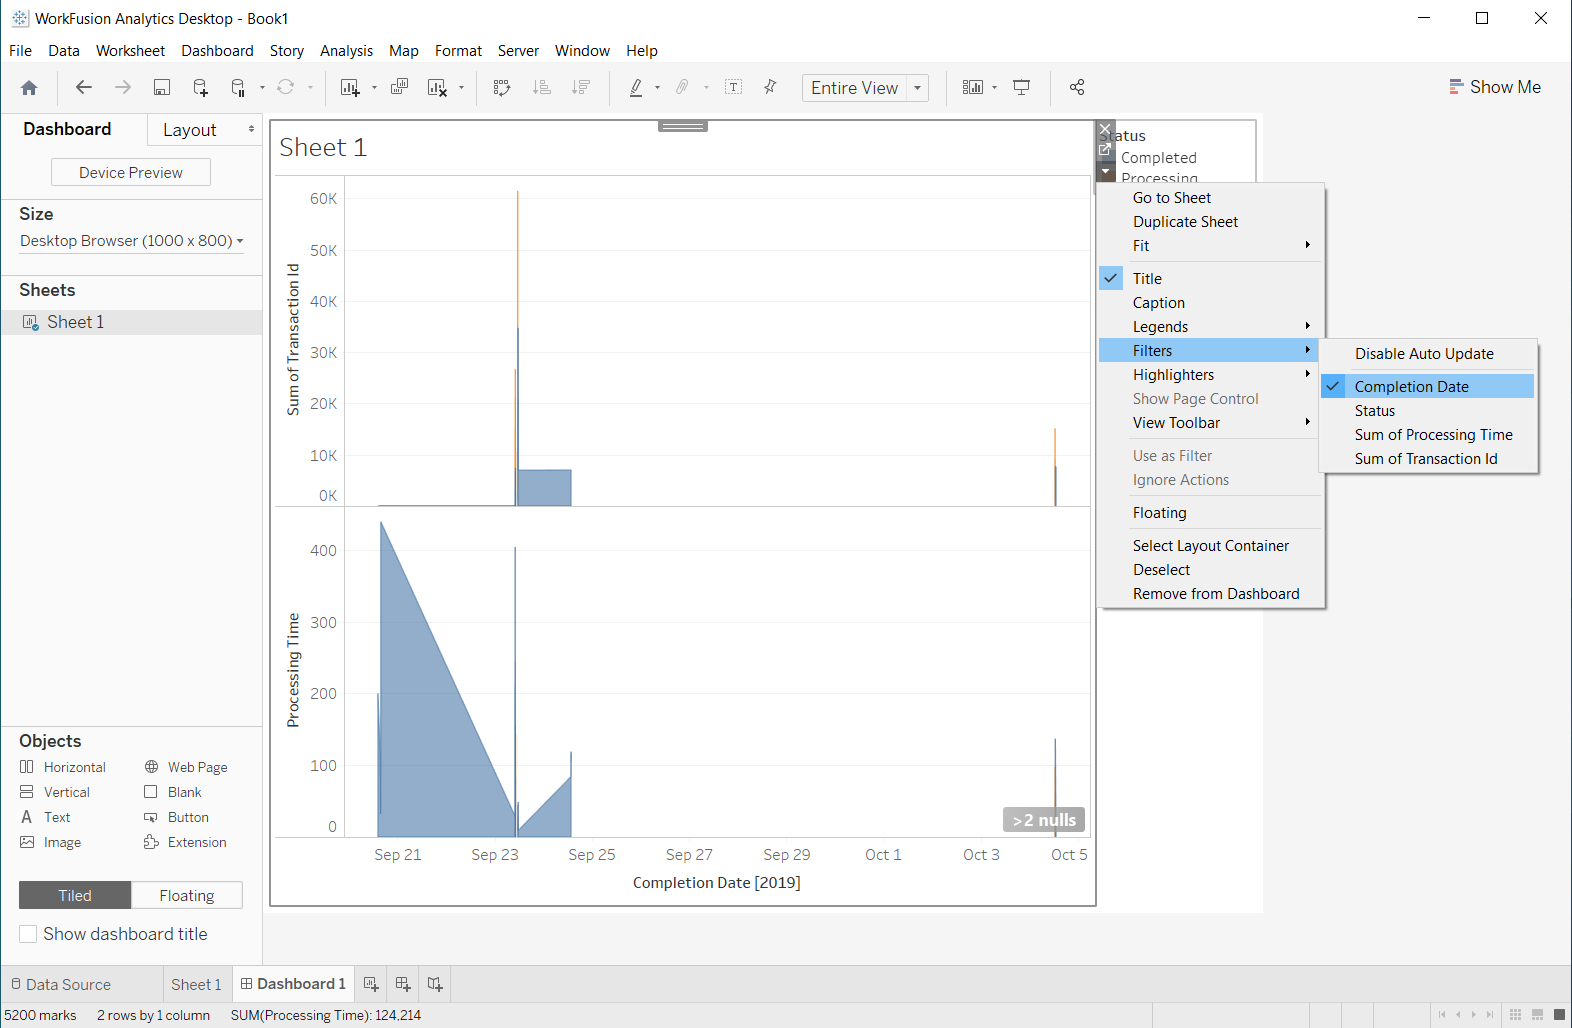
From the Chart context menu, add filter by Completion Date and change the filter position and the legend.
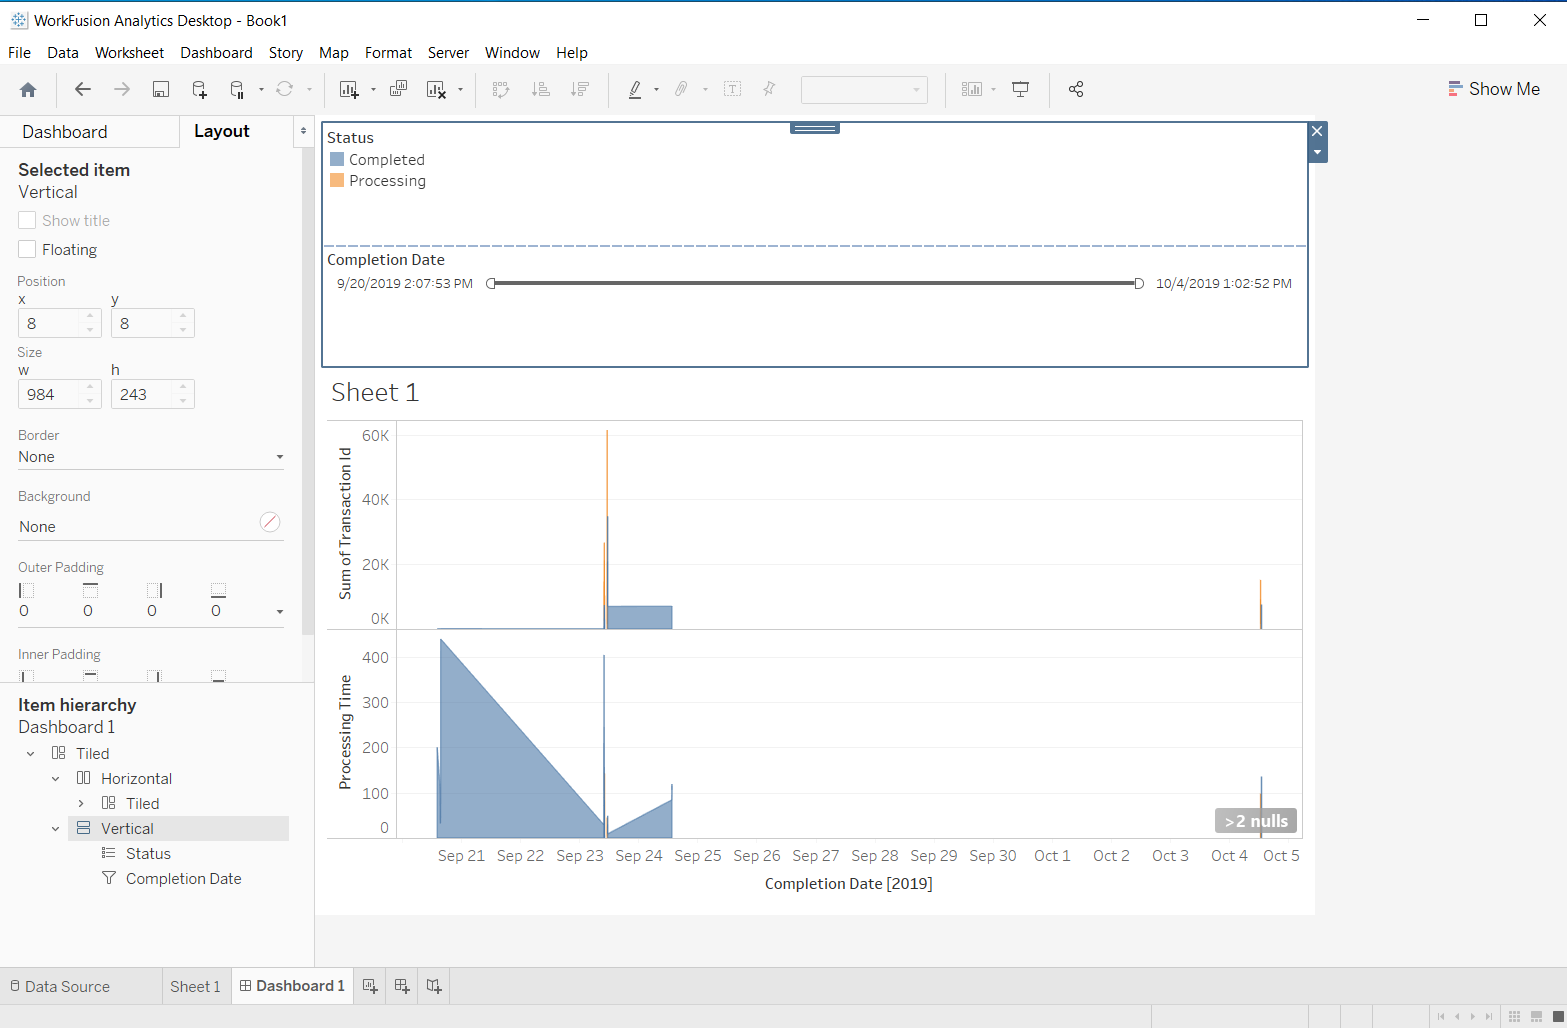
You can change the size and position of layout objects. Typically, all parameters are on the top.
Usually, not all sheets are visible.
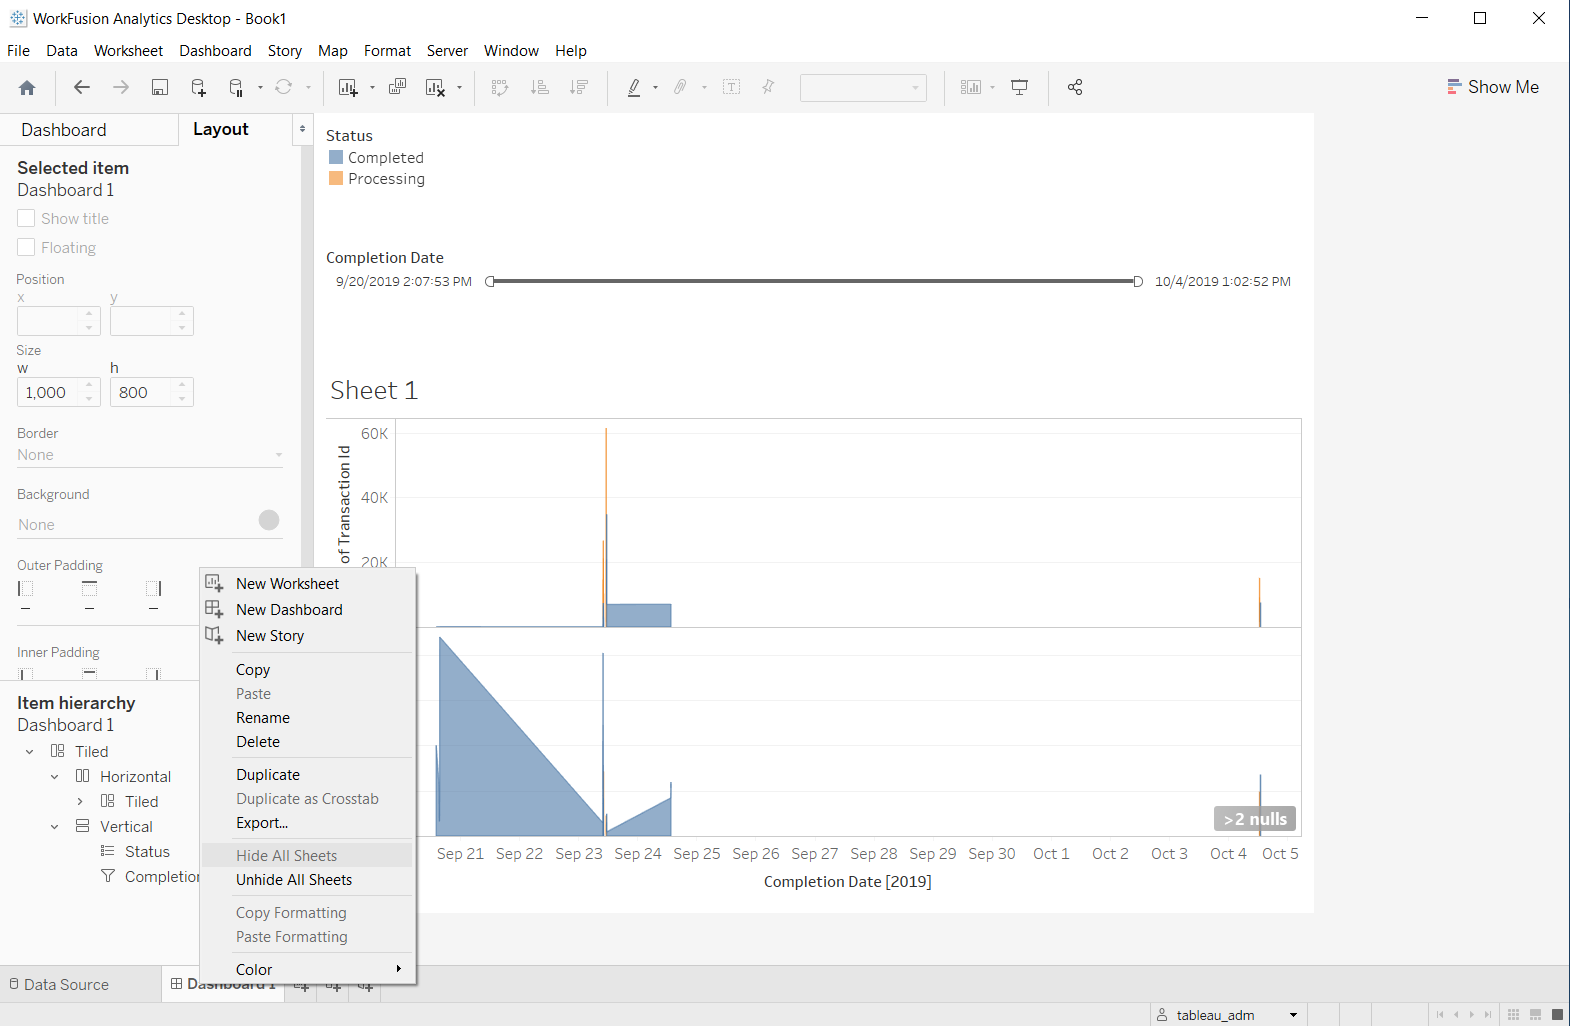
Click File > Workbook Locale > English (United States) to change the locale. You can also edit chart colors, fonts, labels, and so on.
Give Dashboard1 an appropriate business name to be displayed on the Control Tower page.
Deploy dashboard
To deploy the dashboard to the WorkFusion Analytics Server:
To connect to the server, open the main menu and select Server > Sign In, enter the server name.
To start the deployment, select Server > Publish Workbook, and select your site from the dropdown menu.
Specify a name for your Workbook to appear on the WorkFusion Analytics Server. Always add the _custom postfix to the names to meet the WF dashboard configuration requirements.
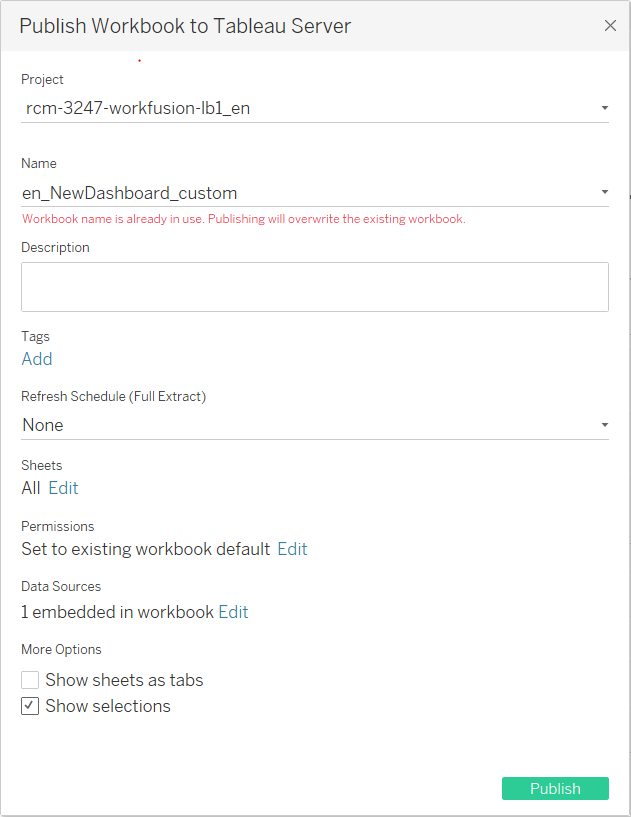
The name can also include a prefix signifying the language you choose for the dashboard. For now, three languages are available with the following prefixes:
- English—en_
- Spanish—es_
- Japanese—ja_
The name of the project must be the same as the name of the instance.
If there is only one custom dashboard, go to the More Options section and clear the Show sheets as tabs checkbox. If you keep the selection, several custom dashboards are displayed on separate iframes.
In the Refresh Schedule section, select a scheduler if needed.
In the Data Sources section, confirm using an embedded password to let users see the dashboard without entering the WorkFusion Analytics Server password.
Click Publish. The confirmation dialog with a preview appears.
note
To publish a workbook, a user must have the Publish permission.
Manage deployed dashboards
To manage deployed dashboards, sign in to the web Admin module of the WorkFusion Analytics Server with the same credentials as for WorkFusion Analytics Desktop.
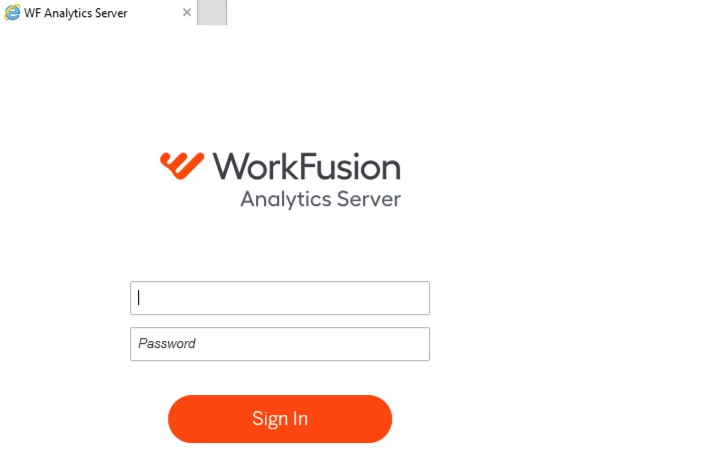
Here, you can delete workbooks and change permissions to them. For details, refer to the guide.
Check deployed dashboard
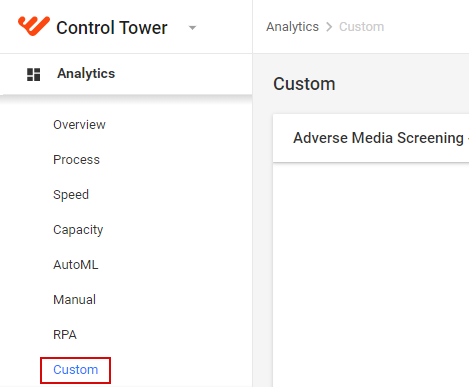
To check the publishing results, go to Control Tower. On the CT main menu, select Analytics > Custom, and make sure your custom dashboards are available there.