
Search a specific message in logs
You can search through logs via three different ways:
Workfusion SPA Application Logs dashboard.
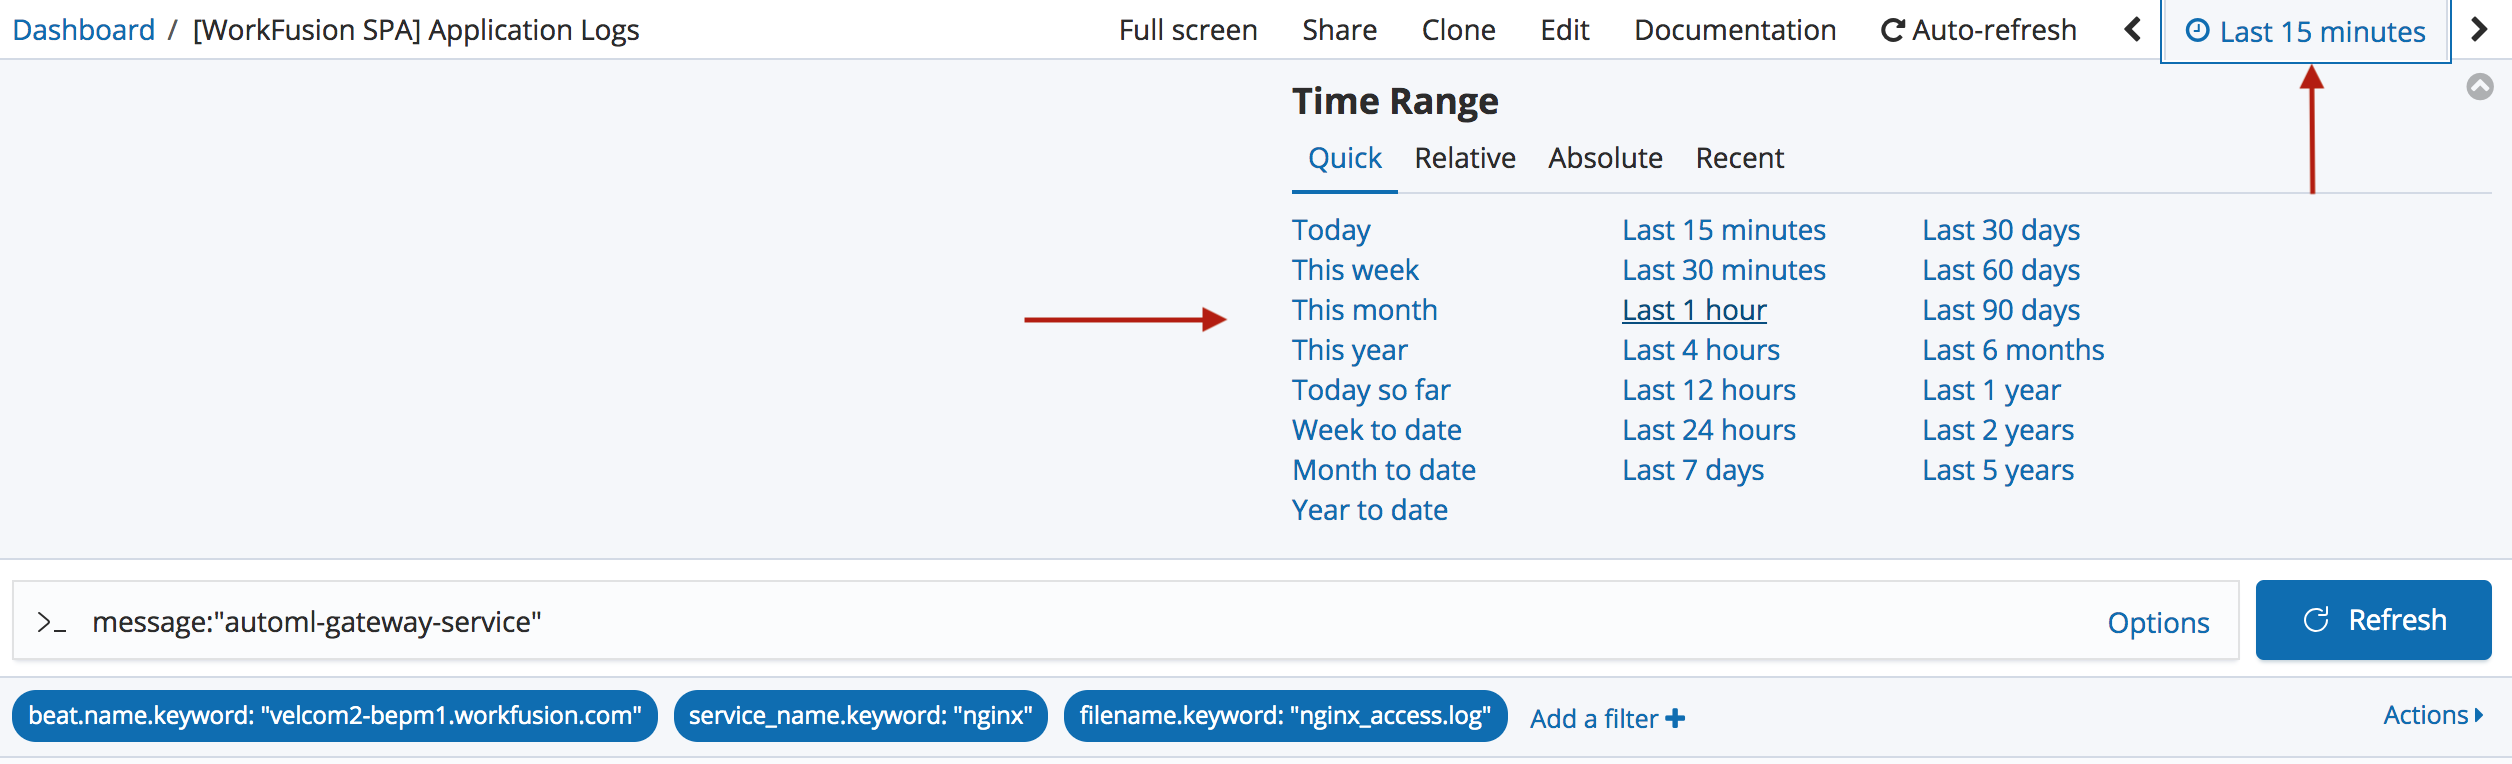
The simplest and most convenient way to find latest logs of a particular service. The dashboard already contains commonly used fast filters to narrow the search. Note that the dashboard doesn't show the BEP Agent logs.
Discover
A more complex and customizable way. Here, you can refine your search, and find the BEP logs, as well as the logs from other services. Filters can be created on-the-fly. The search field supports Kibana Query Language (KQL).
Logs UI
Useful for reading logs in the realtime. Provides the stream of logs, and the alternative temporal navigation for logs. The search field supports Kibana Query Language (KQL).
For additional details not mentioned in this document refer to the official Kibana guides:
- Using search - https://www.elastic.co/guide/en/kibana/current/search.html
- Discover - https://www.elastic.co/guide/en/kibana/current/discover.html
- Logs UI - https://www.elastic.co/guide/en/infrastructure/guide/current/logs-ui-overview.html
Dashboard
To search a log message via Workfusion Dashboard:
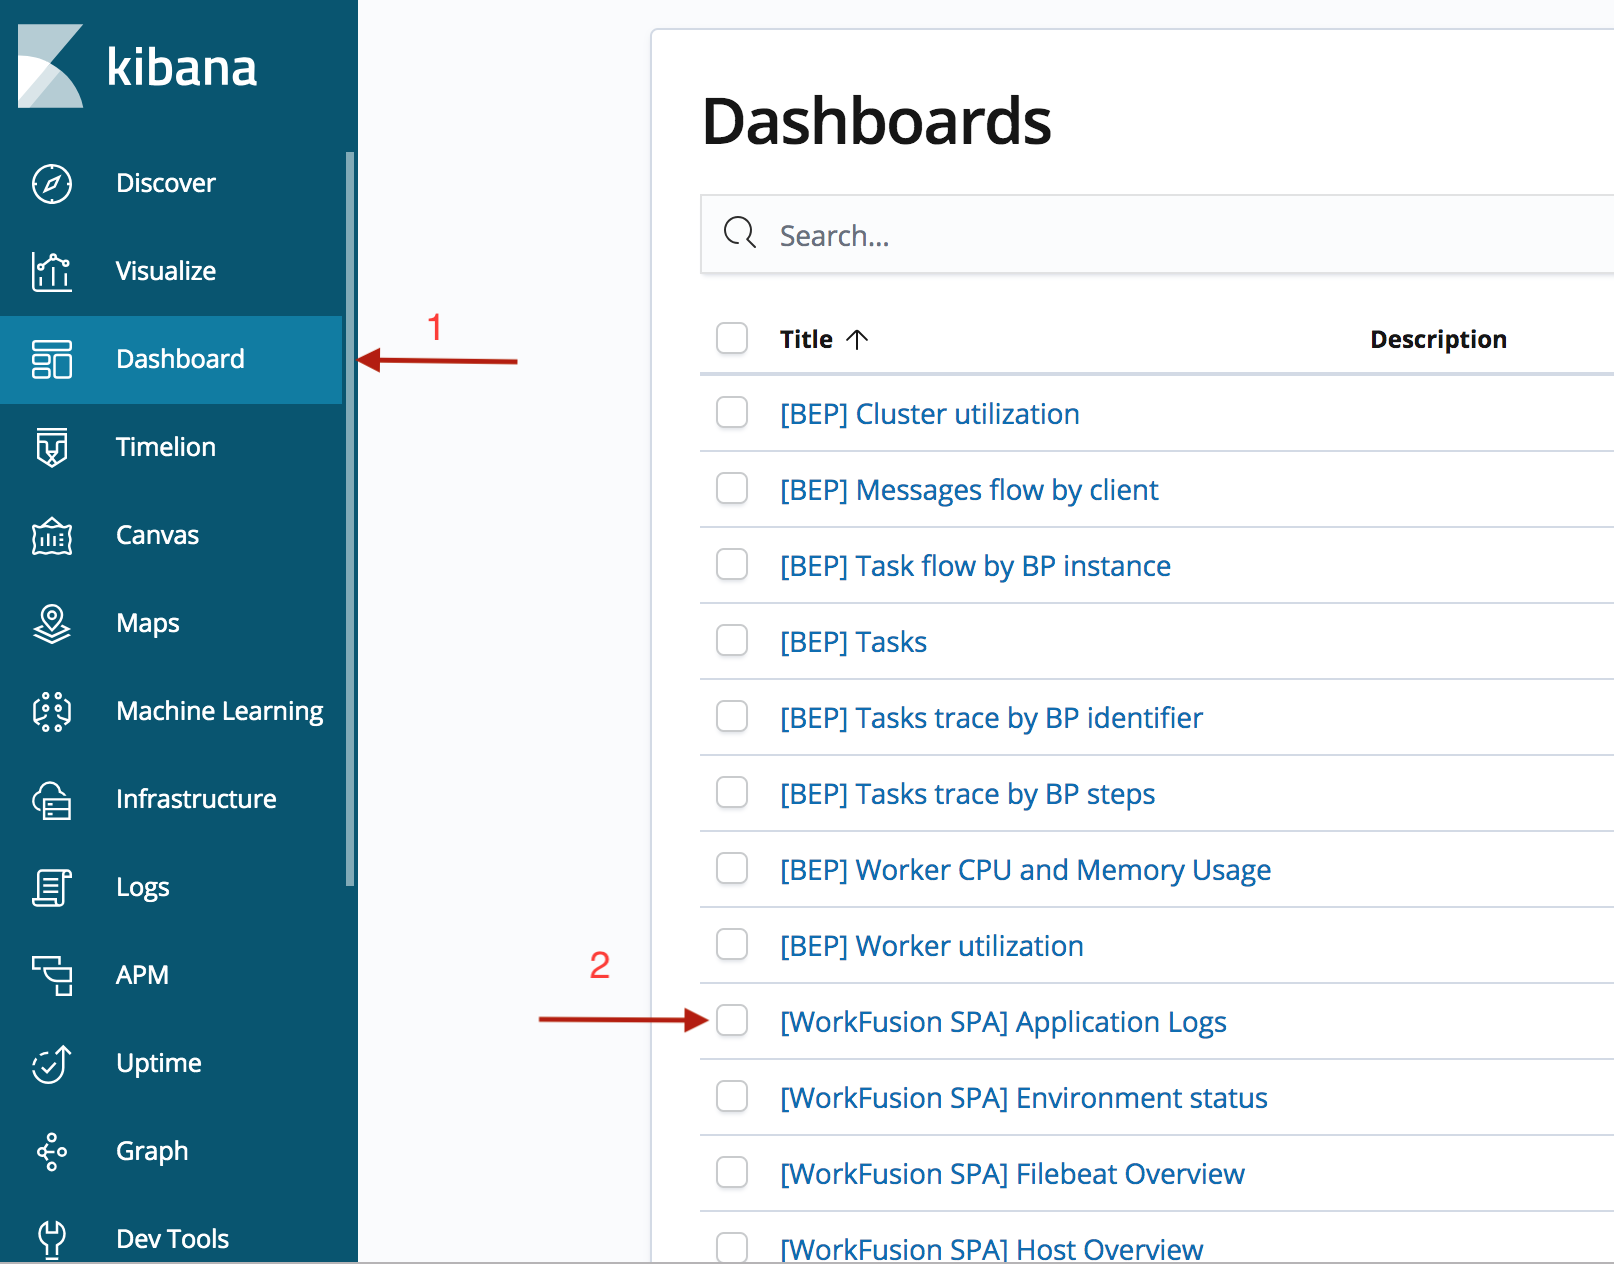
Open the Kibana Dashboard page.
Open the [WorkFusion IA Cloud] Application Logs dashboard.
In the Search field, enter a message to search, for example,
"automl-gateway-service", and then click Refresh. For more details on search queries, see Kibana queries and filters.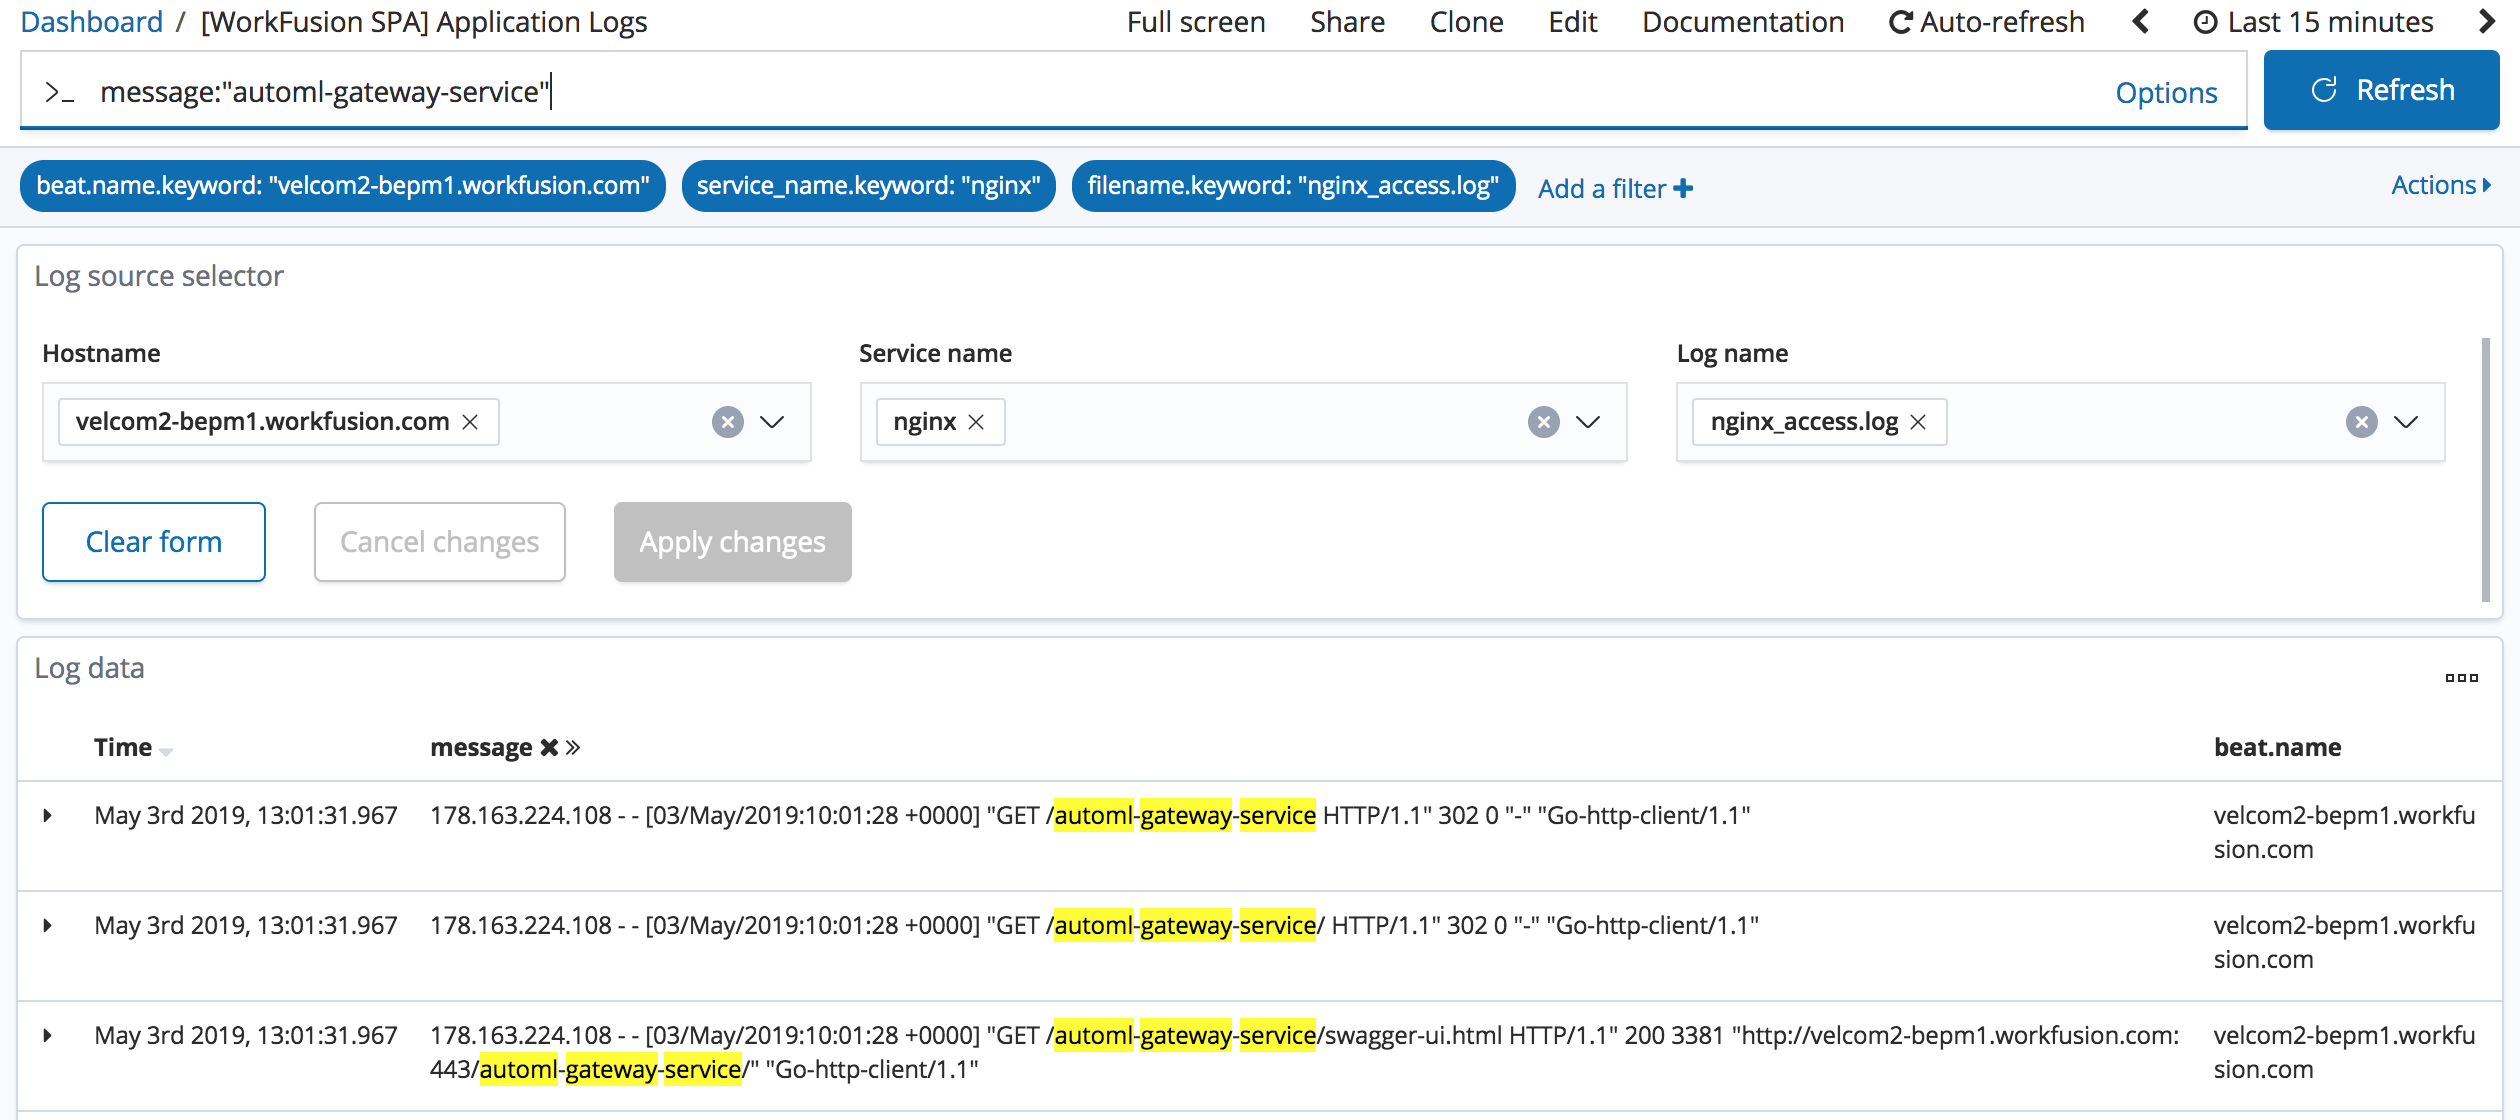
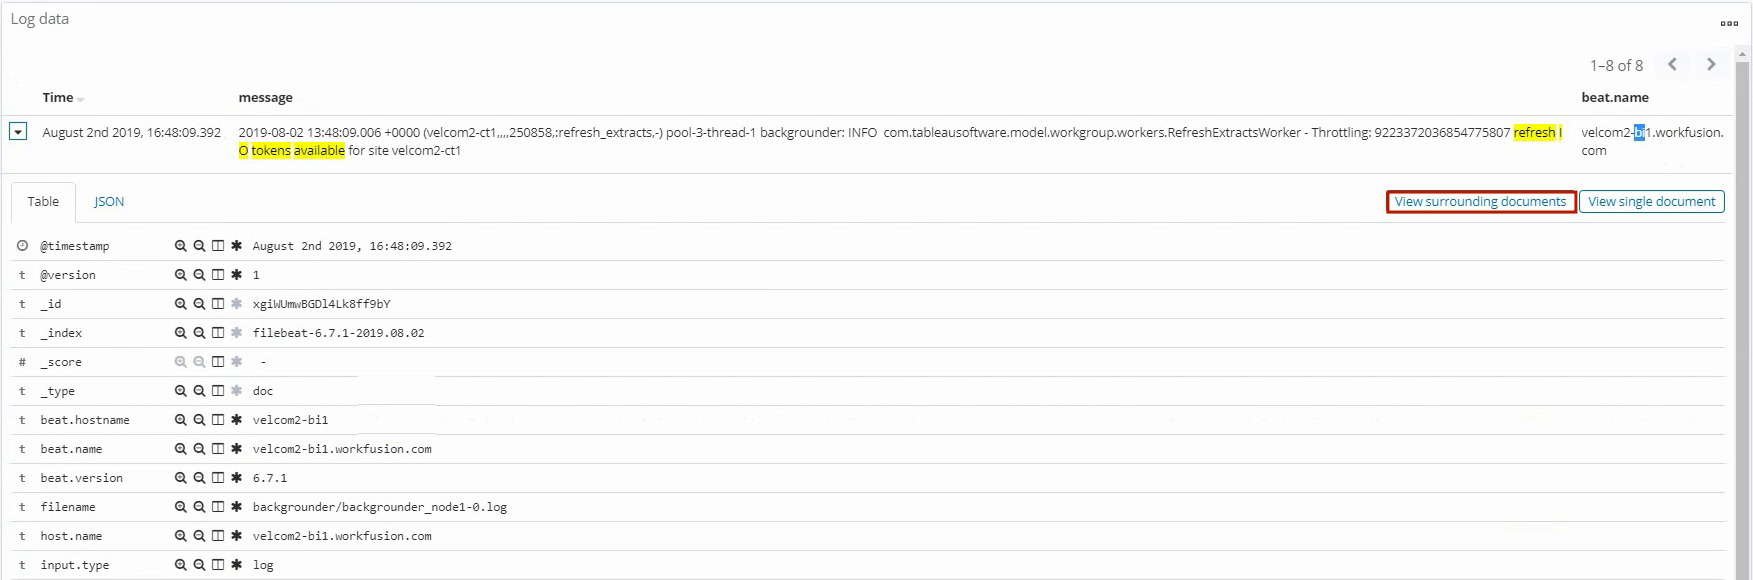
After you find the required log, expand it to view the details.
To view the context of the log, click View surrounding documents.
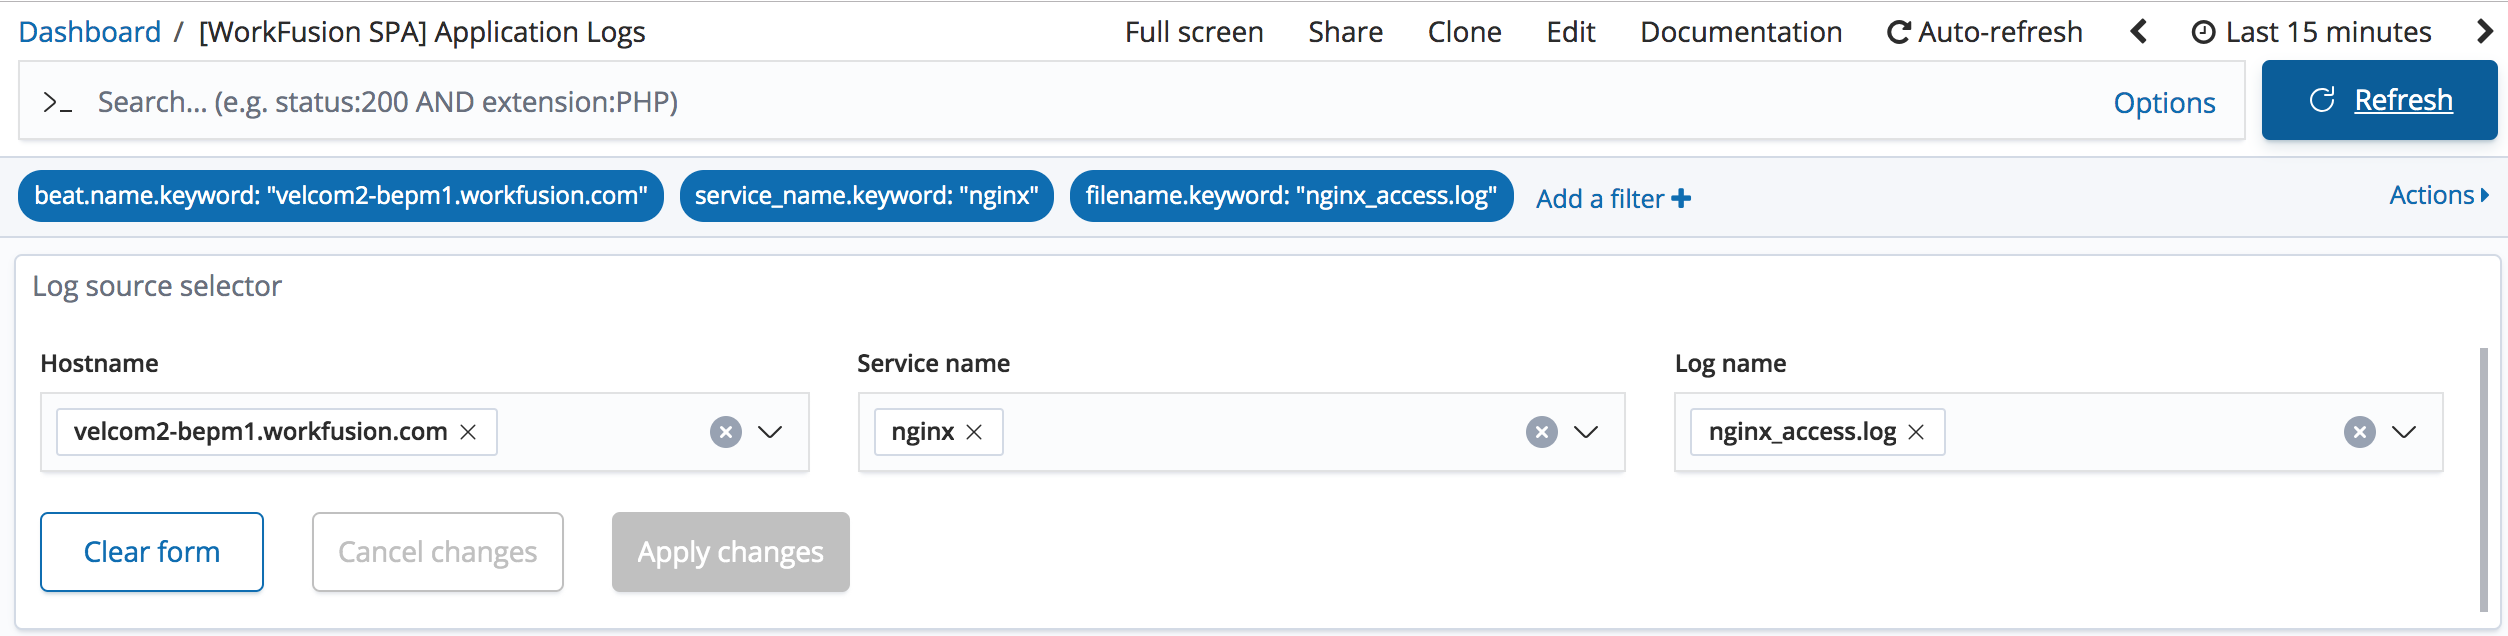
To view the whole logfile, not just a message in it, clear the message box, specify Hostname, Service name, and Log name that are shown in the details of the log, and then click Apply changes.
To change filtering time range, open the Time-range menu and choose the time interval for logs filter.
Discover
To search a log message via Discover:
In the main menu, click Discover.
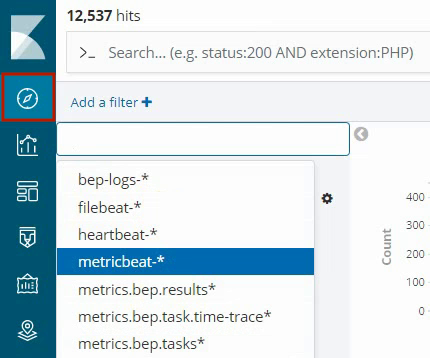
Select a required index:
- filebeat-*: the index of all running services. You can use the index, if the above Dashboard doesn't have necessary functionality.
- bep-logs-*: the index for all BEP Workers.
To customize your search, in the Available fields group, point to a required field, and click Add to select it.

When searching BEP logs, you can filter the worker logs by the app-name field, for example, Control Tower or AutoML.
Logs UI
To search a log message in Logs UI:
In the main menu, click Logs UI. The logs' stream appears.
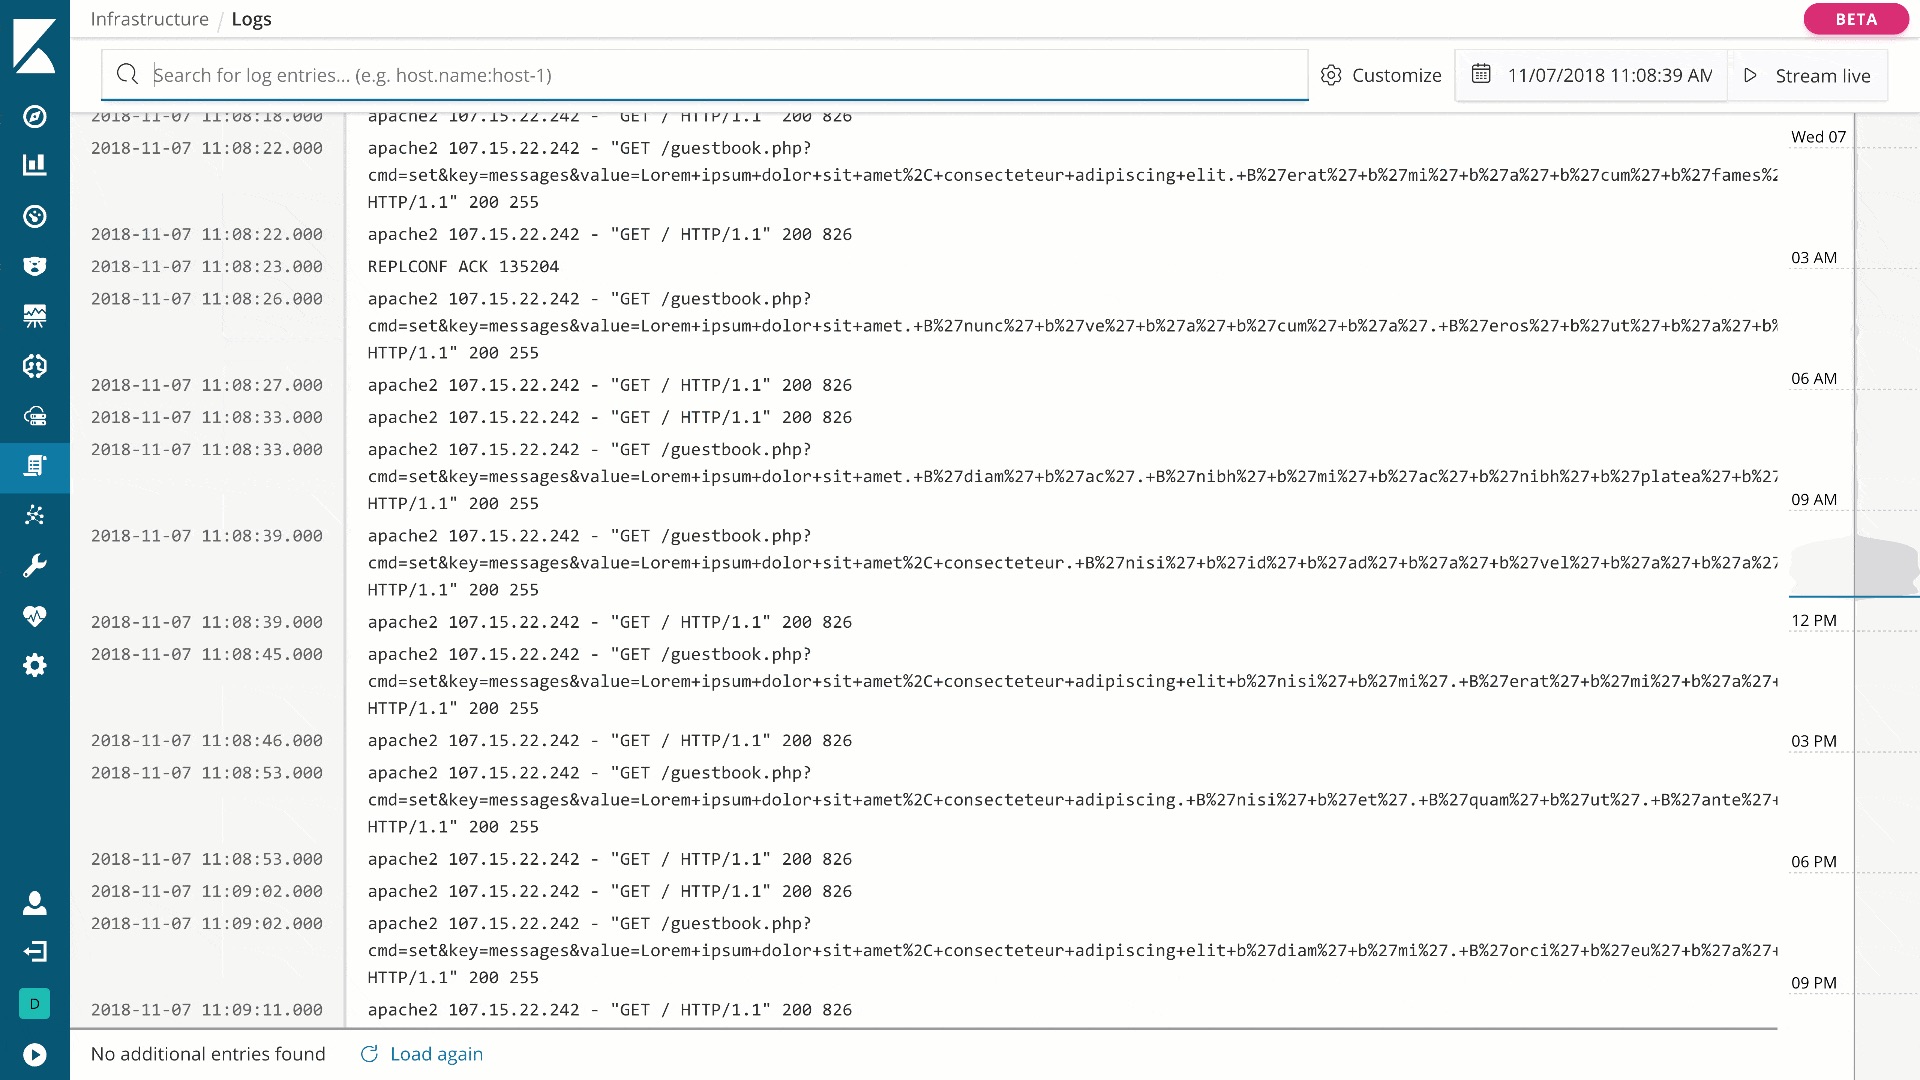
In the Search field, specify your query. Here, you can use the Kibana Query Language for search and results' refinement.

You can use the following parameters in most cases:
Field Description Examples service_name.keywordName of the service workspace, automl-gateway-service service_group_nameGroup of services, equals server type app, ocr, rpa beat.hostname.keywordHostname or FQDN of server example.domain.com
Filter specific service logs
- In the Filter panel, click Add a filter. The Add filter window appears.
- In the Filter group, in the Fields box, select service_name.keyword, in the Operators box, select is, and in the Values box, select the required service.
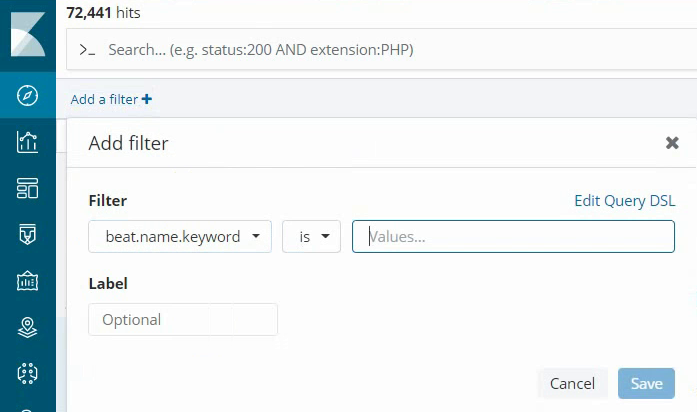
- Click Save.