
Aggregate and view logs
This article describes basic concepts of log aggregation.
Overview
The following log level options are available:
- prod — logs contain only error messages and warnings
- dev — logs contain error messages, warnings, info and debug messages
The default log level is prod, unless user specifies dev option before installation. User can also change log level for specific server or component, except for RPA and BI servers. Learn more in Change a component's log level.
The solution for logs aggregation consists of the following components:
- Kibana with logs filtering dashboards
- Elasticsearch for storing logs data
- Logstash for aggregation and forwarding log records
The log aggregation process is the following:
- An application writes logs to the filesystem.
- The Filebeat component reads the application log and forwards it to the log aggregation server.
- On the log aggregation server, Logstash receives log events from Filebeat and stores lines on the filesystem in a predefined structure.
By default, WorkFusion Intelligent Automation Cloud stores all component logs on the Integration server in the INSTALL_DIR/logs directory. All application logs remain both on source and Integration servers but with different retention policies.
Logs are stored with the following convention: INSTALL_DIR/logs/<server-group>/<hostname>/<component>/<date>/filename.log.
Example: /opt/workfusion/int/int.workfusion.com/nginx/2018-10-25/nginx.err.log.
| Element | Description | Example |
|---|---|---|
install-dir |
A directory to place user files, logs, and configs | /opt/workfusion |
server-group |
An alias for group of components | app, int, ocr, bi, rpa, bep_master, bep_agent |
hostname |
A real hostname of the server that sends logs | int.workfusion.com |
component |
A component's name | wfagent, workfusion, nginx |
date |
A date when a log event was created on the source server. Pattern: YYYY-MM-DD The date is created based on UTC time and thus may differ from the timezone configured on the server. |
2018-11-30 |
filename |
A log file name | metrics.log, status-agent-error.log |
View logs on UI
To view logs on UI:
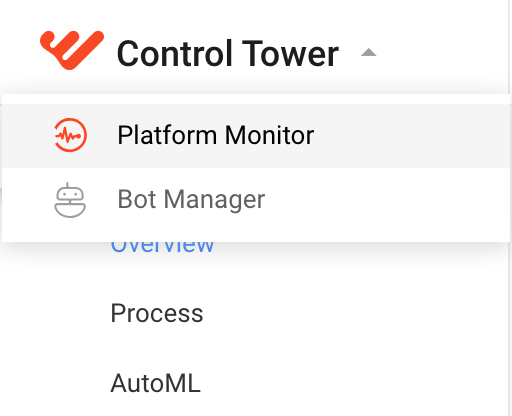
Go to Kibana, for example, at https://app.example.com/kibana. Alternatively, in the Control Tower dropdown menu, select Platform monitor.
Authenticate to Kibana using the ELK admin credentials, which you specify during the installation in the config.yml file.
# ELK
elk_admin_pass:    '********'   # password for elasticsearch user 'admin' used as login for Kibana UI
In Kibana, go to the Dashboard tab to open the preconfigured dashboards, including the designated one for logs.
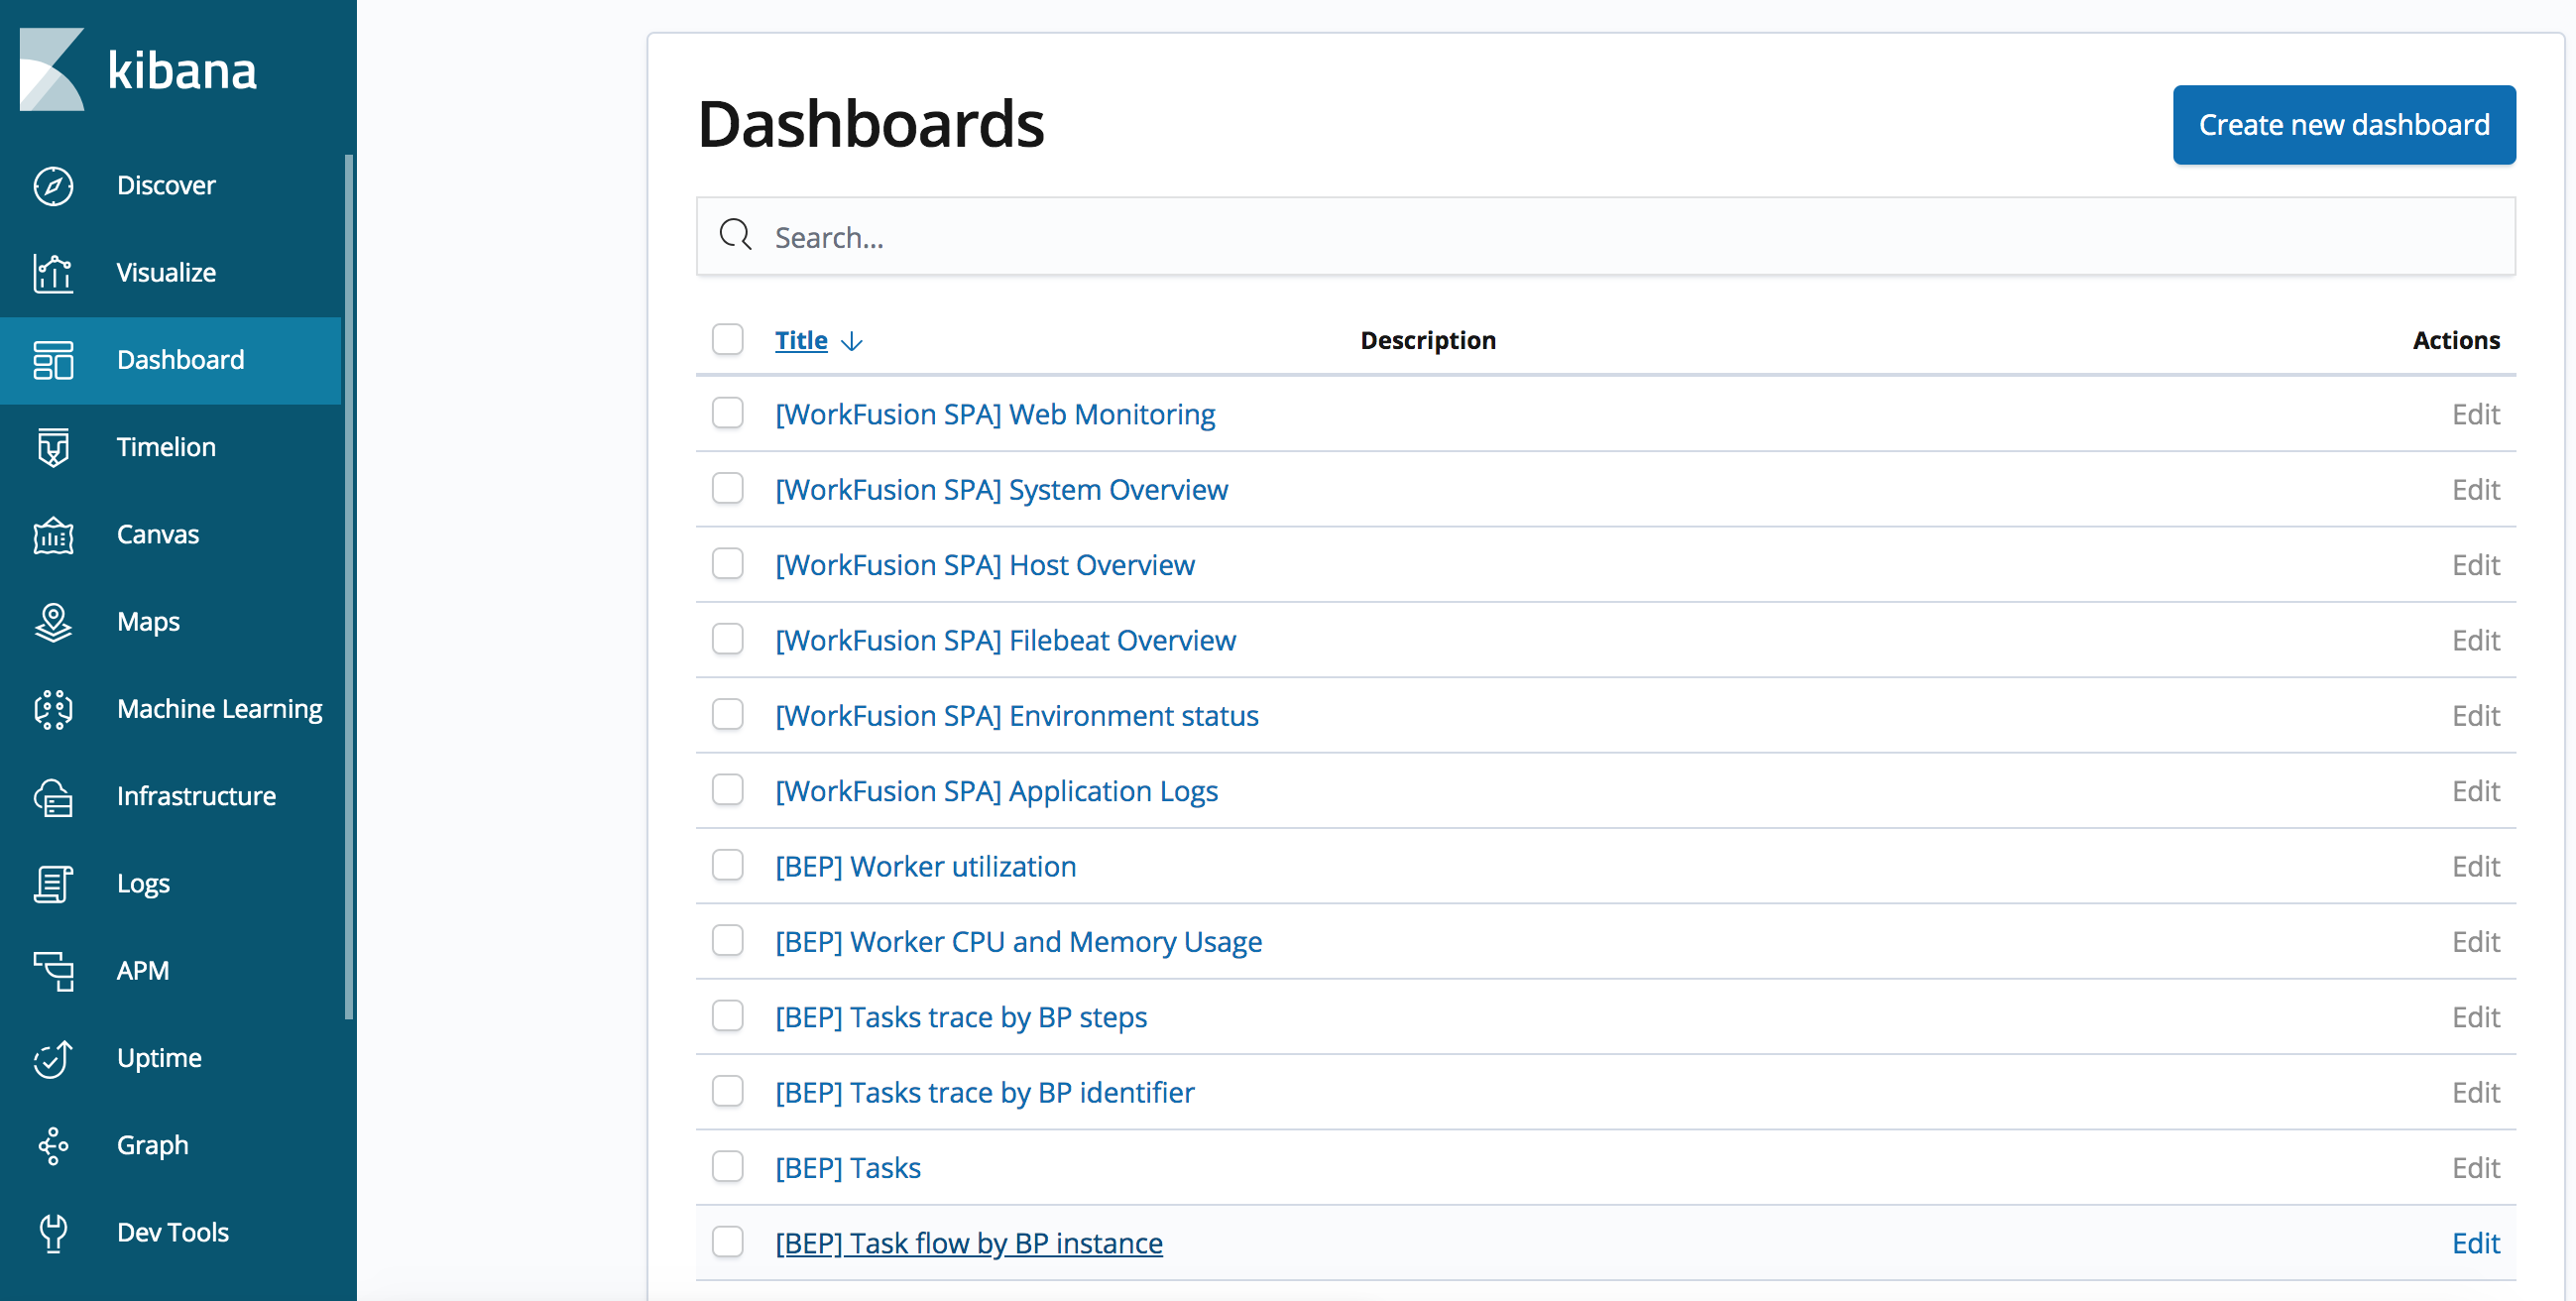
With this dashboard you can search and browse logs from all the servers and components.
To find logs from a particular component, in the Log source selector section, select one or several following parameters:
- Hostname – hostname of a server where the component is running.
- Service name – the name of a service.
- Log name – the name of a log to find.
Click Apply changes.
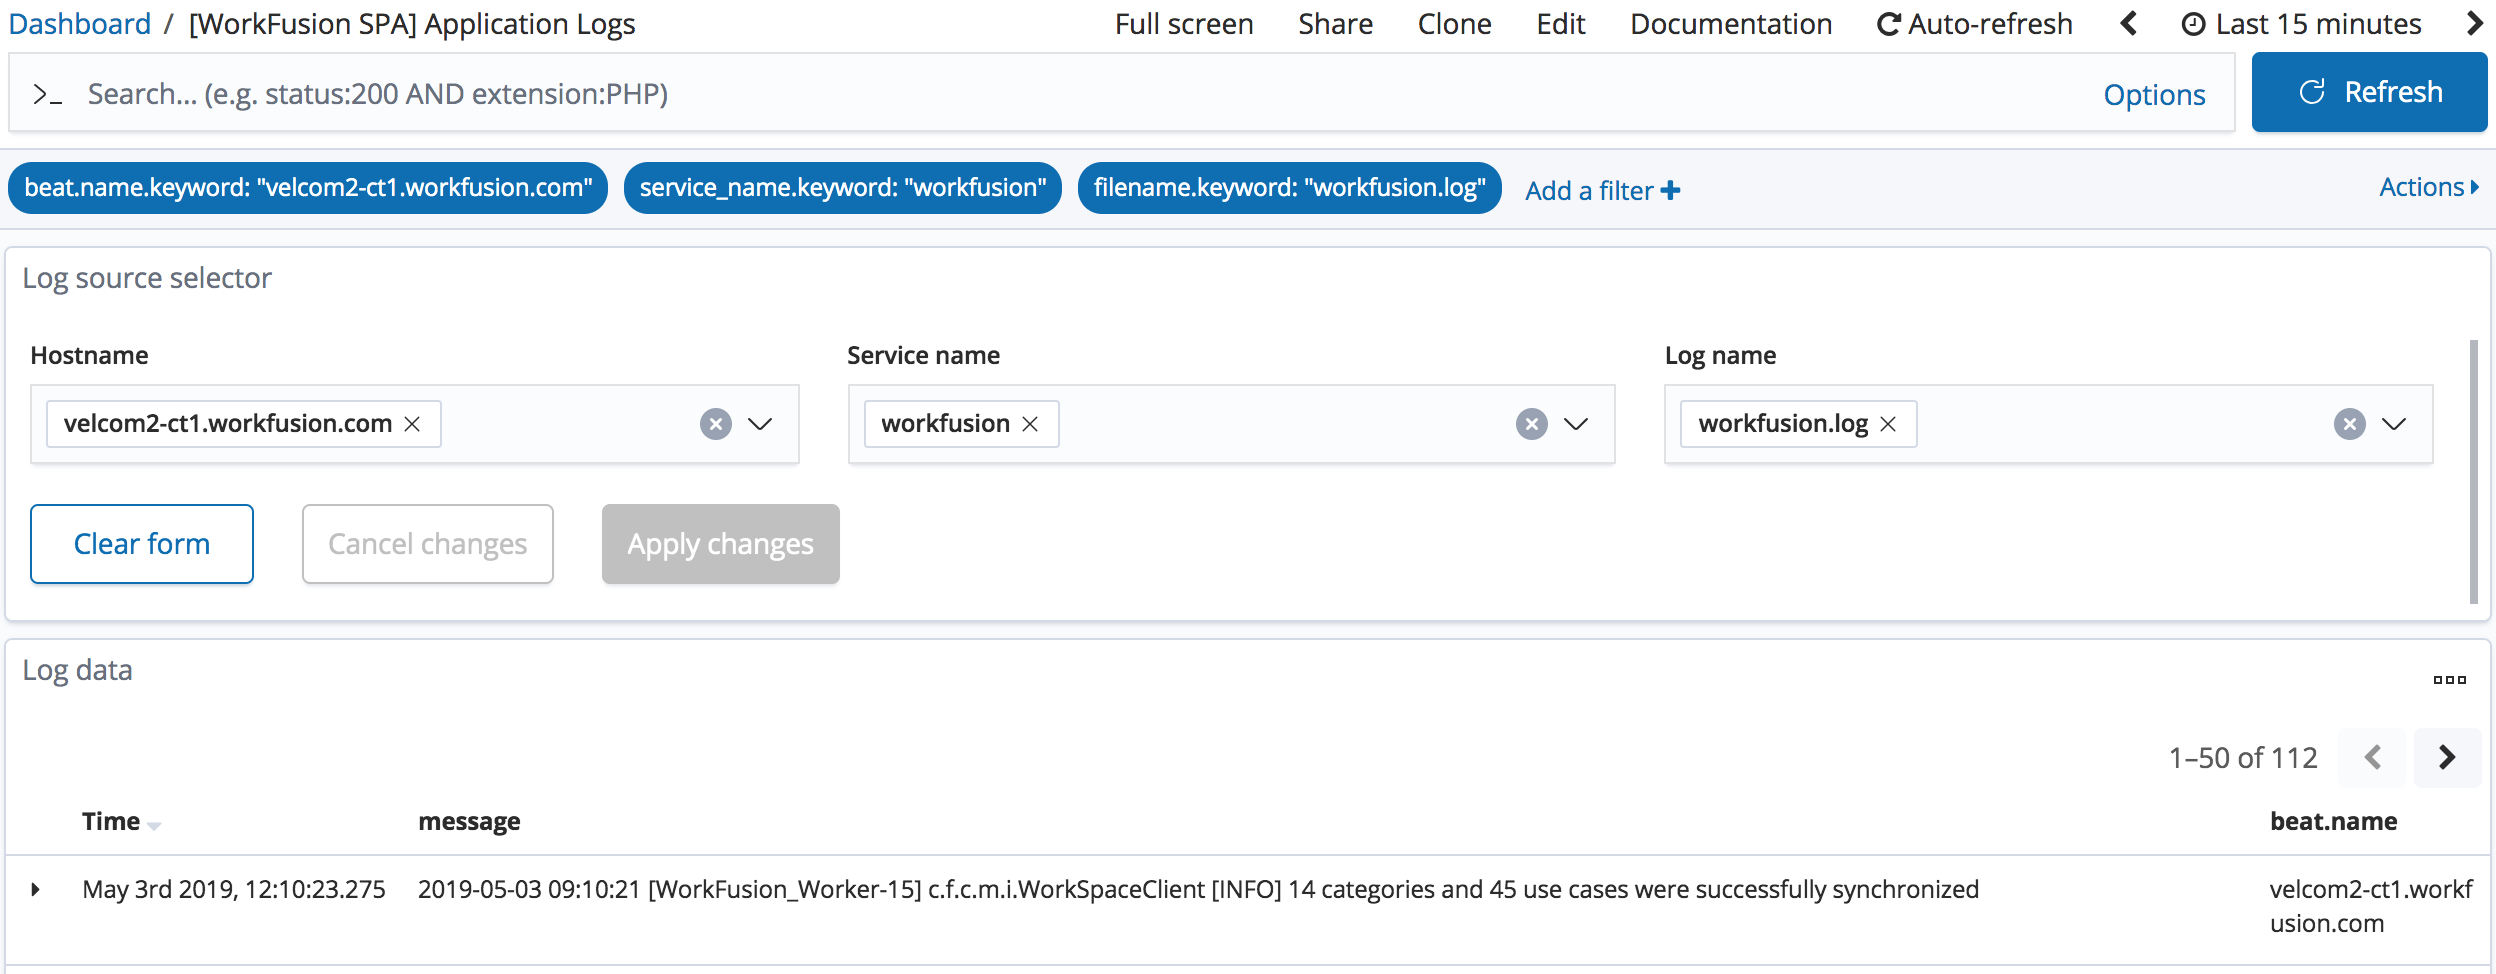
You can also refine the results by using the advanced filter with Kibana queries syntax in the Search field.